
the Creative Commons Attribution 4.0 License.
the Creative Commons Attribution 4.0 License.
 | 21 Sep 2023
Novel MHC BLB2 gene polymorphism and its association with IgY concentration and Newcastle disease antibody titer in IPB-D2 chickens
Dwi Lestari
Sri Murtini
Niken Ulupi
Asep Gunawan
Cece Sumantri
This study aimed to identify the polymorphism of the B Locus Beta 2 (BLB2) gene and its association with immunoglobulin Y (IgY) concentration and Newcastle disease (ND) antibody titer; we analyzed BLB2 gene expression in different categories of ND antibody titers in IPB-D2 chickens. The total sample used was 100 IPB-D2 chickens. Blood samples were collected at 21 weeks old for an ELISA (enzyme-linked immunoassay) test, an HI (hemagglutination inhibition) test, and genotyping. The method for BLB2 polymorphism was Sanger sequencing. Analysis of BLB2 gene expression was performed using the cecal tonsil tissue of IPB-D2 chickens. Polymorphism data were analyzed using SNPstats and DNAsp (DNA Sequence Polymorphism) software. The association of the single-nucleotide polymorphisms (SNPs) with IgY concentration and ND antibody titer was analyzed using SAS software (version 9.2). The genotype mean values were compared by means of a T test. The relative mRNA expression analysis was performed using a quantitative real-time polymerase chain reaction (qRT-PCR). The results showed that 13 SNPs were found in exon 2 and exon 3 in the BLB2 gene. As many as 4 out of the 13 SNPs were associated with IgY concentration. As many as 9 out the 13 SNPs may have changed amino acids. The ΔCt value showed that the expression of the BLB2 gene in IPB-D2 chickens with high ND antibody titers is higher than IPB-D2 chickens with low ND antibody titers. In conclusion, the AA genotype of g.458 T > A was associated with high IgY concentrations, and the BLB2 gene presented with a high expression in IPB-D2 chickens with high ND antibody titers.
- Article
(2498 KB) - Full-text XML
- BibTeX
- EndNote


The IPB-D1 chicken is a new breed of local Indonesian chicken resulting from the crossing of F1 males of Pelung chickens and Sentul chickens with F1 females of Kampong chickens and broiler chicken parent stock (strain – Cobb). The selection of the chickens is predicted based on the fact that Pelung chickens have a large body frame with the capacity to produce more meat. Sentul chickens have a high degree of egg production, whereas Kampong chickens are resistant to Salmonella sp. In order to enhance growth, crosses were made with broiler chickens, which have fast-growth traits. However, the presence of 25 % broiler blood permits a decrease in chicken disease resistance traits (Ulupi et al., 2016).
The development of the new line of IPB-D2 chickens is one of the efforts to produce local chickens with good disease resistance traits. IPB-D2 chickens are selected from IPB-D1 chickens based on several immunocompetence traits such as IgY concentration and Newcastle disease (ND) antibody titer. IPB-D2 chickens were selected based on IgY concentration ≥10 mg mL−1 and Newcastle disease (ND) antibody titer ≥3log 2 HI unit. IgY is the main antibody of chickens in the body's response mechanism against pathogens. IgY is found in the blood and is inherited as an antibody in chicks. Meanwhile, ND antibody titer is an illustration of the protective immune response against Newcastle disease (Rahman et al., 2017).
In Indonesia, local chickens are still raised using a traditional system with extensive systems, where chickens are allowed to roam freely outdoors and forage naturally. This rearing system increases the chance of chickens being exposed to pathogens that can lead to disease and mortality. A disease occurs when the immune system fails to defend the body against the effect of invading pathogens (Zekarias et al., 2002). The immune system is also affected by genetic factors in addition to environmental factors. Genes produce certain proteins that play a role in influencing the chicken's immune system.
The major histocompatibility complex (MHC) is a region of genes that controls immune responses, and it is found in all vertebrate species (Miller and Taylor, 2016). There are class-I (BF), class-II (BL), and class-IV (BG) genes in the chicken MHC (B complex) gene cluster, which is on microchromosome 16 (Lamont, 1991). The highly polymorphic classical class-I and class-II molecules of the major histocompatibility complex (MHC) play important roles in the adaptive immune system by presenting peptides to T cells. They also play important roles in the innate immune system as ligands for natural killer (NK) cells (Kaufman, 2022). The chicken MHC is strongly linked to resistance and susceptibility to pathogens, which is important to the economy.
Based on the sequence of the polymorphic region 1, the various B-LB gene isotypes can be classified into three families: the B-LB II family (consisting of B-LB I and BL-B II), the B-LB III family (consisting of B-LB III, IV, and V), and the B-LB VI family (Zoorob et al., 1990). Similarly to the mammalian MHC class-II beta chain gene, the B-LB II gene has been widely researched because of its widespread polymorphism and crucial function in the presentation of extracellular antigen peptides to helper T cells, which is the beginning of the immune response and the thymic selection of T lymphocytes (Xu et al., 2007).
The MHC class II is divided into two groups of chains: α and β. The class-II β chains are encoded by either B Locus Beta 1 (BLB1) or B Locus Beta 2 (BLB2). Diversity of the MHC class-II antigen-binding region is crucial for the suppression of adaptive immunological responses (Zekarias et al., 2002). It has been found that exon 2 of BLB1 and BLB2, which encodes for the antigen-binding region domain, is very variable (Li et al., 2010). Niikura et al. (2004) suppose that BLB1 and BLB2 play a role in disease resistance (e.g., against Marek's disease and salmonellosis) (Liu et al., 2002; Zhou and Lamont, 2003).
MHC is a polymorphic region that has numerous single-nucleotide polymorphisms (SNPs) and insertions and deletions (INDELs). Yuan et al. (2021) found 3319 SNPs and 181 INDELs in the BF and BL regions among 21 chicken populations, of which 2057 SNPs and 159 INDELs were novel. In three local Chinese breeds, most of the mutation positions were located in the B-LB β1 domain encoded by exon 2, especially in the peptide-binding region (Chen et al., 2012). Chen et al. (2012) also reported that the chicken BL gene showed more polymorphic sites and clearly dominant trans-breed alleles, potentially to adapt to pathogens. The study of Lestari et al. (2022) stated that SNPs in the MHC class-II DMA gene had an association with IgY concentration in IPB-D2 chickens.
The BLB2 gene is one of the polymorphic genes. The BLB2 gene is located between Tapasin and RING3 in the BL region. The BLB2 gene plays an important role in extracellular antigen presentation and in the initiation of the immune response (Guo et al., 2012). Niikura et al. (2004) stated that, based on the results of gene mapping, the BLB2 gene is a candidate gene that affects the immune system of chickens. The BLB2 gene is 1573 bp long and consists of seven exons and six introns. Several studies related to the diversity of the BLB2 gene have been carried out. There were nine genotypes of the BLB2 gene in Silkies (Qianyun et al., 2000) and 31 new alleles of the BLB2 gene in native Chinese chickens (Xu et al., 2007). In addition, the BLB2 gene is well expressed in all chicken tissues such as the cecal tonsils, cecum, spleen, duodenum, brain, and lungs (Parker and Kaufman, 2017).
Analysis of MHC allelic polymorphism in other breeds is uncommon, particularly in the Indonesian local chickens and especially in IPB-D2 chickens. The aim of this study was mainly to focus on the following: (1) characterizing the genetic polymorphism of the chicken MHC BLB2 gene in IPB-D2 chickens, (2) providing information about BLB2 gene polymorphism and its association with IgY concentration and ND antibody titer, and (3) analyzing BLB2 gene expression in different categories of ND antibody titers in IPB-D2 chickens.
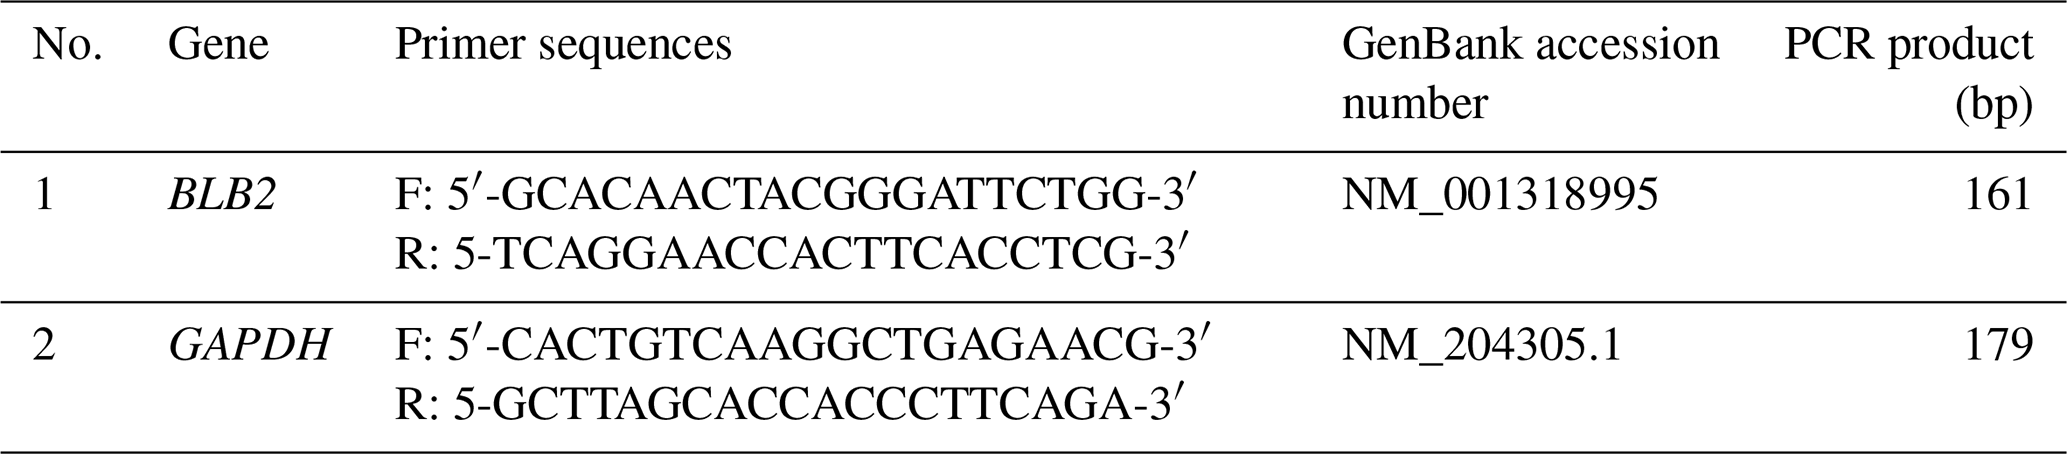
Table 1BLB2 and GAPDH gene primers for relative mRNA expression.
2.1 Animals and blood collection
IPB-D2 chickens were reared in an intensive system and fed twice a day, in the morning and in the evening. The feed given was 100 % commercial feed for chickens up to 4 weeks old and commercial feed and rice bran at a ratio of 70 : 30 for chickens at 4 to 12 weeks old. Chickens at 12 to 21 weeks old were given commercial feed and bran at a ratio 60 : 40. Drinking water was given ad libitum. Chickens were kept in a cage with facilities for feeding, drinking water, laying eggs, and husks.
The total sample used was 100 IPB-D2 chickens. The blood samples were collected at 21 weeks using 3 mL syringe in the venae brachiales (the brachial veins). The experimental procedure was approved by the Institutional Animal Care and Use Committee (IACUC) at IPB University (approval ID no. 224-2021 IPB).
2.2 ELISA test
IgY concentration was determined by means of an indirect ELISA (enzyme-linked immunoassay) method based on that of Vansofla et al. (2021) with some modifications. We used 96-well plates that were coated with IgG goat anti-IgY (SAB3700195 Sigma-Aldrich, 2.5 µg m L−1) diluted in bicarbonate buffer (Na2NO3) with a pH of 9.6 at 4 ∘C overnight. The, the plates were washed three times using phosphate-buffered saline (PBS) containing Tween 20 (PBST-20, pH 7.4) and blocked with 100 µL of 2 % bovine serum albumin (BSA) for 1 h at 37 ∘C. Serum samples were diluted at a ratio of 1 : 100 and were added to each well and incubated for 1 h at 37 ∘C.
The plates were washed three times with PBST, and 100 µL of secondary antibody IgG rabbit anti-IgY (A9046 Sigma-Aldrich) was added to each well conjugated with a peroxide enzymes. The plate was incubated for 1 h at 37 ∘C and then washed three times using PBST. Then 100 µL of tetramethylbenzidine (TMB) substrate solution (T0440 Sigma-Aldrich) was added to each well. Finally, the reaction was stopped with stop solution H2SO4, and the absorbance was read at 450 nm on a microplate reader (Bio-Rad, USA).
2.3 HI Test
The ND antibody titer was determined by means of an HI (hemagglutination inhibition) test based on the guidelines of the Office International des Epizooties (OIE, 2021) with some modifications. The determination of the antibody titer was based on the resistance in the dilution which is able to bind antigens at a concentration of 4HAU and to inhibit red blood cell agglutination. The first step was to add 25 µL of PBS into the microplate, followed by the addition of 25 µL of the serum sample into the first row of microplate wells and then serial dilution to the 11th well. The ND antigen was then added into every well except the 12th well. The microplate was then incubated at room temperature for 30 min. Then, 25 µL of 1 % RBC (red blood cell count) was added up to the 12th well. RBCs and antigen were present in the 11th as a positive control, whereas RBCs alone were present in the 12th well as a negative control. By gently shaking the microplate, the RBCs were allowed 40 min to settle at room temperature. A sharp button that appeared as a result of the settlement of intact RBCs was recorded as a positive test result after the test result was assessed by titling the plates. The maximum dilution of each sample was taken into consideration as the test's endpoint, and the serum antibody titer was calculated from that by measuring the observed result in reverse.
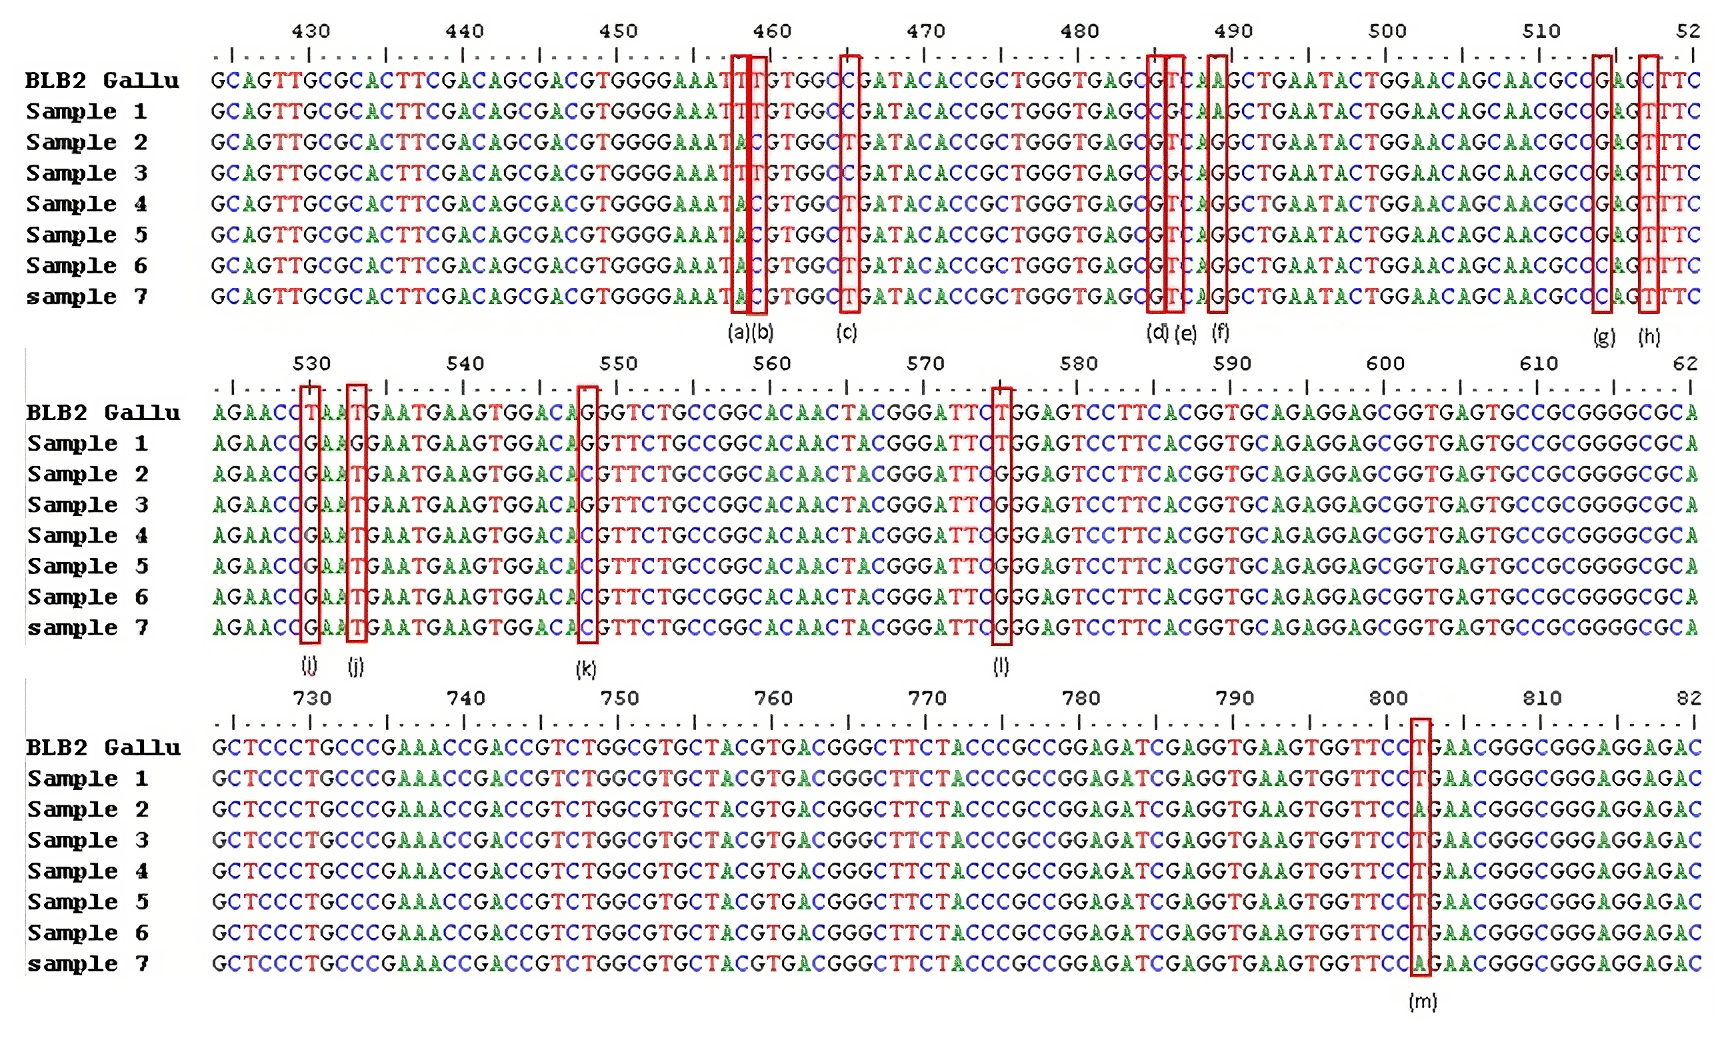
Figure 1SNPs of BLB2 gene in IPB-D2 chickens. (a) g.458 T > A, (b) g.459 T > C, (c) g.465 C > T, (d) g.485 G > C, (e) g.486 T > G, (f) g489 A > G, (g) g.514 G > C, (h) g.517 C > T, (i) g.530 T > G, (j) g.533 T > G, (k) g.548 G > C, (l) g.575 T > G, and (m) g.802 T > A. Exon 2: 332–601. Intron 2: 602–689. Exon 3: 690–971.
2.4 Sequencing analysis
DNA samples were extracted from the fresh blood using the genomic DNA extraction mini kit (Geneaid™, Taiwan) according to the manufacturer's instruction. The target of BLB2 gene amplification is an 871 bp DNA sequence covering a part of exon 2 to exon 4 (NC_006103). The primer sequences are as follows: F – 5′-GTGAGGTTTCTGGACAGG-3′ and R – 5′-CCTGAAACACAGCGAGAC-3′. The primers were designed using the PCR Primer Stats program.
The final volume of the BLB2 gene PCR was 25 µL with a concentration of 20 pmol µL−1 , consisting of 1 µL DNA sample, 9.75 µL distilled water (DW), forward and reverse primers of 0.25 µL, a MyTaq™ HS Red Mix of 12.5 µL, and 1.25 µL dimethyl sulfoxide (DMSO) (5 %). DNA was amplified using a PCR machine with the following procedure: pre-denaturation at 95 ∘C for 1 min, denaturation at 95 ∘C for 15 s, annealing at 56 ∘C for 15 s, extension at 72 ∘C for 10 s, and final extension 72 ∘C for 3 min. PCR products were visualized in 1 % agarose gel. The sequencing analysis was outsourced to Macrogen, Korea.
2.5 Relative mRNA Expression of BLB2 gene
The sample used for BLB2 gene expression was the cecal tonsil of IPB-D2 chickens. Samples were used based on differences between high ND antibody titers (3.25 ± 0.25 log2 HI unit) and low ND antibody titers (1.24 ± 1.15 log2 HI unit). RNA extraction was performed according to the protocol of the kit used (RNeasy Mini Kit, Qiagen). RNA purity was analyzed using NanoDrop™ 2000/2000c Spectrophotometers (Thermo Fisher Scientific). The RNA used was RNA with an A260 A280 ratio value of 1.8–2.2. Complementary DNA (cDNA) was synthesized using a First Strand cDNA Synthesis Kit (Thermo Fisher Scientific). The quantification of cDNA was performed using the qRT-PCR (quantitative real-time polymerase chain reaction) method. The qRT-PCR mix consist of 2 µL of cDNA sample, 3 µL of DW, 0.5 µL of forward primer, 0.5 µL of reverse primer, and 5 µL of SBYR® Green (Toyobo THUNDERBIRD® SBYR® qPCR Mix). The quantification was carried out with pre-denaturation at 95 ∘C for 1 min, denaturation at 95 ∘C for 15 s, and annealing at 57 ∘C for 1 min with 40 repetitions. The specific primers used were designed using PCR Primer Stats software (Table 1). The housekeeping gene used was glyceraldehyde 3-phosphate dehydrogenase (GAPDH). The relative expression of the BLB2 gene mRNA was calculated based on the delta Ct (ΔCt) according to Silver et al. (2006) with the following formula:
2.6 Statistical analysis
The results of DNA sequencing were analyzed using FinchTV, MEGA X, and BioEdit. Allele and genotype frequencies and the Hardy–Weinberg analysis of the BLB2 gene were analyzed using SNPstats (Pan et al., 2019). The observed heterozygosity (Ho) and expected heterozygosity (He) were analyzed using DNAsp. The association of the SNPs with IgY concentration and ND antibody titer were analyzed using SAS software (version 9.2). The genotype mean values were compared with a T test.
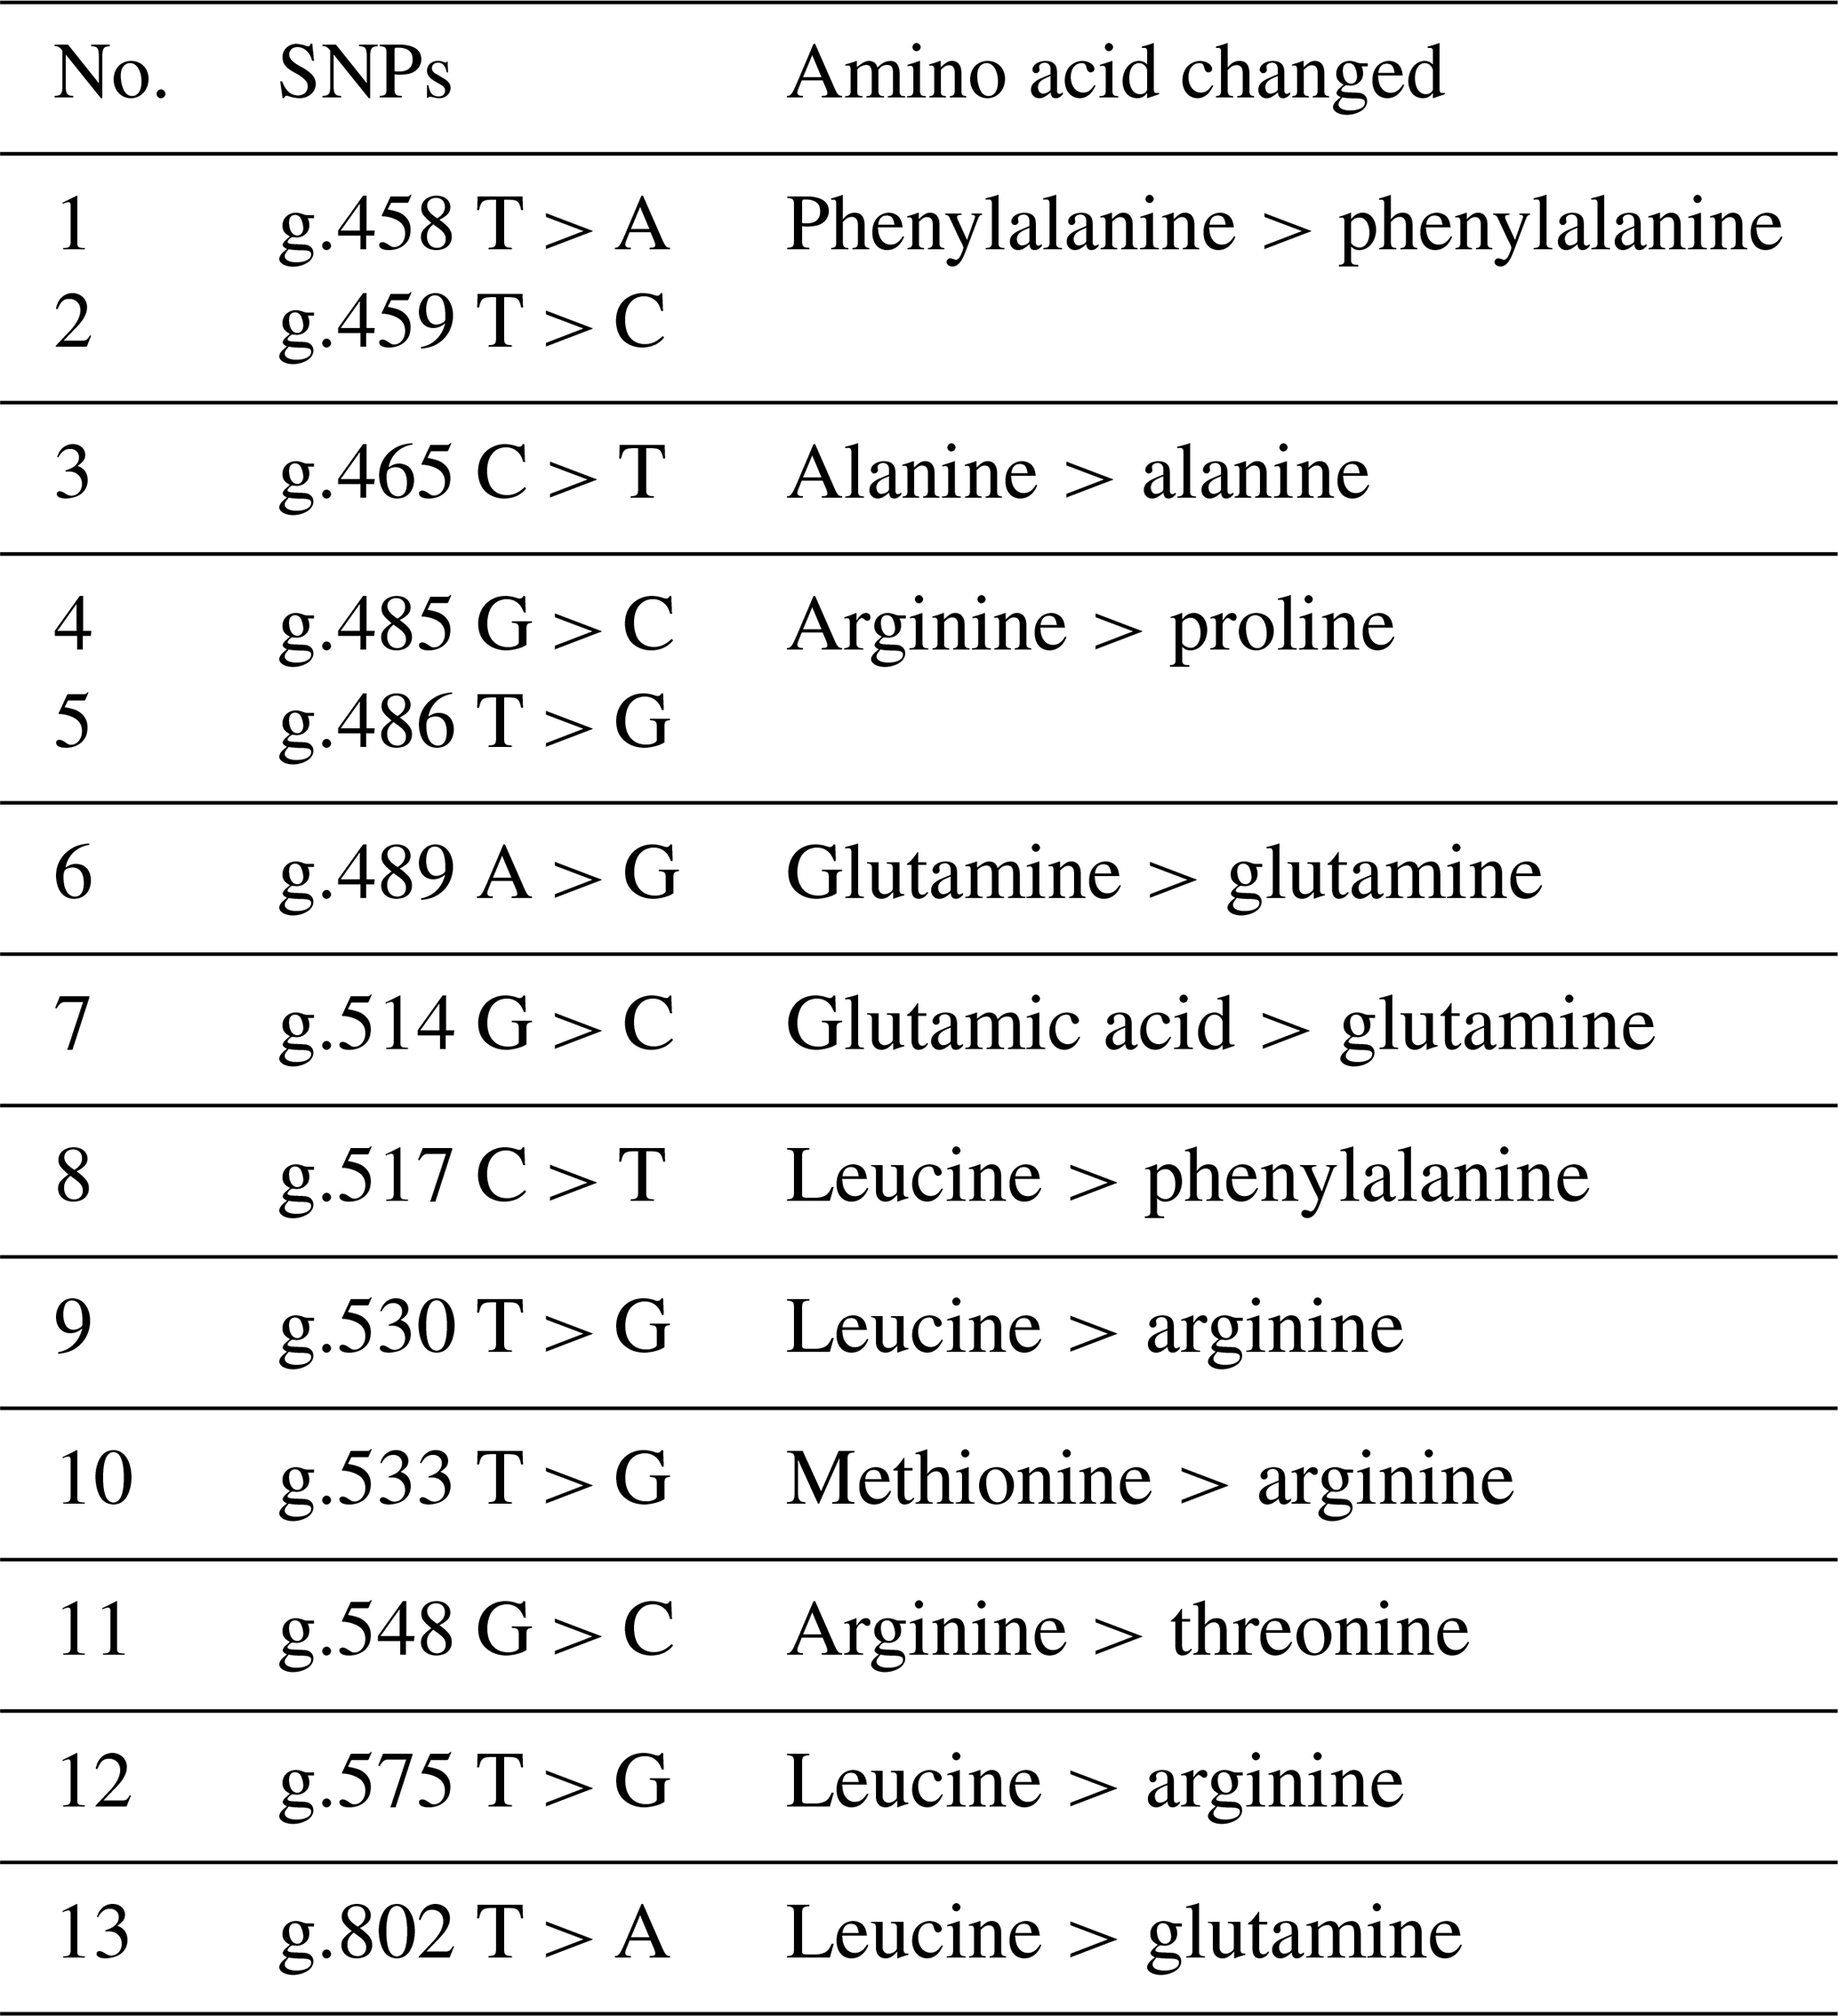
The analysis of the BLB2 gene polymorphism in IPB-D2 chickens was analyzed using the Sanger sequencing method. Figure 1 shows the BLB2 gene polymorphism in IPB-D2 chickens. There were 13 SNPs in the BLB2 gene, with 12 SNPs in exon 2 and 1 SNP in exon 3. The SNPs in the BLB2 gene are thought to change some of the amino acids formed (Table 2). There are four SNPs that are synonymous, namely, g.458 T > A, g.459 T > C, g.465 C > T, and g.489 A > G.
Table 3Allele frequency, genotype frequency, heterozygosity, and Hardy–Weinberg equilibrium of BLB2 gene polymorphism in IPB-D2 chickens.
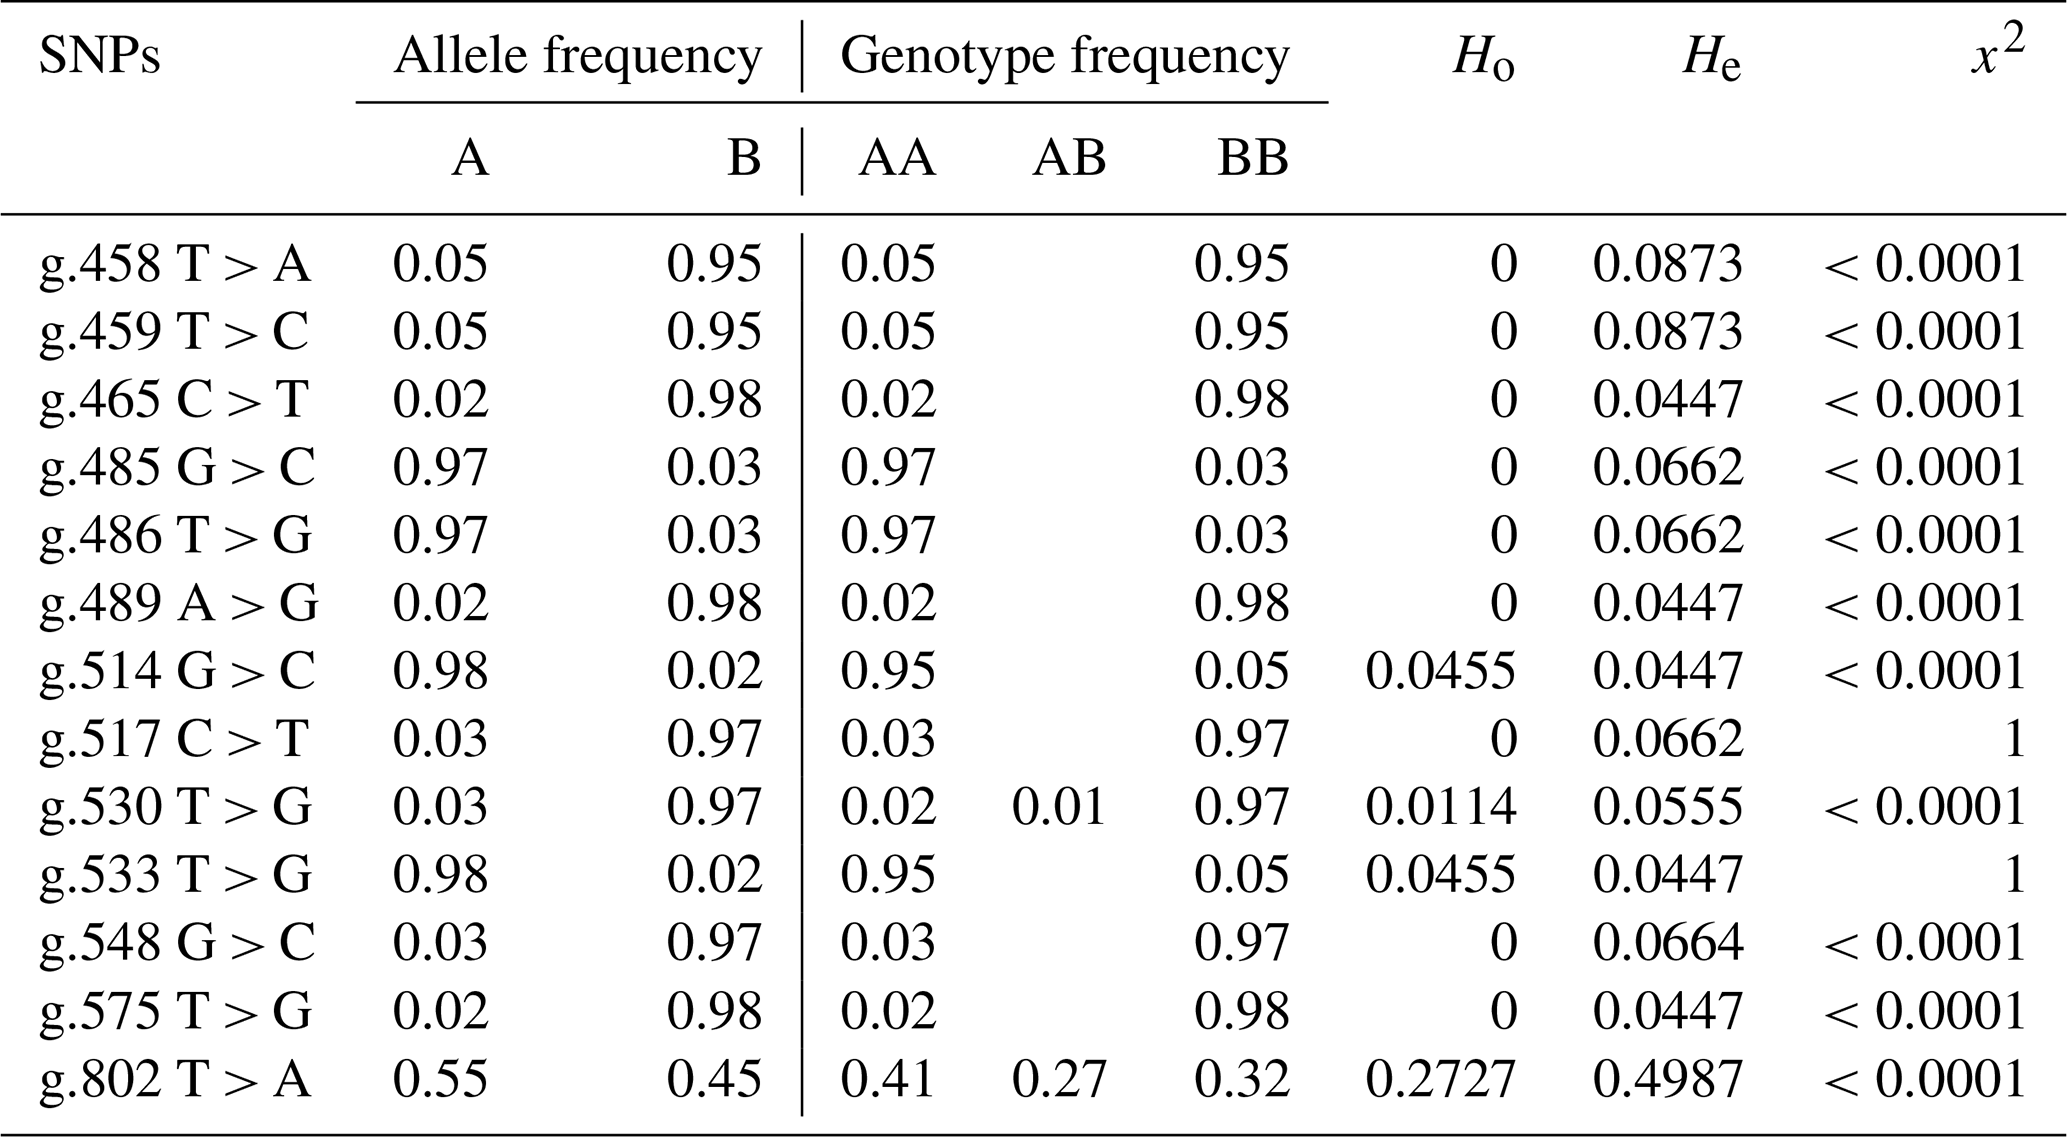
The allele and genotype annotations use the letters A and B, with A being the allele according to the reference and B being the allele mutation. AB is heterozygous mutation, and BB is homozygous mutation.
Table 4Association of BLB2 gene with IgY concentration and ND antibody titer in IPB-D2 chickens.
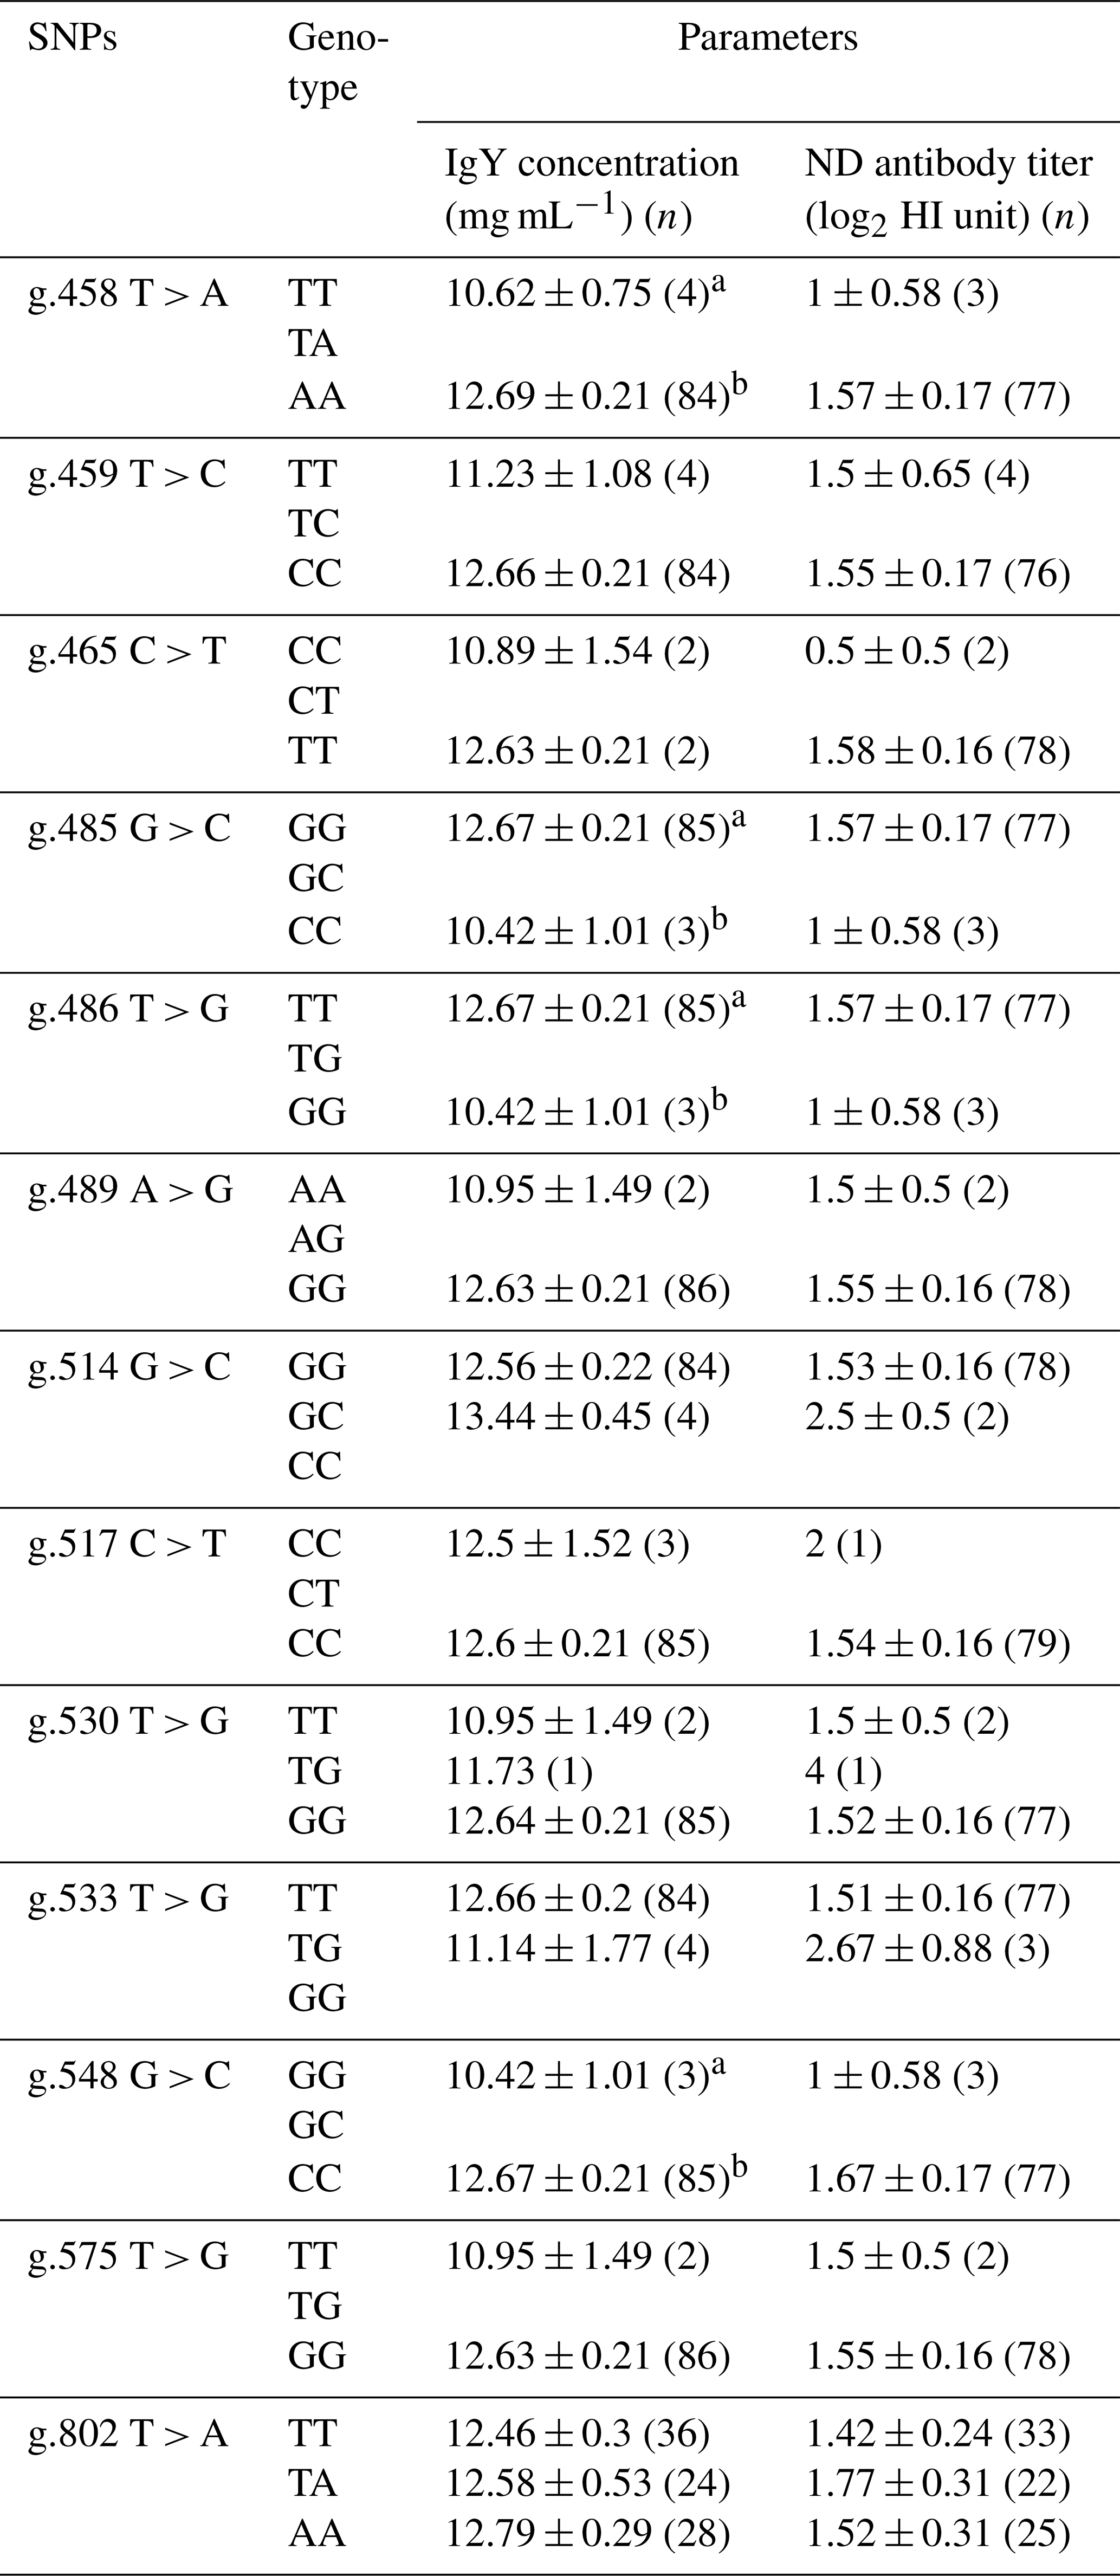
Means in the same column with different superscripts differ significantly between genotypes (p<0.05); n is number of samples.
Table 3 shows the values of allele frequency, genotype frequency, heterozygosity, and Hardy–Weinberg equilibrium in the BLB2 gene. All SNPs in the BLB2 gene have three alleles that form 3 genotypes at 2 SNPs and 2 genotypes at 11 SNPs. Based on observed heterozygosity (Ho) and expected heterozygosity (He) values, SNPs in the BLB2 gene have a smaller Ho value than the He value. The Hardy–Weinberg equilibrium is seen from the x2 value. The x2 values indicates that IPB-D2 chickens are not expected in the Hardy–Weinberg equilibrium.
Table 4 shows the association of the BLB2 gene SNPs with IgY concentration and ND antibody titer. Based on statistical analysis, four SNPs were significantly associated (P<0.05) with IgY concentration in IPB-D2 chickens. However, SNPs in the BLB2 gene were not significantly associated (P>0.05) with the ND antibody titer.
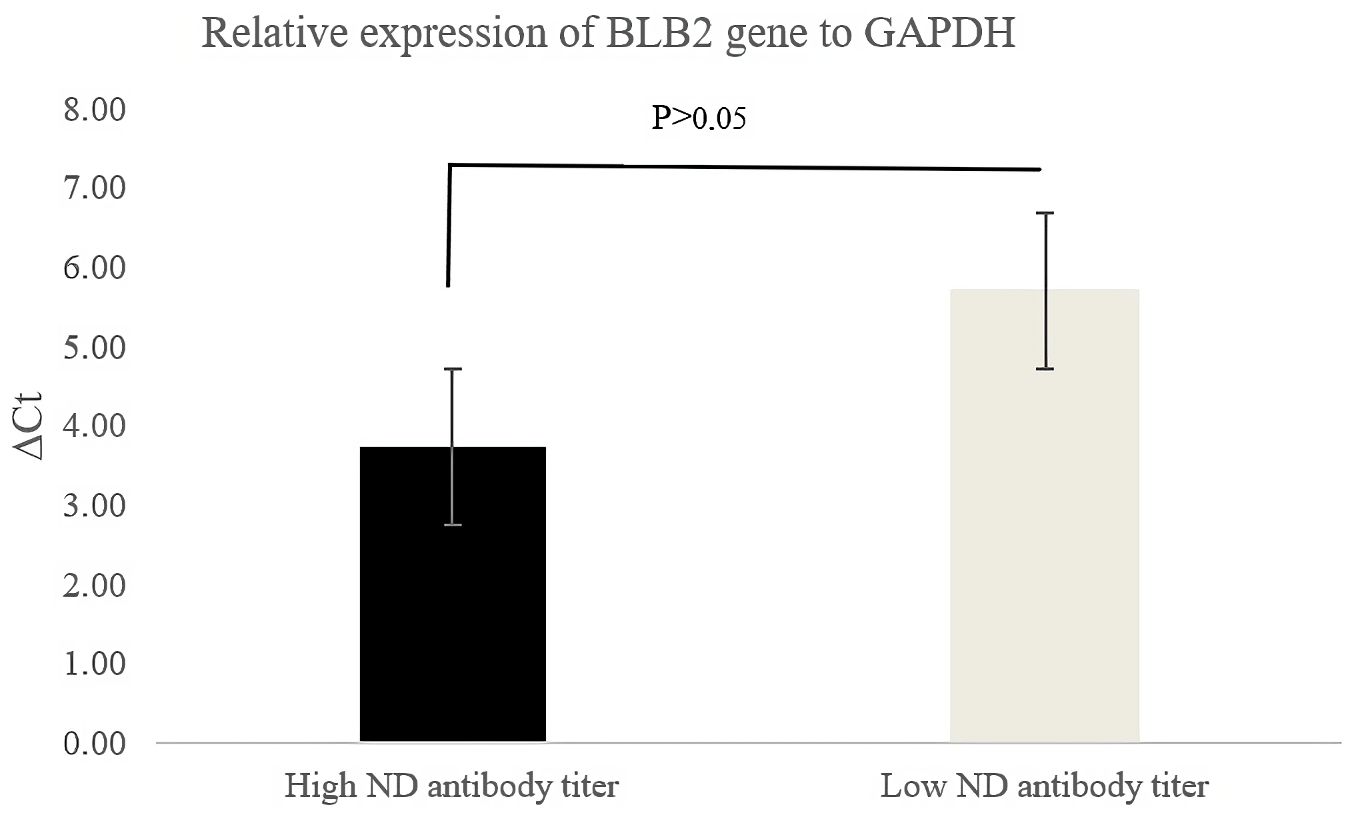
Figure 2 shows the relative expression of the BLB2 gene as indicated by the ΔCt values. The ΔCt value in IPB-D2 chickens with high ND antibody titers was lower than in IPB-D2 chickens with low ND antibody titers. A low ΔCt value indicates higher expression.
SNPs can occur in coding or non-coding regions; those that alter the amino acid sequence are known as non-synonymous SNPs, while those that do not alter the amino acid sequence are known as synonymous SNPs (Ritu and Mohapatra, 2018). BLB2 SNPs were analyzed using the Sanger sequencing technique. The success of the BLB2 gene sequencing was 92.6 %. A total of 13 SNPs were found in two locations: 12 SNPs in exon 2 and 1 SNP in exon 3 (Fig. 1). As many as 9 out of 13 SNPs may have caused amino acid changes in the BLB2 gene in IPB-D2 chickens (Table 2). Research by Xu et al. (2007) found 68 SNPs in exon 2 of the BLB2 gene in native Chinese chickens, while Guo et al. (2012) found 69 SNPs in exon 2 of the BLB2 gene in Hebei chickens.
Base changes that occur resulted in changes in amino acids, except for the SNPs g.458 T > A, g.459 T > C, g.465 C > T, and g.489 A > G. Changes in non-synonymous bases in the coding region can cause amino acid changes. Amino acid changes can drastically change the phenotype of an individual (Ng and Henikoff, 2006). The amino acid proline contributes to immune-cell-mediated wound healing and injury recovery, partly to protect lymphocytes from apoptosis, promoting cell proliferation and increasing antibody production (Abumrad and Barbul, 2004). The immune system uses glutamine to regulate T cell proliferation, protein synthesis, the creation of cytons and antibodies, the activation of macrophages, and the inhibition of apoptosis. The amino acid arginine serves as a modulator of autoimmune disease, a signaling molecule to eliminate infections, and a regulator of cytokine production (Li et al., 2007).
Genetic diversity is defined as the genomic differences between individuals within or between populations that make each or group of organisms different from others (Ritu and Mohapatra, 2018). The genetic diversity of a population can be seen from the allele frequency, genotype frequency, and heterozygosity level. According to Allendorf et al. (2012), a population is said to be polymorphic if there are two or more alleles with an allele frequency of more than 1 %. The SNPs in the BLB2 gene have two genotypes, except for the SNPs g.802 T > A, which has three genotypes (namely, TT, TA, and AA), and g.530 T > G, which has three genotypes (TT, TG, and GG). The highest allele frequency of the SNP g.458 T > A is allele A. For the SNP g.459 T > C, it is allele C. For the SNPs g.465 C > T, g.486 T > G, g.533 T > G, and g. 802 T > A, it is the T allele, while in other SNPs, the highest allele is the G allele. Thakur et al. (2017) found eight different genotypes in the exon 2 MHC B-LB2 family gene in Kadaknath chickens based on polymerase chain reaction sequence-specific amplification (PCR-SSP).
In addition to allele frequency and genotype frequency, genetic diversity can also be measured based on the value of heterozygosity. Tambasco et al. (2003) propose that the difference between the observed heterozygosity value (Ho) and the expected heterozygosity value (He) can be utilized as a sign that the observed population lacks genotype balance. The SNP in the BLB2 gene has a lower Ho value compared to the He value, which is in accordance with the findings of Zhao et al. (2019); this indicates that inbreeding has occurred in a population. According to the value of x2, which shows that the SNP is not within the Hardy–Weinberg equilibrium, this is consistent.
There are four SNPs that have significant associations with IgY concentration, i.e g.458 T > A, g.485 G > C, g.486 T > G, and g.548 G > C. The AA genotype in SNP g.458 T > A is significantly different (p<0.05) from the TT genotype and has the highest mean IgY concentration among the SNPs and other genotypes. Meanwhile, SNPs of the BLB2 gene did not show a significant association with ND antibody titer in IPB-D2 chickens. Based on the association of SNPs in the BLB2 gene, there are four SNPs that have associations with total IgY concentrations, namely, g.458 T > A, g.485 G > C, g.486 T > G, and g.548 G > C. Each SNP had two different genotypes: SNP g.458 T > A had the genotype TT, which was significantly different (P<0.05) to the genotype AA; SNP g.485 G > C had the GG genotype GG, which was significantly different (P<0.05) to the genotype CC; SNP g.486 T > G had the genotype TT, which was significantly different (P<0.05) to the genotype GG; and SNP g.548 G > C had the genotype GG, which was significantly different (P<0.05) to CC genotype, SNP g.458 T > A genotype AA had the highest average IgY concentration of 12.69 ± 0.21 mg mL−1. Based on statistical tests, the SNP of the BLB2 gene was not significantly different from the ND antibody titer.
SNPs that are significantly associated with IgY concentration can be utilized as potential SNPs that mark high IgY concentration. These potential SNPs can be utilized for the selection process of IPB-D2 chickens or other chickens. After it was found out that antibodies are genetically inherited, genetic selection of antibody traits has been considered to be very beneficial. Chickens that have been genetically selected for better antibody traits can produce IgY better than the chickens that are not genetically selected. Chickens will produce IgY to provide their offspring with an effective humoral response to the most widely spread pathogens before their own immune system matures (Da Silva and Tambourgi, 2010).
The qRT-PCR analysis of the BLB2 gene was conducted using the cecal tonsil tissue of IPB-D2 chickens with different high and low ND antibody titers. Cecal tonsils are one of the largest lymphoid organs in the gut-associated lymphoid tissue (GALT) group. The cecal tonsil is the liaison between the cecum and rectum. The GALT group consists of lymphoid nodules that form lymphoid organs (Hewajuli and Dharmayanti, 2015).
The BLB2 gene expression was calculated using the formula ΔCt. According to Goni et al. (2009), high ΔCt indicates low expression, while highly expressed genes have low ΔCt. Based on qRT-PCR analysis, the BLB2 gene in IPB-D2 chickens with high ND antibody titers had a lower ΔCt compared to in IPB-D2 chickens with low ND antibody titers, though it was not significantly different (P>0.05) (Fig. 2).
High ND antibody titer indicates the possibility of ND virus infection in the body. The results of the BLB2 gene expression in the cecal tonsil of IPB-D2 chickens are in line with the results of Sarson et al. (2006), who stated that the Ct of the gene in MHC class II was of a lower amount in infected chickens compared to in uninfected chickens. However, this in contrast to the findings of Lian et al. (2010), who stated that the mRNA expression level of the BLB2 gene in the spleens of chickens infected with Marek's virus was lower than that in the spleens of chickens not infected with Marek's virus. Wosen et al. (2018) stated that MHC class-II molecules are widely expressed in lung and intestinal tissues.
A total of 13 SNPs of the BLB2 gene were found in exon 2 and exon 3 of IPB-D2 chickens. All SNPs are polymorphic. Four of these SNPs were found to be associated with IgY concentrations, with the AA genotype of g.458 T > A having the highest IgY concentration. The BLB2 gene has a high expression in IPB-D2 chickens with high ND antibody titers. SNPs that are significantly associated with IgY concentration can be utilized as potential SNPs that mark high IgY concentration. These potential SNPs can be utilized for the selection process of IPB-D2 chickens or other chickens.
The data sets utilized in this article are available on request from the author.
DL was responsible for the experimentation, data analysis, and initial drafting of the paper. SM, NU, AG, and CS were responsible for the design, resources, and validation of the study.
The contact author has declared that none of the authors has any competing interests.
This experiment did not harm the animals' welfare. IPB University's Animal Care and Use Committee (ACUC) has given its approval to all procedures in this study (approval ID no. 224-2021 IPB).
Publisher’s note: Copernicus Publications remains neutral with regard to jurisdictional claims in published maps and institutional affiliations.
This research was supported by the Directorate of Research and Community Services Deputy for Strengthening Research and Development, the Ministry of Research and Technology, and the National Research and Innovation Agency of The Republic of Indonesia within the PMDSU program (contract no. 36/IT3L1.PT.01.03/P/B/2022).
This research has been supported by the Kementerian Riset, Teknologi dan Pendidikan Tinggi (grant no. PMDSU program; contract no. 36/IT3L1.PT.01.03/P/B/2022).
This paper was edited by Henry Reyer and reviewed by Lamiaa Radwan and two anonymous referees.
Abumrad, N. N., and Barbul, A.: The Use of Arginine In Clinical Practice In Metabolic & Therapeutic Aspects of Amino Acids Clinical Nutrition, CRC Press, Boca Raton, Florida, 595–611, 2004.
Allendorf, F. W., Luikart, G., and Aitken, S. N.: Conservation and The Genetics of Populations, Willey-Blackwell, New York, 225 United State, ISBN 978-0-470-67145-0 2012.
Chen, F., Pan, L., Chao, W., Dai, Y., and Yu, W.: Character of chicken polymorphic major histocompability complex class II alleles of 3 Chinese local breeds, Poult. Sci., 91, 1097–1104, 2012.
Da Silva, D. W. and Tambourgi, D. V.: IgY: a promosing antibody for use in immunodiagnostic and in immunotherapy, Vet. Immunol. Immunopathol., 135, 173–180, 2010.
Guo, X. L., Zheng, H., Li, X. L., Gu, Z. L., Zheng, C. S., Wei, Z. H., Wang, J. S., Zhou, R. Y., and Li, L. H.: Genetic variation of major histocompability complex BLB2 gene exon 2 in Hebei domestic chicken, Res. Vet., 92, 76–79, 2012.
Hewajuli, D. A. and Dharmayanti, N. L. P. I.: Peran sistem kekebalan non-spesifik dan spesifik pada unggas terhadap Newcastle disease, Wartazoa, 25, 135–146, 2015.
Kaufman, J.: Innate immune genes of the chicken MHC and related regions, Immunogen., 74, 167–177, 2022.
Lamont, S. J.: Immunogenetics and the major histocompability complex, Vet. Immunol. Immunopat., 30, 121–127, 1991.
Lestari, D., Murtini, S., Ulupi, N., and Sumantri, C.: Polymorphism and association of DMA gene with total IgY concentration and ND antibody titer in IPB-D2 chicken line, Trop. Anim. Sci. J., 45, 1–8, 2022.
Lian, L., Qu, L. J., Zheng, J. X., Liu, C. J., Zhang, J. P., Chen, Y. M., Xu, G. Y., and Yang, N.: Expression profiles of genes within a subregion of chicken major histocompability complex B in spleen after Marek's disease virus infection, Poult. Sci., 89, 2123–2129, 2010.
Li, P., Yin, Y. L., Li, D., Kim, S. W., and Wu, G.: Amino acids and immune function, Brit. J. Nutrit., 98, 237–252, 2007.
Li, X. X., Han, L. X., and Han J. L.: No specific primer can independently amplify complete exon 2 of chicken BLB1 or BLB2 genes, Int. J. Poult. Sci., 9, 192–197, 2010.
Liu, W., Miller, M. M., and Lamont, S. J.: Association of HC class I and class II gene polymorphisms with vaccine or challenge response to Salmonella enteritidis in young chicks, Immunogen., 54. 582–590, 2002.
Miller, M. M. and Taylor, R. L.: Brief review of the chicken major histocompatilibity complex: the genes, their distibution on chromosome 16 and their contributions to disease resistance, Poult. Sci., 95, 375–392, 2016.
Ng, C. P. and Henikof, S.: Predicting the effect of amino acid substitution on protein function, Annu. Rev. Genomics Hum. Genet., 7, 61–80, 2006.
Niikura, M., Liu, H. C., Dodgson, J. B., and Cheng, H. H.: A comprehensive screen for chicken proteins that interact with proteins unique to virulent strains of Marek's disease virus, Poult. Sci., 83, 1117–1123, 2004.
OIE: Newcastle Disease (Infectio, in Manual of Standars for Diagnostic Tests and Vaccines, Paris, ISBN 978-92-95115-40-8, 2021.
Pan, W., Liu, C., Zhang, J., Gao, X., Yu, S., Tan, H., Yu, J., Qian, D., Li, J., Bian, S., Yang, J., Zhang, C., Huang, L., and Jin, J.: Association between single nucleotide polymor phism in PPARA and EPASI gene and high-altitute appetite loss in Chinese young men, Front. Physiol., 10, 1–8, 2019.
Parker, A. and Kaufman, J.: What chickens might tell us about MHC class II system, Curr. Op. Immunol., 46, 23–29, 2017.
Qianyun, X., Li, Y., Yuxin, T., Zouhong, Z., Zhengxing, L., Jianhua, O., Han, S., and Ning, L.: Analysis of sequence polymorphisms of B-LIIB (beta_(1) exon) in silkie, J. Agr. Biotech., 8, 138–141, 2000.
Rahman, M., Sarker, Deb, R., and Nooruzzaman, M.: Evaluation of serum antibody titer level against Newcastle disease virus in vaccinated broiler chickens, AVAS, 4, 94–98, 2017.
Ritu and Mohapatra, B.: Genetic variation, in: Encyclopedia of Animal Cognition and Behaviour, Springer International Pub, https://doi.org/10.1007/978-3-319-47829-6_20-1, 2018.
Sarson, A. J., Abdul-Careem, M. F., Zhou, H., and Sharif, S.: Transcriptional analysis of host responses to Marek's disease viral infection, Viral Immunol., 19, 747–758, 2006.
Silver, N., Best, S., Jiang, J., and Thein, S. L.: Selection of housekeeping gens for gene expression studies in human reticulocytes using real-tme PCR, BMC Mol. Biol., 7, 33, doi:10.1186/1471-2199-7-33, 2006.
Tambasco, D. D., Paz, C. C., Tambasco-Studart, M., Pareira, A. P., Alencar, M. M., Freotas, A. R., Countinho, L. L., Parker, I. U., and Regitano, L. C. A.: Candidate genes for growth traits in beef cattle Bos Taurus x Bos Indicus, J. Anim. Bred. Genet., 120, 51–60, 2003.
Thakur, M. S., Parmar, S. S., and Kumar, A.: Genetic polymorphism at exon-2 MHC B-LβII family gene by PCR-SSp in Kadaknath chicken, Ind. J. Biotech., 16, 329–332, 2017.
Ulupi, N., Sumantri, C., and Darwati, S.: Resistance against Salmonella pullorum IPB-D1 crossbreed, kampong and commercial broiler chicken, in: Proceedings of the 1st Conference Technology on Bioscience and Social Science, Padang, Indonesia 281 Universitas Andalas, ISBN 978-602-6381-22-4, 2016.
Vansofla, A. M., Nazarian, S., Sadeghi, D., Minae, M. E., and Hajizade, A.: Development of an IgG/IgY sandwich ELISA for the detection of cholera toxin subunit B, J. Appl. Biotechnol. Rep., 8, 421–427, 2021.
Wosen, J. E., Mukhopadhyay, D., Maubas, C., amd Mellins, E. D.: Epithelial MHC class II expression and its role in antigen presentation in the gastrointestinal and respiratory tracts, Front. Immunol., 9, 1–14, 2018.
Xu, R., Kui, L., Chen, G., Xu, H., Qiang, B., Li, C., and Liu, B.: Characterization of genetic polymorphism of novel MHC B-LB II alleles in chinese indigenous chickens, J. Genet. Genom., 34, 109–118, 2007.
Yuan, Y., Zhang, H., Yi, G., You, Z., Zhao, C., Yuan, H., Wang, K., Yang, N., and Lian, L.: Genetic diversity of MHC B-F/B-L region in 21 chicken populatins, Front. Genet., 12, 1–10, 2021.
Zekarias, B., Ter Huurne, A. A. H. M., Landman, W. J. M., Rebel, J. M. J., Pool, J. M. A., and Gruys, E.: Immunological basis of differences in disease resistance in the chicken, Vet. Res., 33, 109–125, 2002.
Zhao, Q., Sun, H., Zhang, Z., Xu, Z., Olasege, Z. B., Ma, P., Zhang, X., Wang, Q., and Pan, Y.: Exploring the structure of haplotype blocks and genetics diversity in chinese indigenous pig population for conservation purpose, Evol. Bioinfo., 15, 1–8, 2019.
Zhou, H. J. and Lamont, S. J.: Chicken MHC class I and II gene effects on antibody response kinetics in adult chickens, Immunogen., 55, 133–140, 2003.
Zoorob, R., Begar, G., Kroemer, G., and Auffray, C.: Organization of a functional chicken class II B gene, Immunogen., 31, 179–187, 1990.