
the Creative Commons Attribution 4.0 License.
the Creative Commons Attribution 4.0 License.
 | 06 Jan 2021
Genetic diversity and phylogenetic relationship of nine sheep populations based on microsatellite markers
Qing Xia
Xiangyu Wang
Zhangyuan Pan
Rensen Zhang
Caihong Wei
Mingxing Chu
Ran Di
The objective of this study was to assess the genetic diversity and phylogenetic relationship of nine sheep populations, including two famous high prolific populations and seven popular mutton populations raised in China. Overall, these sheep populations in this study exhibited a rich genetic diversity. Both the expected heterozygosity and Nei's unbiased gene diversity ranged from 0.64 to 0.75, with the lowest value found in Dorset sheep (DST) and the highest in Hu sheep (HUS) and Ba Han sheep (BAS). The polymorphic information content (PIC) varied between 0.59 in DST and 0.71 in HUS and BAS. Specifically, for individual breeds, the small-tail Han sheep (STH) and the four introduced populations did not display the expected diversity; therefore more attention should be paid to the maintenance of diversity during management of these populations. The results of un-weighted pair-group method (UPGMA) phylogenetic tree and structure analysis indicated that the nine investigated populations can be divided into two groups. Suffolk (SUF) and DST were clustered in one group, and the other group can be further divided into three clusters: German Mutton Merino (GMM)–BAS–Bamei Mutton sheep (BAM), HUS–STH and Du Han (DOS)–Dorper (DOP). This clustering result is consistent with sheep breeding history. TreeMix analysis also hinted at the possible gene flow from GMM to SUF. Together, an in-depth view of genetic diversity and genetic relationship will have important implications for breed-specific management.
- Article
(769 KB) - Full-text XML
- BibTeX
- EndNote


Sheep is one of the earliest domesticated animal species (Zeder et al., 2006; Bernardo et al., 2009). It provides meat and milk with high-quality protein and useful accessory products (wool and skin) for human. Therefore, sheep became an important livestock species and promoted the spread of human farming civilization (Jing and Zhang, 2009). China has a long history of sheep domestication (Kawamura et al., 2005) and famous sheep breeds with high reproductive performance. For example, small-tail Han sheep (STH) and Hu sheep (HUS) had attracted much attention for their excellent characteristics of high litter size and year-round estrus (China National Commission of Animal Genetic Resources, 2011). In addition to reproductive traits, meat production traits are also the focus of attention for sheep farmers. Since the growth rate and performance of meat production in Chinese sheep populations are relatively low compared with famous mutton sheep breeds worldwide (e.g., Dorper (DOP), Suffolk (SUF), Dorset (DST) and German Mutton Merino (GMM)), these perfect mutton breeds were introduced to China in the past two decades and are now common in many farms of China. However, with the introduction of foreign breeds to improve production performance of indigenous purebred sheep, the number of indigenous purebred sheep with high fertility is gradually decreasing (especially for STH) in China. Therefore, the evaluation of current genetic diversity situation in these sheep populations is very essential for breed protection. In addition, this study also involved seven mutton sheep populations raised in China including four introduced mutton populations mentioned above and three mutton populations in Inner Mongolia of China, which is the main producing area of mutton in China. The genetic diversity assessment for the seven mutton populations will be helpful for the formulation of plans of further management and utilization for these populations.
Microsatellite markers belong to a class of neutral markers, which have rich polymorphism in population and are widely distributed in the genome; therefore they are suitable for genetic diversity analysis. Previous studies indicated that microsatellite markers had been well used to assess genetic diversity and population structure of sheep breeds (Di et al., 2012; Dotsev et al., 2018; Madilindi et al., 2019; Vargas et al., 2018; Laoun et al., 2020; Ullah et al., 2020) and goat breeds (Carvalho et al., 2015; Câmara et al., 2017; E et al., 2019; Liu et al., 2019). Therefore, in this study, a panel of 26 microsatellite markers was employed to evaluate the genetic diversity, population structure and phylogenetic relationship of the nine sheep populations. The results will provide important information for the implementation of breed-specific management, propagation or conservation programs.
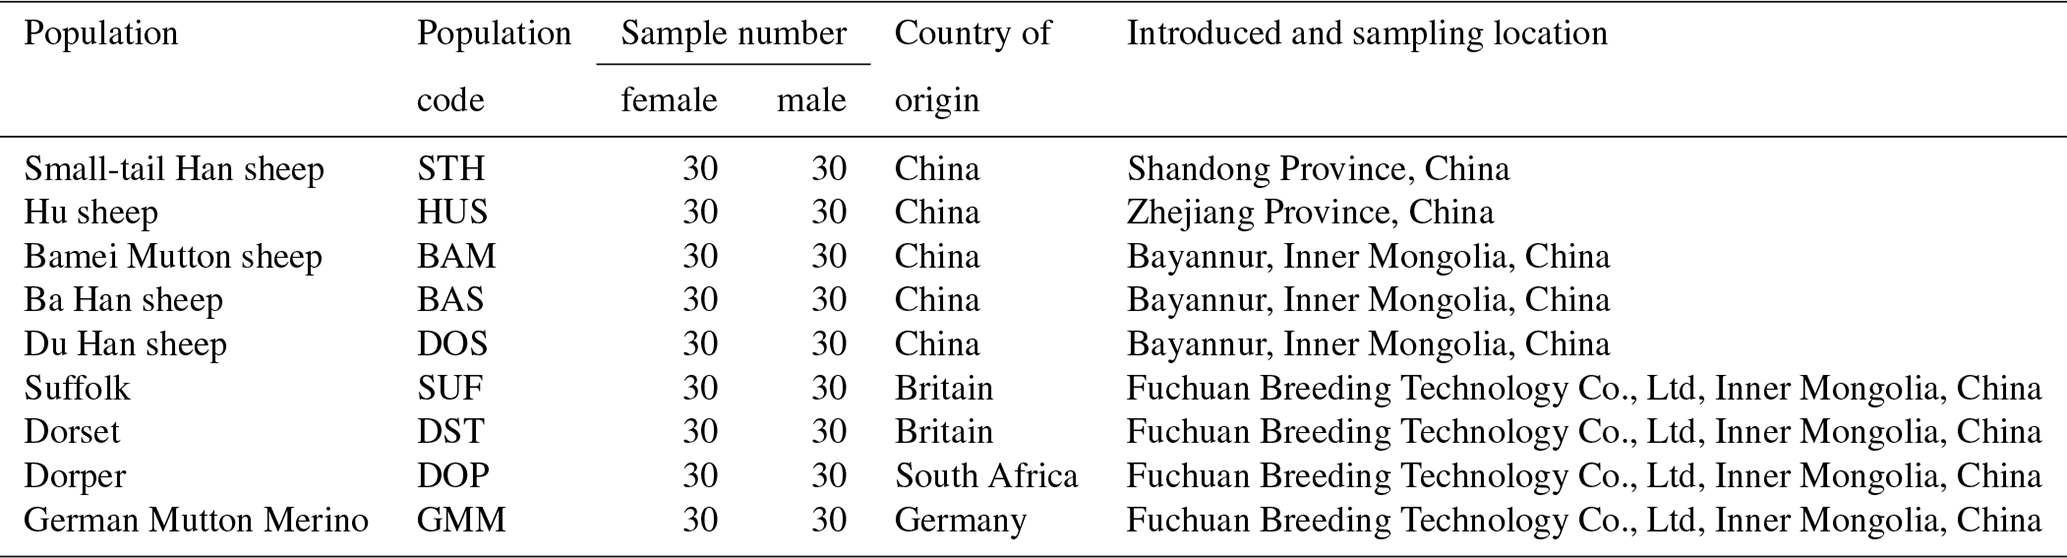
Table 1Summary information of nine sheep populations in this study.
2.1 Animal ethics
All experiments involving animals were authorized by the Animal Ethics Committee of the Institute of Animal Science, Chinese Academy of Agricultural Sciences (no. IAS2019-49).
2.2 Animals and DNA extraction
Nine sheep populations – small-tail Han (STH), Hu (HUS), Suffolk (SUF), Dorset (DST), Dorper (DOP), German Mutton Merino (GMM), Bamei Mutton (BAM), Ba Han (BAS) and Du Han (DOS) – were analyzed in this study (see Table 1 for specific sample information). A total of 5 mL jugular vein blood was collected from 60 individuals (30 ewes and 30 rams) in each population. Then genomic DNA was extracted according to protocol described by Russell (Russell and Sambrook, 2001). The DNA was dissolved in TE buffer (10 mmol/L Tris-HCL (pH 8.0), 1 mmol/L EDTA (pH 8.0)) and stored at −80∘C in a freezer.
Table 2Information of amplification and genetic parameter statistics for each microsatellite locus.
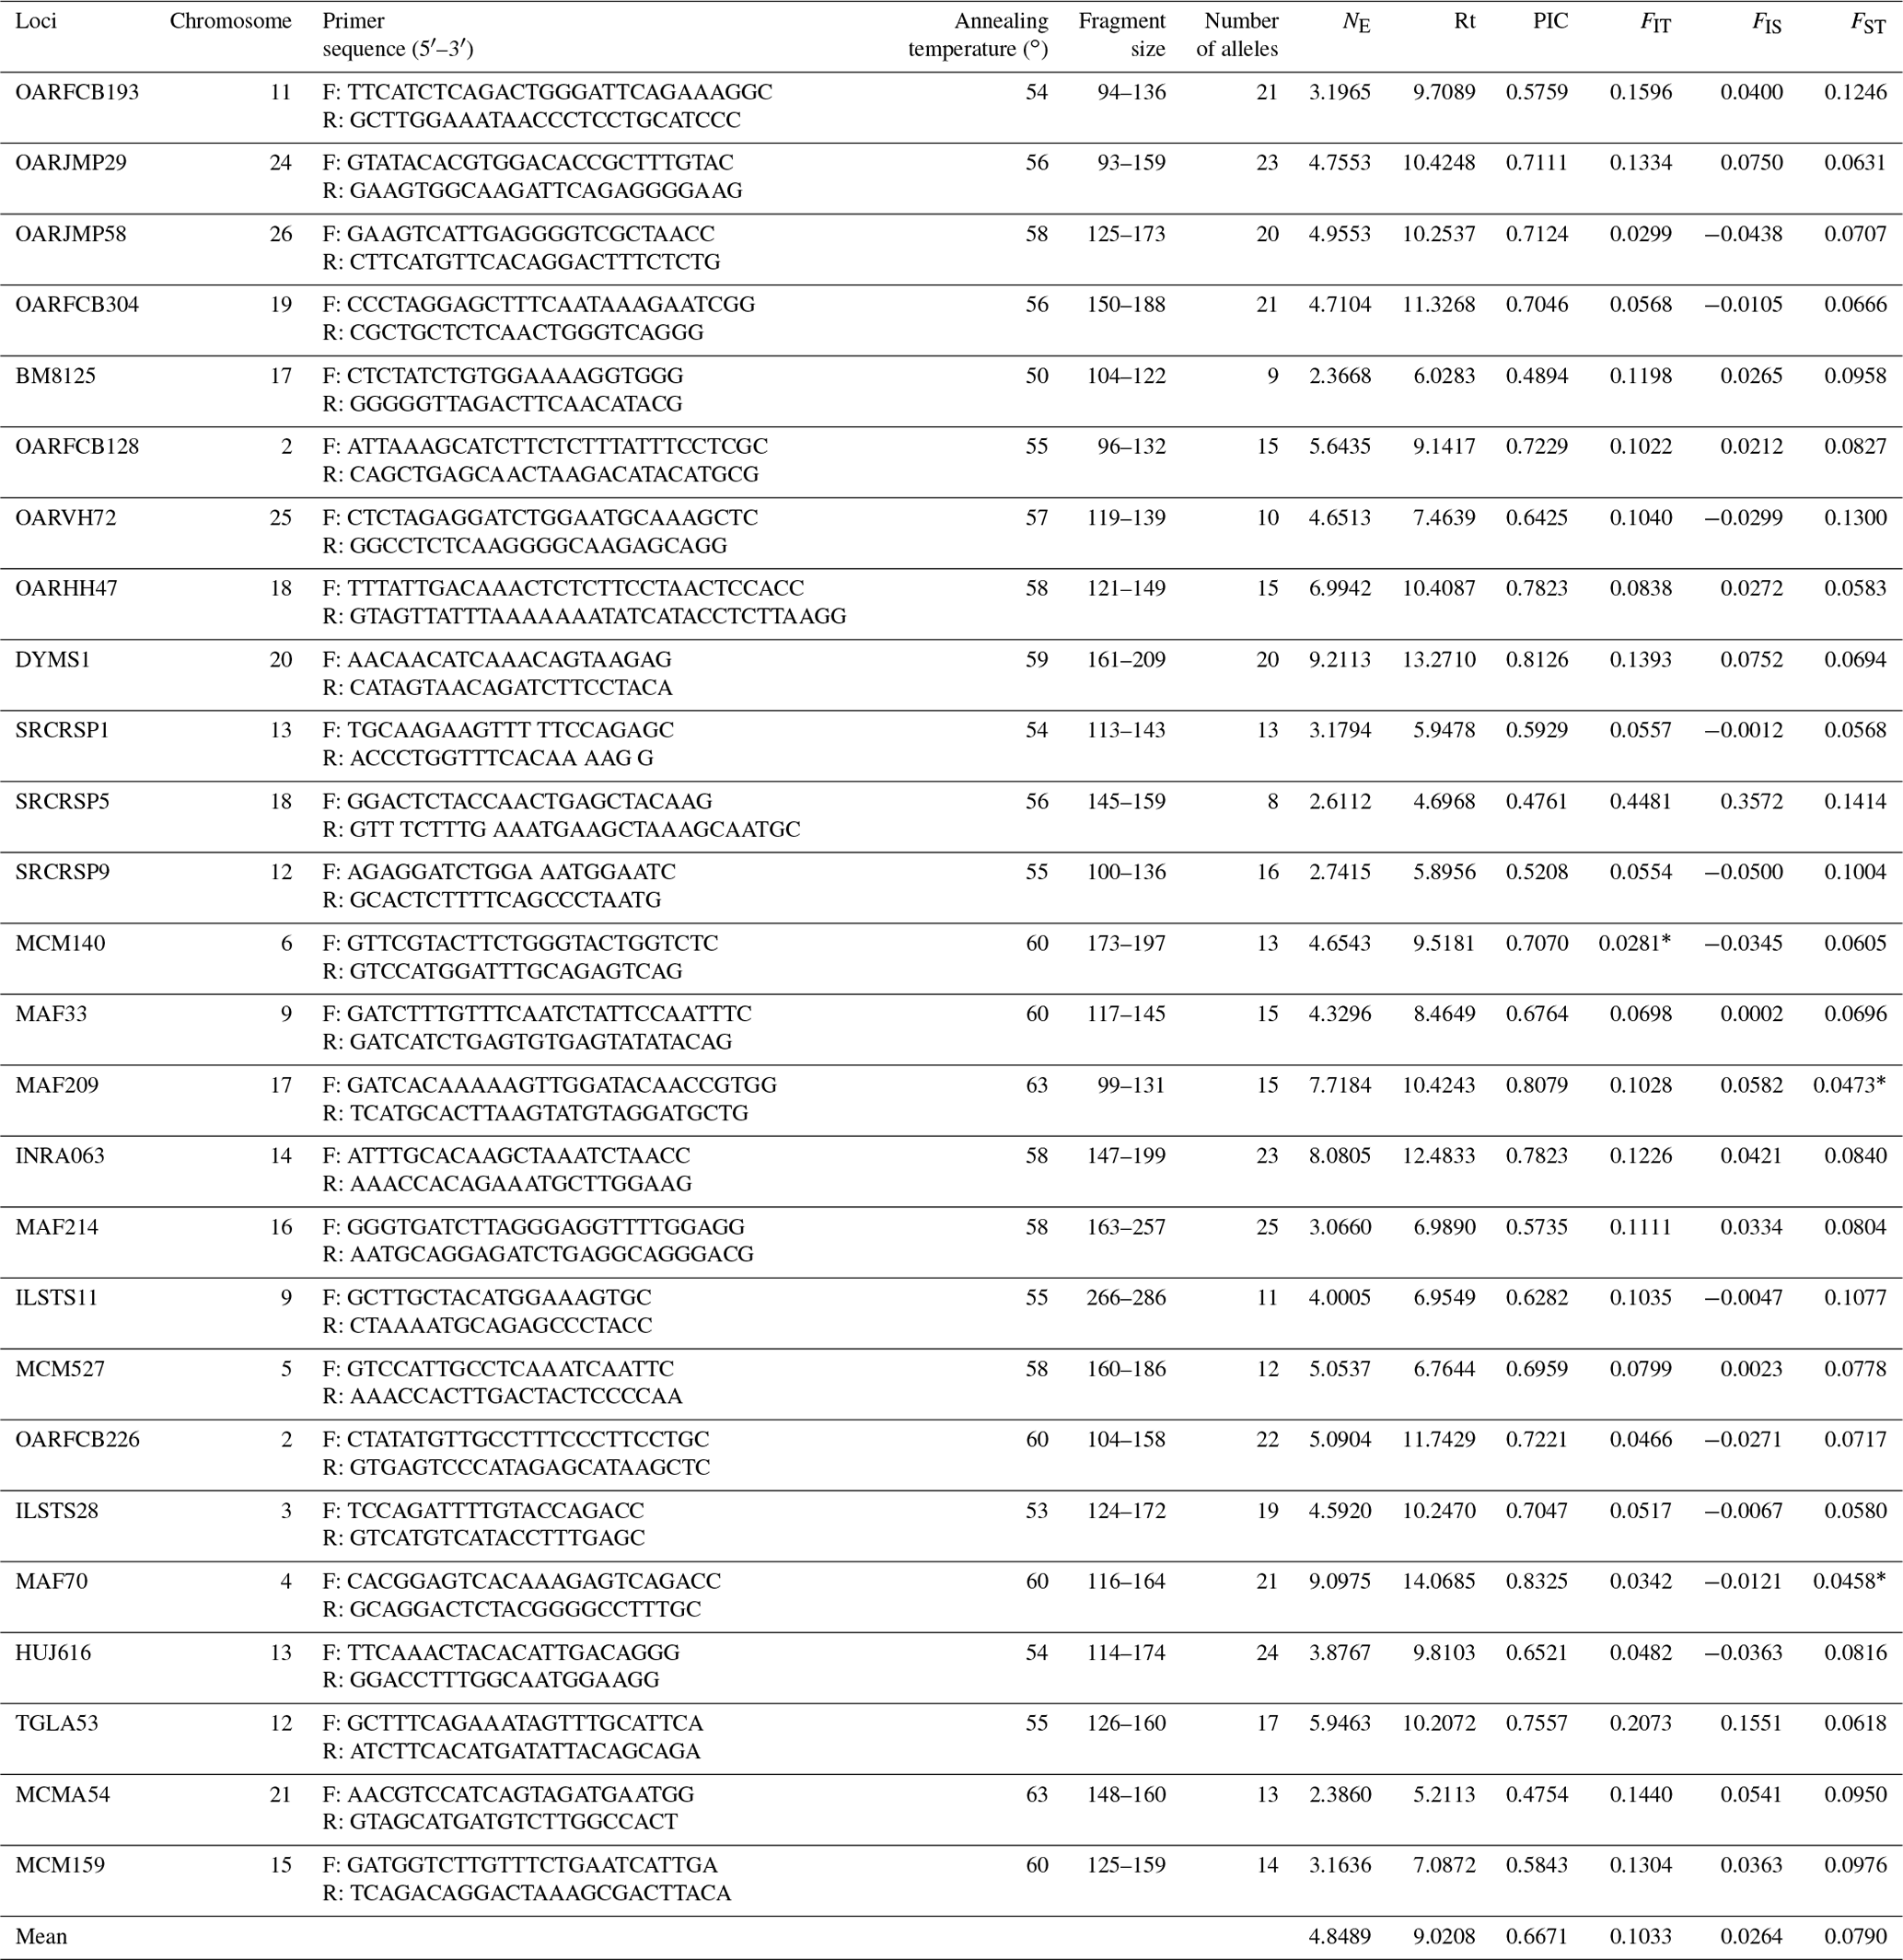
NE: the effective number of alleles; Rt: the allelic richness
over all samples per locus; FIT: inbreeding coefficient; FIS: fixation index within populations; FST: coefficient of relatedness
between individuals
from different populations; PIC: the polymorphic
information content; Rt: the allelic richness over all samples per locus. ∗ indicates a significant difference of locus in populations (P<0.05).
2.3 PCR amplification and genotyping
All sheep were genotyped using 26 microsatellite markers distributed in different chromosomes. Information of 26 microsatellite markers is summarized in Table 2. The primers for the first 24 microsatellite markers were recommended by the joint ISAG–FAO Standards Committee for analysis of sheep genetic diversity (Arranz et al., 1998, 2001; Martin-Burriel et al., 1999; Diez-Tascon et al., 2000; Stahlberger-Saitbekova et al., 2001; Pariset et al., 2003; Tapio et al., 2003). The primers for the other two loci are selected from the report of Davies et al. (1995) and Di et al. (2012). Forward primers were 5′-labeled with fluorescent dyes (FAM or HEX, Sangon Biotech (Shanghai) Co., Ltd.). The PCR protocol refers to the report of Zhong et al. (2011). PCR amplifications were performed in 12 µL reaction volumes containing 50 ng of genomic DNA, 2.5 mM MgCl2, 250 µM of each dNTP, 0.025 µM of each primer, 1.25 units of Taq polymerase and 1 × magnesium-free PCR buffer (Takara, Japan). Amplifications were carried out using the GENEAMP PCR 9700 thermocycler (Applied Biosystems), with the following cycling parameters: 94 ∘C for 5 min followed by 30 cycles of 94 ∘C for 30 s, annealing at 55–60 ∘C for 30 s, 72 ∘C for 30 s and a final step at 72 ∘C for 10 min. PCR products were diluted to 1/2–1/4 concentrations, and 0.75 µL of each diluted product was then mixed with an internal standard (Gene Scan 500 LIZ™, Applied Bio systems, USA) according to the manufacturer's instructions. Genotyping was performed using a Genetic Analyzer 3130 xl (Applied Bio systems, USA). Fragment analysis was performed using GENEMAPPER V3.7 software (Applied Biosystems). The third-order least squares method was used for allele size determination (Mburu et al., 2003). Genotyping was repeated once if individual samples failed to amplify.
2.4 Statistical analysis
The genetic diversity parameters of nine sheep populations, including mean number of effective alleles (NA), the expected heterozygosity (HE), the observed heterozygosity (HO), the polymorphic information content (PIC) and Nei's unbiased gene diversity (HS), were calculated using Microsatellite Toolkit software 3.1.1 (Park, 2008). The genetic parameters for each microsatellite locus, including the effective number of alleles (NE), the allelic richness over all samples per locus (Rt), the fixation index within populations (FIS), the fixation indices of total population (FIT) and the pairwise differences between the populations (FST), were obtained using FSTAT 2.9.3.2 (Goudet et al., 2002). Dispan was used to calculate the genetic distance of DA and DS between populations and build the phylogenetic tree (Nei et al., 1983). Population structure was analyzed by Structure 2.3.4 with Bayesian clustering model, and its results were visualized by Distruct 1.1 (Falush et al., 2003; Pritchard et al., 2000; Rosenberg, 2003). TreeMix 1.13 was used to construct a maximum likelihood tree and infer migration events between branches (Pickrell et al., 2012).
Table 3Genetic diversity information in the nine sheep populations.

NA: mean number of effective alleles; HE: expected heterozygosity; HO: observed heterozygosity; PIC: polymorphism information content; HS: Nei's unbiased gene diversity.
3.1 Genetic diversity in nine sheep populations
In this study, the genetic diversity analysis was firstly performed in nine sheep populations. The mean number of effective alleles (NA) is the largest in STH (10.50) and the least in SUF (8.12). The expected heterozygosity (HE) and observed heterozygosity (HO) within the population ranged from 0.64 to 0.75 and 0.63 to 0.74, respectively, with the lowest values found in the DST and the highest in the BAS. The highest PIC was observed in HUS and BAS (0.71), followed by GMM (0.70), and the lowest value was observed in DST (0.59). The Nei's unbiased gene diversity (HS) varied between 0.64 in DST and 0.75 in HUS and BAS (Table 3). Overall, these sheep populations in this study exhibited a rich genetic diversity. However, specifically for a single breed, the STH did not display the expected diversity. In addition, compared with other populations, the diversity of the four introduced populations raised in China was relatively low (especially in DST) in the nine sheep populations. Therefore, the above five populations (STH, DST, DOP, SUF, and GMM) exert more of our attention to the maintenance of diversity during population management.

Figure 1Pairwise differences among nine sheep populations (FST) using microsatellite markers.
Meanwhile, it was observed that all the microsatellite loci were polymorphic across nine populations. A total of 435 alleles were identified in nine sheep populations, and the number of alleles per locus ranged from 8 (SRCRSP5) to 25 (MAF214) (Table 2). The highest effective number of alleles (NE) was observed at locus DYMS1 (9.2113) and the lowest at BM8125 (2.3668). Allelic richness over all samples per locus (Rt) was measured between 4.6968 (SRCRSP5) and 14.0685 (MAF70), with a mean of 9.0208. The PIC across all the populations ranged from 0.4754 (MCMA54) to 0.8325 (MAF70). In total, these loci were polymorphic and suitable for sheep genetic diversity analysis.
Table 4Pairwise differences between population (FST) using microsatellite markers.

∗ Mean the significance p value (P<0.05) in variance analysis.
3.2 Genetic differentiation within and between sheep populations
In order to analyze the degree of differentiation within and between populations, F statistics were calculated in the nine sheep populations. The results are shown in Table 2. The FIT value of the 26 microsatellite loci varied between 0.0281 (MCM140) and 0.4481 (SRCRSP5) in the nine populations. The FIS value ranged from −0.0500 (SRCRSP9) to 0.1551 (TGLA53). In the pairwise-population FST analysis, the greatest divergence was observed between BAM and DOP (0.1212) and between BAM and DST (0.1212) (Table 4 and Fig. 1). According to the chi-square test of FST, all populations showed significant divergence (P<0.05) from each other (Table 4). The overall FST of each locus for nine sheep populations ranged from 0.0473 to 0.1414, with a mean of 0.079. The results indicated that the genetic variation between these populations reached 7.9 %.
Table 5Nei's genetic distances (above the diagonal) and Nei's standard genetic distances (below the diagonal) for nine sheep populations.
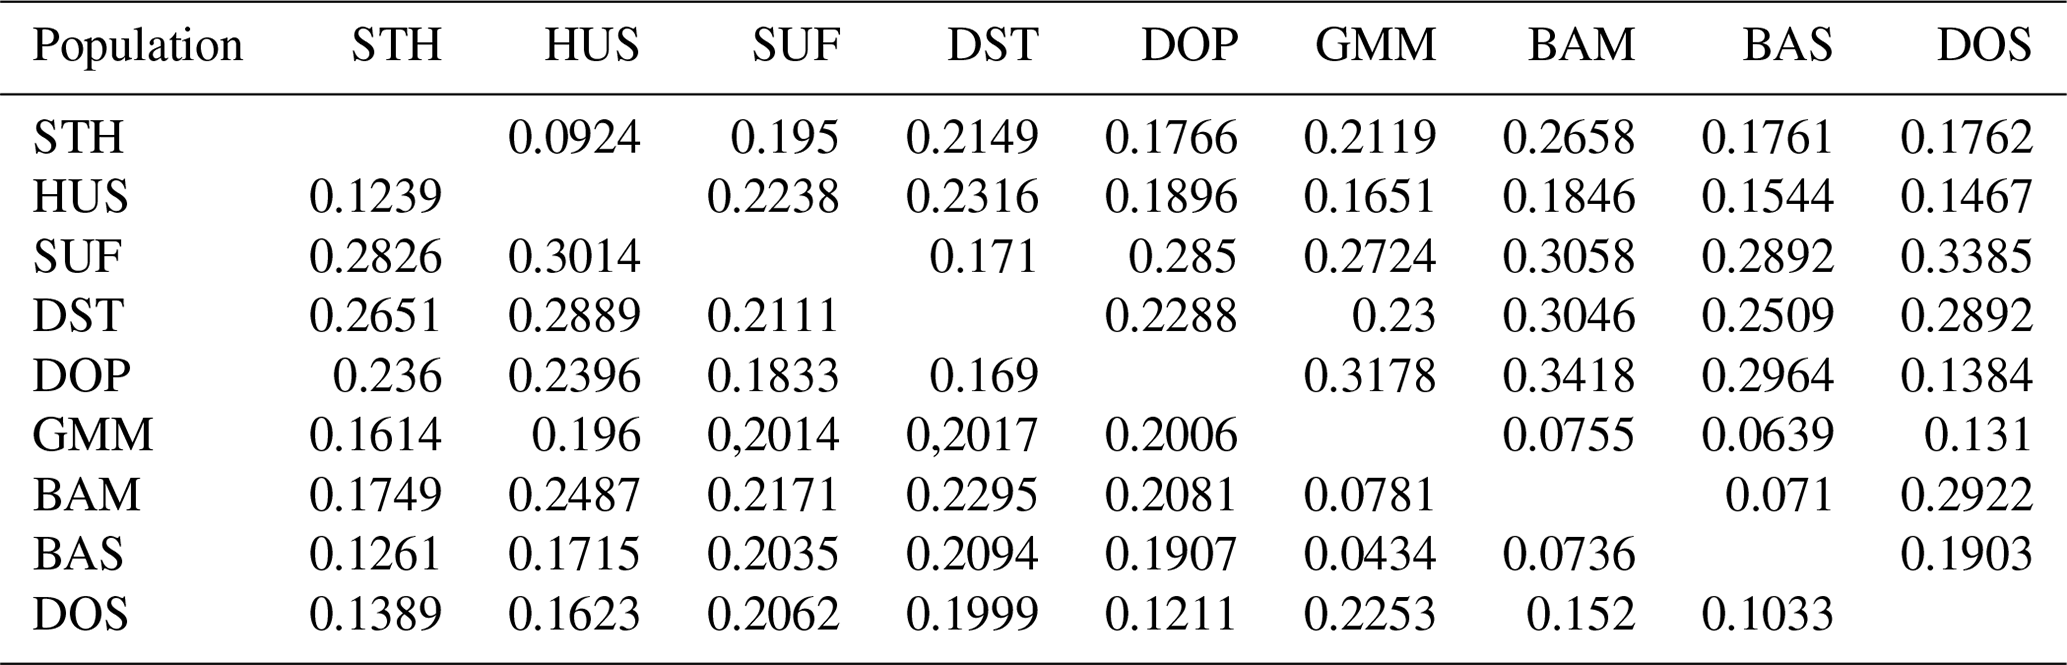
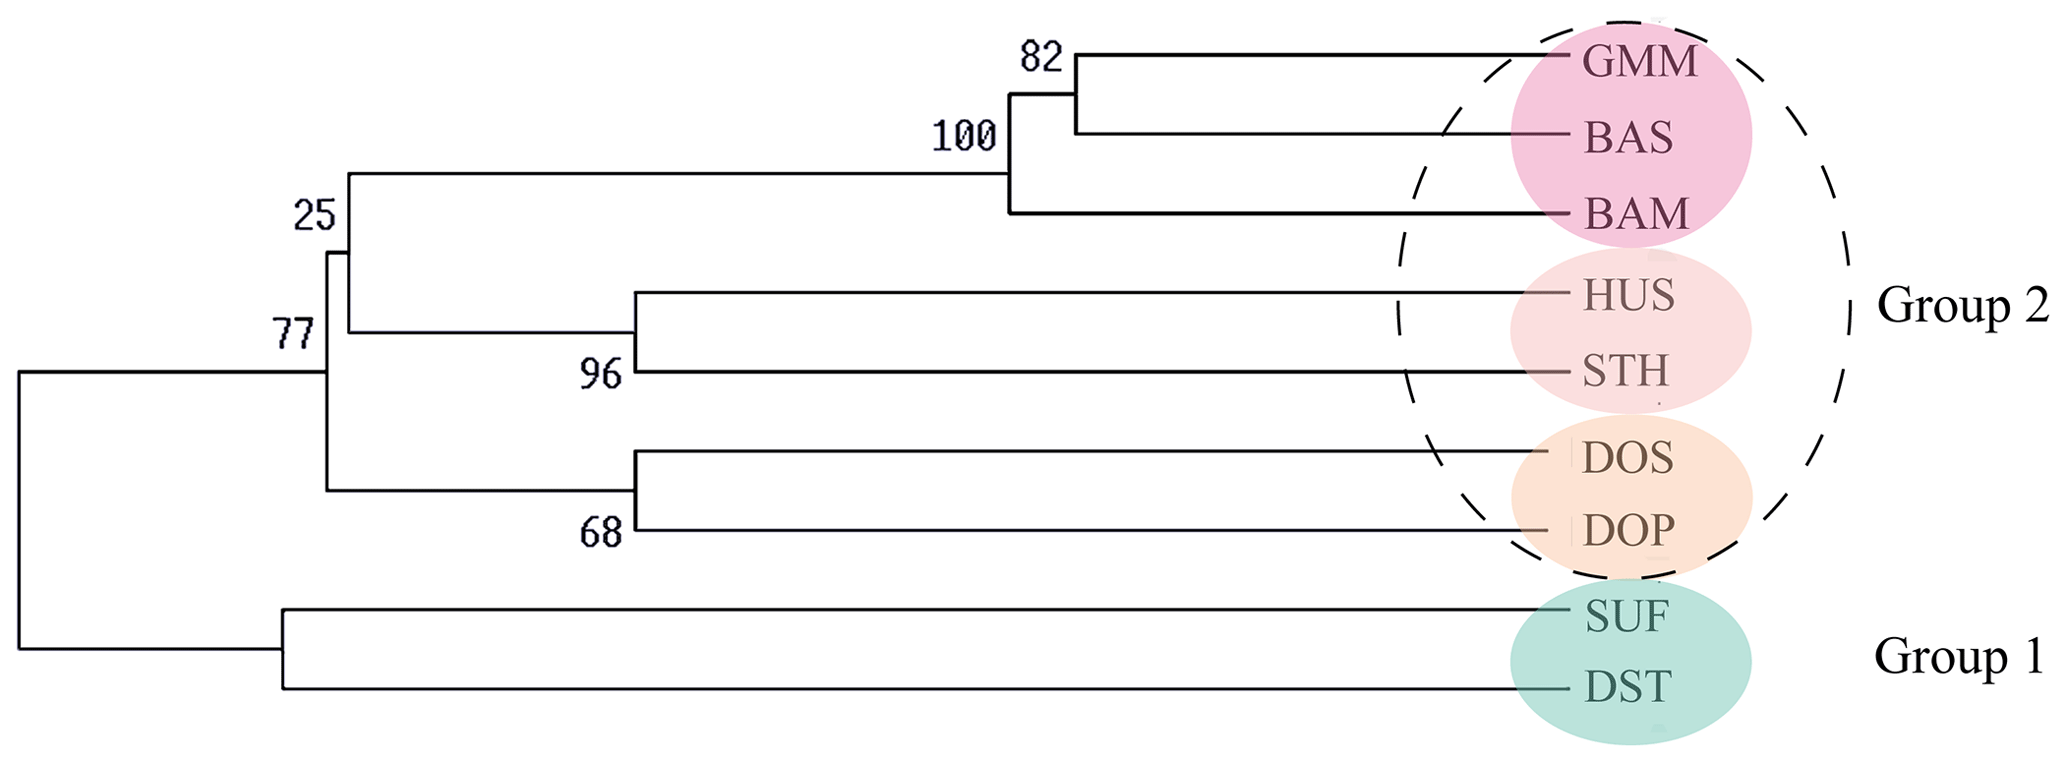
Figure 2UPGMA phylogenetic tree of nine sheep populations based on Nei's genetic distance (DA).
3.3 Phylogenetic relationship and population structure of nine sheep populations
Firstly, the genetic distance among nine sheep populations is shown in Table 5. The genetic distance DA ranged from 0.0434 to 0.3418 and DS ranged from 0.0639 to 0.2081. According to the Nei's genetic distance (DA), an un-weighted pair-group method (UPGMA) phylogenetic tree of nine sheep populations was constructed (Fig. 2). The results indicated that nine sheep populations can be divided into two groups. SUF and DST were clustered in one group. The other seven populations were classed into another group. Then the second group was further divided into three clusters: GMM–BAS–BAM, HUS–STH and DOS–DOP.
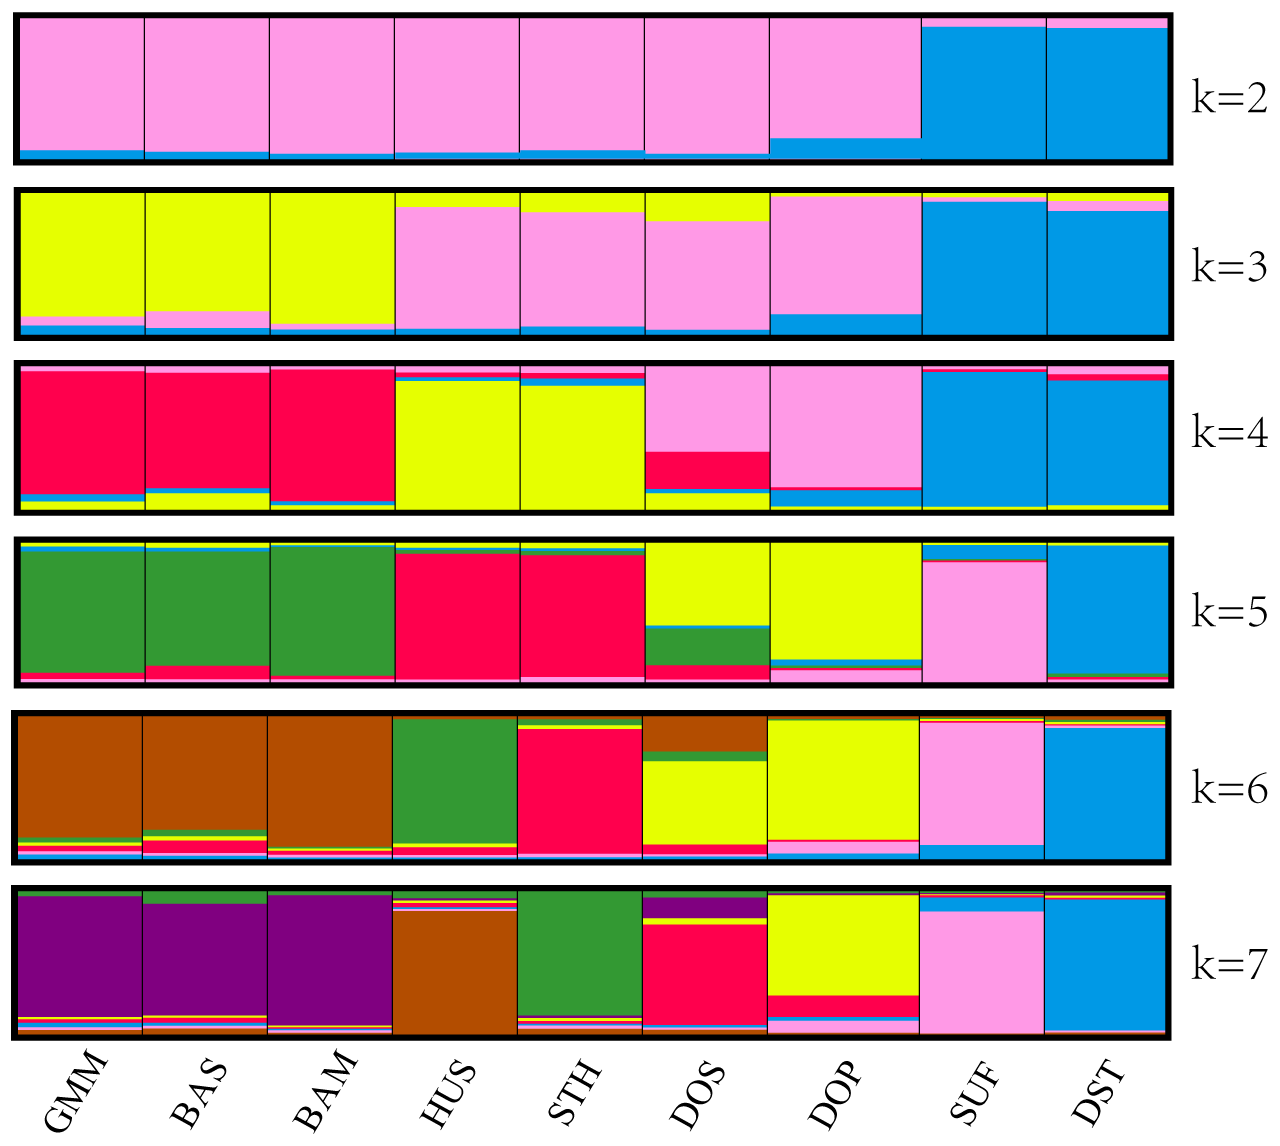
The above clustering results were also confirmed by structural analysis. In Fig. 3, each population is represented by a rectangle broken into k colored segments. At k=2, all the populations were separated into two different groups: the first group comprised SUF and DST, and the other consisted of the remaining seven populations. At k=3, the remaining seven populations were divided into two clusters (GMM–BAS–BAM and HUS–STH–DOS–DOP). At k=4, HUS and STH were clustered into one new subgroup, and DOS and DOP were clustered into another subgroup. In addition, from k=5 to k=7, no more new clusters generated. The clustering results were highly consistent with the UPGMA phylogenetic tree.
To infer migration events between populations, a maximum likelihood tree (Fig. 4a, b) was built using TreeMix. The residuals from the trees were inspected to estimate how well the model fit the data (Fig. 4c, d). Residuals above or below zero indicate that populations are more or less close to each other than they are presented in the tree. Based on this, it is implied that the actual genetic relationships between SUF and GMM and between DST and STH were closer than the evolutionary tree shows when no migration events were allowed (Fig. 4a, c). The model with one migration event (Fig. 4b) alluded an obvious gene flow from GMM to SUF. Combining the maximum likelihood tree (Fig. 4b) and residual plot (Fig. 4d), it was suggested that DST was more closely related to GMM than presented in the tree. However, when two or more migration events were assumed, the phylogenetic relationship shown in maximum likelihood tree was inconsistent with true breeding history of these sheep populations; therefore they are not shown in Fig. 4.
The results of genetic variation analysis give us some hints. Firstly, overall, the nine sheep populations in this study have high genetic diversity and their mean HE and HO reached 0.71 and 0.68, respectively. The higher the genetic heterozygosity, the greater the variation of population (Bai et al., 2014; Dotsev et al., 2018; Jawasreh et al., 2018). Therefore, the large genetic variation existed within these investigated sheep populations. Secondly, as far as single breed is concerned, HUS has a higher genetic diversity, while STH did not display the expected diversity. This is consistent with the actual situation that HUS is being valued more in recent years, and therefore the number of being raised is very large, while the number of purebred STH is decreasing gradually. From the perspective of genetic diversity indicators (HE and HO), the diversity of the current STH population is reduced compared to a few years ago (Ma et al., 2006; Liu et al., 2014). So, it is essential to formulate timely measures to protect genetic diversity of the famous prolific breed for meeting different needs in the future. In addition, the genetic diversity of four introduced mutton breeds (especially in DST) was relatively low in this study; therefore the result reminds us that the new individuals without kinship to current population should be added into these populations in order to keep rich genetic diversity and maintain excellent production performance as well as avoid inbreeding depression. Thirdly, for sheep in different regions of the world, Chinese sheep populations have an upper-middle level of genetic diversity, which is similar with previous reports (Niu et al., 2012; Liu et al., 2014; E et al., 2016, 2018). The genetic diversity in these Chinese sheep populations is higher than that of several breeds in Africa (e.g., West African Dwarf and Uda in Nigeria) (Agaviezor et al., 2012) and Europe (e.g., Cres island sheep and Lika pramenka sheep in Croatia; Denmark sheep in eastern Europe) (Tapio et al., 2010; Salamon et al., 2014). Compared with foreign sheep breeds, the intensity of artificial selection in Chinese sheep breeds is weak, which may be the reason for their high genetic diversity. Finally, the FST among nine sheep populations (7.9 %) is similar to results of other studies in sheep (Dossybayev et al., 2019; Dudu et al., 2020), implying that a moderate genetic differentiation (5 %–15 %) exists among sheep populations.
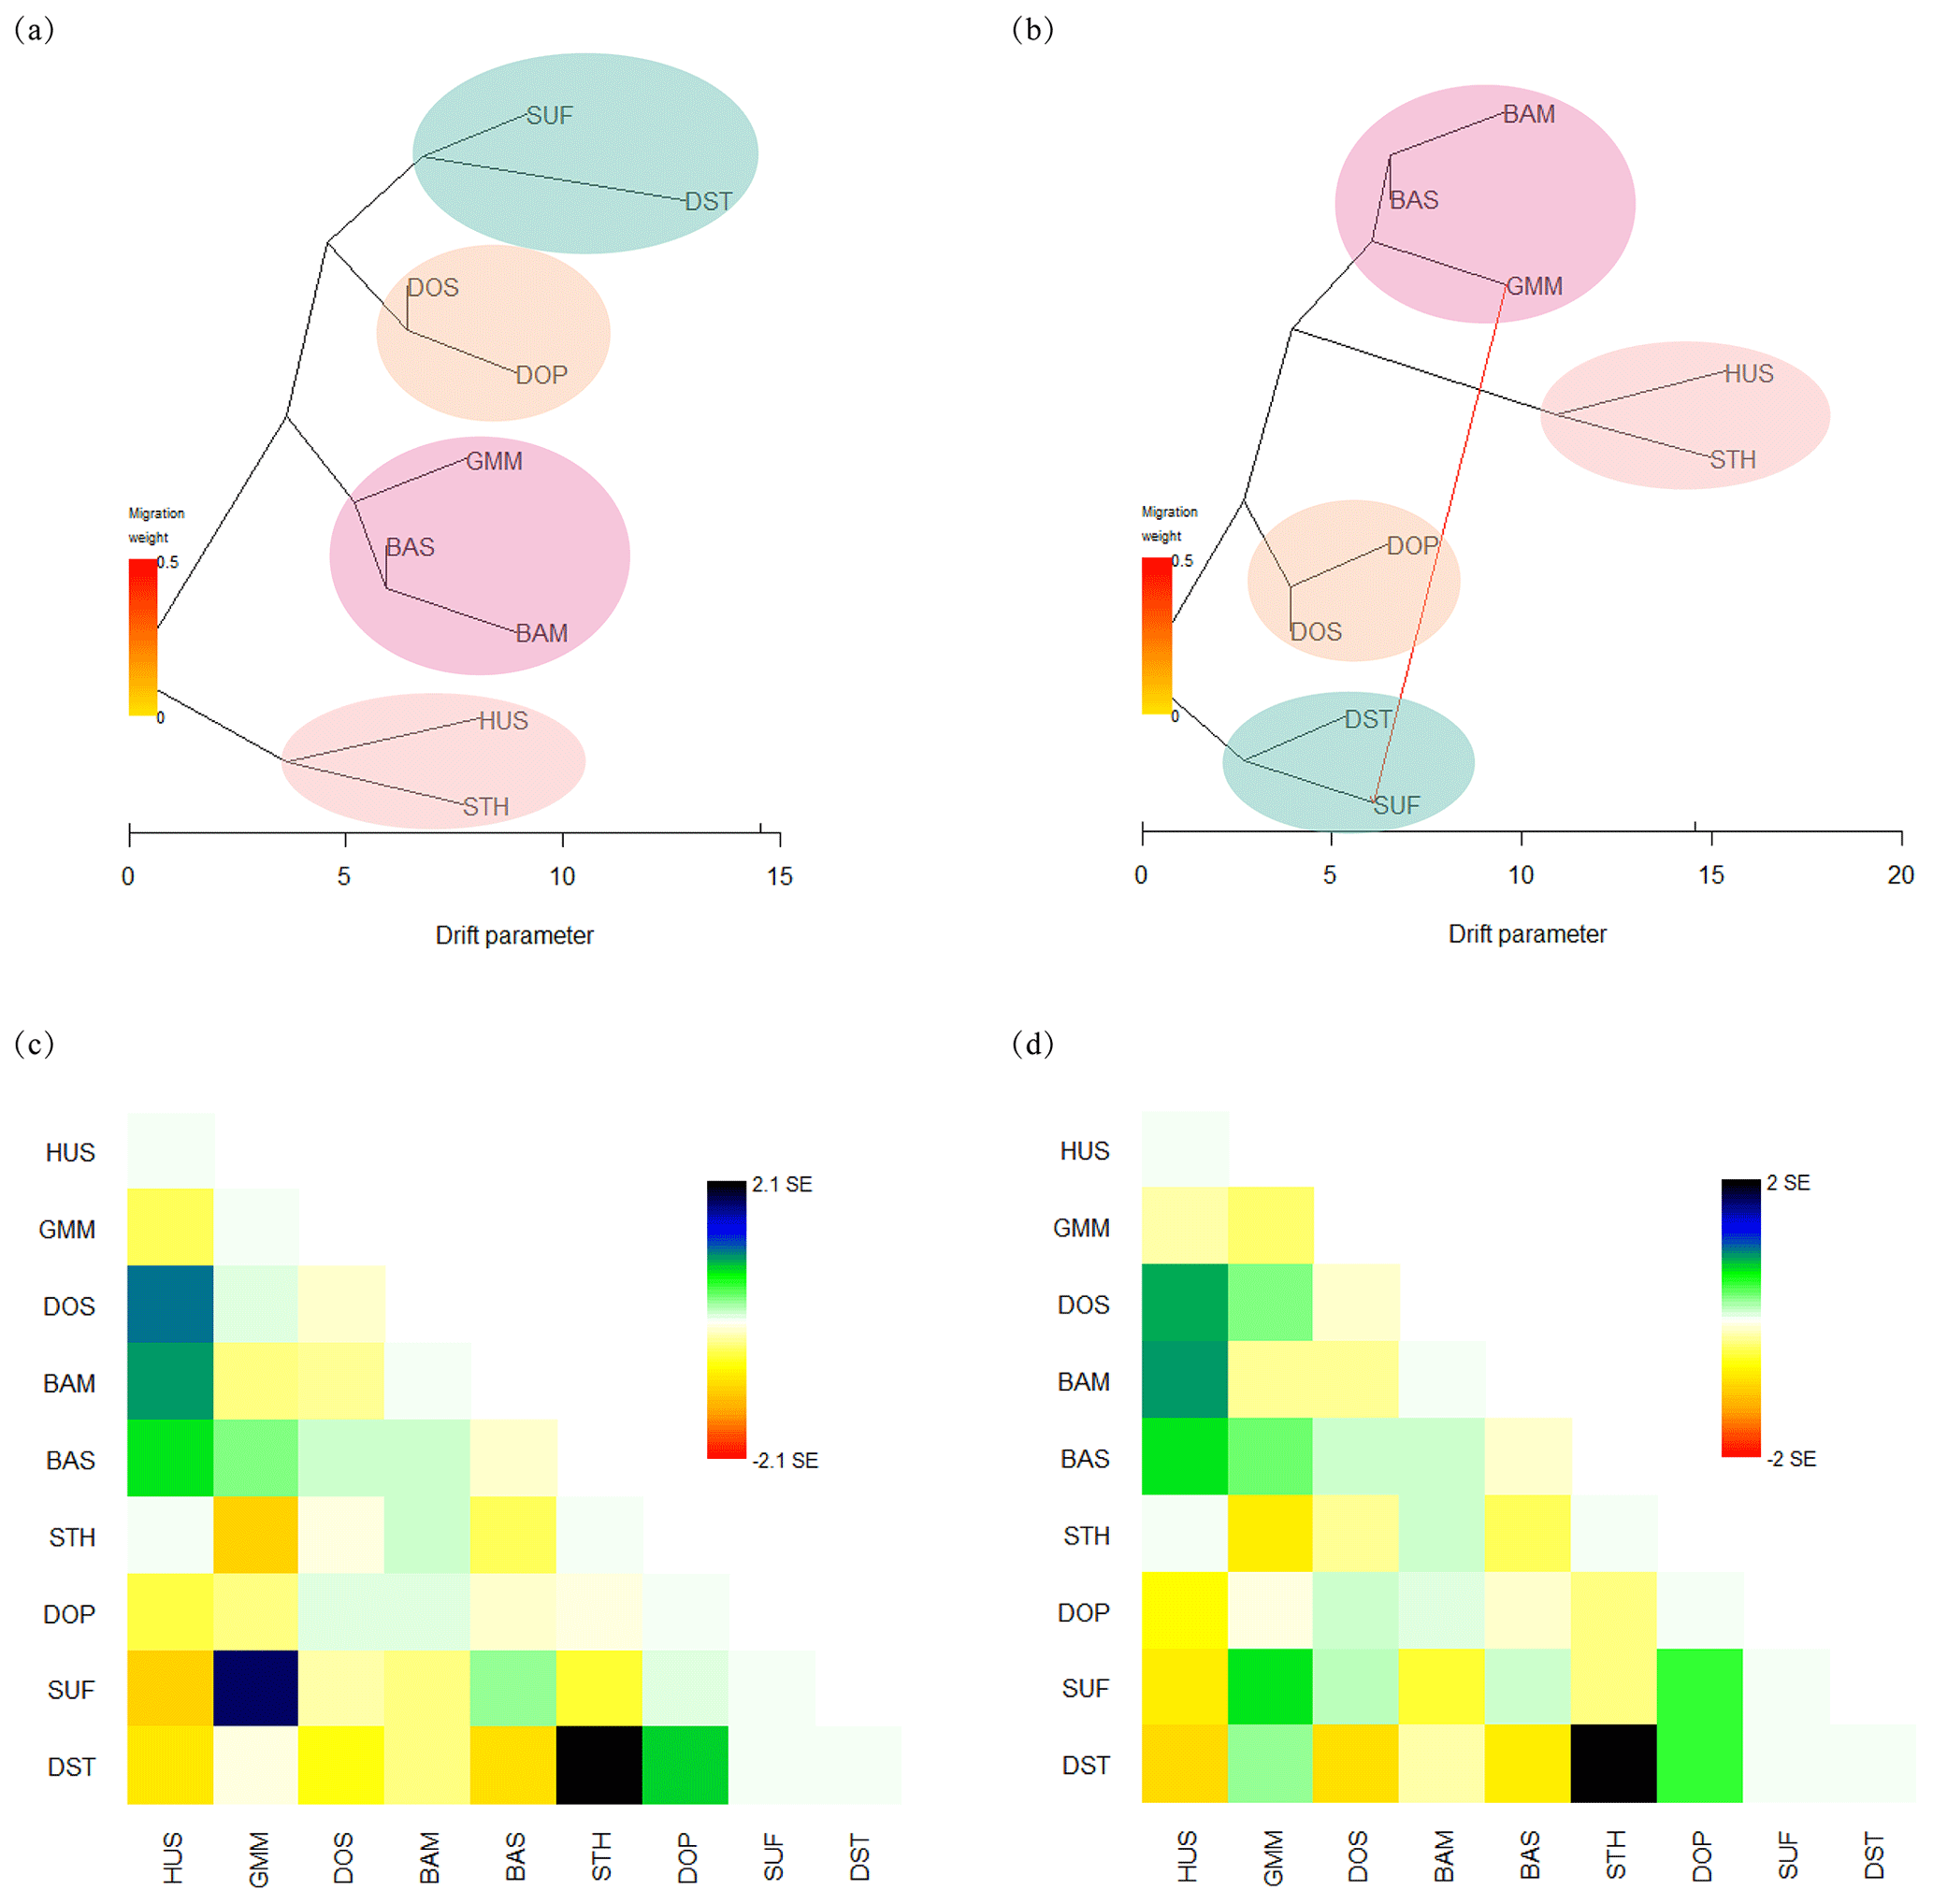
Figure 4Maximum likelihood trees among nine sheep populations constructed with TreeMix. (a) Maximum likelihood tree without migration events; (b) maximum likelihood tree with one migration event; (c) residual fit without migration events; (d) residual fit with one migration event.
The results of the UPGMA phylogenetic tree and structure analysis are consistent with breeding history of these sheep breeds. First of all, SUF and DST were clustered in one group. Since both SUF and DST horn were originally bred in the UK and both of their sire lines are Southdown rams (China National Commission of Animal Genetic Resources, 2011), genetic relationships between the two breeds were relatively closer and clustered together. Then the other seven sheep populations were clustered into another group. Of them, the three populations (GMM, BAM and BAS) were classed in one subgroup. The sire line in the initial breeding process of BAM and BAS is GMM and BAM rams, respectively. Therefore, a close genetic relationship existed among the three populations. Then, both HUS and STH belong to short fat-tailed Mongolian sheep (China National Commission of Animal Genetic Resources, 2011; Wang et al., 2014; Wei et al., 2015). A previous study suggested that, from the Mongolian Plateau, short fat-tailed sheep migrated southeast to the east of China (Zhao et al., 2017), which is a current distribution area of HUS and STH. Therefore, the two breeds were clustered together.
The gene flow and genetic exchange in the nine sheep populations were elucidated by TreeMix analysis. The results implied the possible gene flow from GMM to SUF. First of all, the gene flow is probably related to the history of human migration in Europe. From the 7th century BCE to the 3rd century BCE, Celtic tribes living in Germany had a great westward migration, and some of them entered Britain (Byrne et al., 2018). Then, from the fifth century CE, some of the Saxons and Angles of Germanic tribes again poured into Great Britain from Germany. Sheep has been considered as an important and easy-to-carry domestic animal for human several thousand years ago; therefore the gene flow between GMM and SUF might appear following human migrations, commercial trade, and extensive transport. Secondly, the gene flow was associated with the widespread use of Merino sires across Europe that commenced after the Middle Ages. Therefore, extensive haplotype sharing between Merino (including GMM) and other European breeds was observed (Kijas et al., 2012). Thirdly, previous analysis on the genetic relationships among world's sheep breeds suggests a major sheep migration route from South-West Asia to Britain and the Nordic regions, whose end potentially includes the route from Germany to the Britain (Kijas et al., 2012). Meanwhile, the genome-wide analysis of world's sheep breeds reveals frequent genetic exchange occurred during the development of modern sheep breeds (Kijas et al., 2012). In summary, these results can help us further understand the migration history and genetic relationship among populations for this important livestock species.
As a whole, these sheep populations in this study exhibited rich genetic diversities. However, specifically for individual breeds, STH and the four introduced populations did not display the expected diversity. The results of the UPGMA phylogenetic tree and the structure analysis are consistent with sheep breeding history. TreeMix analysis hinted at a possible gene flow from GMM to SUF. Together, these results will have important implications for sheep breed-specific management.
The data sets are available upon request from the corresponding author.
Conceptualization was done by RZ. Data curation was carried out by RZ and RD. The formal analysis was carried out by QX. MC acquired funding. Methodology was done by QX. Project administration was carried out by RD and XW. CW and ZP were responsible for the software. The original draft was written by QX and RD, while RD, MC and ZP wrote the review and edited the manuscript.
The authors declare that they have no conflict of interest.
We thank Ran Di, Mingxing Chu and all the facilities involved including the Chinese Academy of Agricultural Sciences.
This research has been supported by the National Natural Science Foundation of China (grant nos. 31861143012, 31472078 and 31772580); the Major Science and Technology Program of Inner Mongolia Autonomous Region of China, the Earmarked Fund for China Agriculture Research System (grant no. CARS-38); the Agricultural Science and Technology Innovation Program of China (grant no. ASTIP-IAS13); the China Agricultural Scientific Research Outstanding Talents and Their Innovative Teams Program, China High-level Talents Special Support Plan Scientific and Technological Innovation Leading Talents Program (grant no. W02020274); and the Tianjin Agricultural Science and Technology Achievements Transformation and Popularization Program (grant no. 201704020).
This paper was edited by Steffen Maak and reviewed by three anonymous referees.
Agaviezor, B. O., Peters, S. O., Adefenwa, M. A., Yakubu, A., Adebambo, O. A., Ozoje, M. O., Ikeobi, C. O. N., Wheto, M., Ajayi, O. O., Amusan, S. A., Ekundayo, O. J., Sanni, T. M., Okpeku, M., Onasanya, G. O., Donato, M. D., Ilori, B. M., Kizilkaya, K., and Imumorin, I. G.: Morphological and microsatellite DNA diversity of Nigerian indigenous sheep, J. Anim. Sci. Biotechnol., 3, 38, https://doi.org/10.1186/2049-1891-3-38, 2012.
Arranz, J. J., Bayon, Y., and San Primitivo, F.: Genetic relationships among Spanish sheep using microsatellites, Anim. Genet., 29, 435–440, https://doi.org/10.1046/j.1365-2052.1998.296371.x, 1998.
Arranz, J. J., Bayon, Y., and San Primitivo, F.: Differentiation among Spanish sheep breeds using microsatellites, Genet. Sel. Evol., 33, 529–542, https://doi.org/10.1186/1297-9686-33-5-529, 2001.
Bai, J. Y., Jia, X. P., Yang, Y. B., Zhang, X. H., Pang, Y. Z., Wang, Y. Q., and Qi, Y. X.: Polymorphism analysis of Henan fat-tailed sheep using microsatellite markers, J. Anim. Plant. Sci., 24, 965–968, 2014.
Bernardo, C., Filipe, P., Frederick, A., Antonio, A., Félix, G., Ingrid, M., Ikeobi, C. O. N., Wheto, M., Ajayi, O. O., Amusan, S. A., Ekundayo, O. J., Sanni, T. M., Okpeku, M., Onasanya, G. O., Donato, M. D., Ilori, B. M., Kizilkaya, K., and Stear, M. J.: Revealing the history of sheep domestication using retrovirus integrations, Science, 324, 532–536, https://doi.org/10.1126/science.1170587, 2009.
Byrne, R. P., Martiniano, R., Cassidy, L. M., Carrigan, M., and McLaughli, R.: Insular Celtic population structure and genomic footprints of migration, PLOS Genet., 14, e1007152, https://doi.org/10.1371/journal.pgen.1007152, 2018.
Câmara, T. S., Nunes, J. F., Diniz, F. M., Silva, G. R., and Araújo, A. M.: Genetic diversity and relatedness between Canindé and British Alpine goat breeds in Northeastern Brazil accessed by microsatellite markers, Genet. Mol. Res., 16, https://doi.org/10.4238/gmr16019569, 2017.
Carvalho, G. M. C., Paiva, S. R., Araújo, A. M., Mariante, A., and Blackburn, H. D.: Genetic structure of goat breeds from Brazil and the United States: Implications for conservation and breeding programs, J. Anim. Sci., 93, 4629–4636, https://doi.org/10.2527/jas.2015-8974, 2015.
China National Commission of Animal Genetic Resources, Animal genetic resources in China: sheep and goats, Chinese Agricultural Press, Beijing, China, 451 pp., 2011.
Davies, K. P., Maddox, J. F., Matthews, P., Hulme, D. J., and Beh, K. J.: Ovine dinucleotide repeat polymorphism at the McM15, McM152, McM159, McM164 and McM210 loci, Anim. Genet., 26, 371, https://doi.org/10.1111/j.1365-2052.1995.tb02682.x,1995.
Di, R., Chu, M. X., Li, Y. L., Zhang, L., Fang, L., Feng, T., Cao, G. L., Chen, H. Q., and Li, X. W.: Predictive potential of microsatellite markers on heterosis of fecundity in crossbred sheep, Mol. Biol. Rep., 39, 2761–2766, https://doi.org/10.1007/s11033-011-1032-7, 2012.
Diez-Tascon, C., Littlejohn, R. P., Almeida, P. A., and Crawford, A. M.: Genetic variation within the Merino sheep breed: analysis of closely related populations using microsatellites, Anim. Genet., 31, 243–251, https://doi.org/10.1046/j.1365-2052.2000.00636.x, 2000.
Dossybayev, K., Orazmbetova, Z., Mussayeva, A., Saitou, N., Zhapbasov, R., Makhatov, B., and Bekmanov, B.: Genetic diversity of different breeds of Kazakh sheep using microsatellite analysis, Arch. Anim. Breed., 62, 305–312, https://doi.org/10.5194/aab-62-305-2019, 2019.
Dotsev, A. V., Deniskova, T. E., Okhlopkov, I. M., Mészáros, G., Sölkner, J., Reyer, H., Wimmers, K., Brem, G., and Zinovieva, N. A.: Genome-wide SNP analysis unveils genetic structure and phylogeographic history of snow sheep (Ovis nivicola) populations inhabiting the Verkhoyansk Mountains and Momsky Ridge (northeastern Siberia), Ecol. Evol., 8, 8000–8010, https://doi.org/10.1002/ece3.4350, 2018.
Dudu, A., Popa, G. O., Ghita, E., Pelmus, R., Lazar, C., Costache, M., and Georgescu, S. E.: Assessment of genetic diversity in main local sheep breeds from romania using microsatellite markers, Arch. Anim. Breed., 63, 53–59, https://doi.org/10.5194/aab-63-53-2020, 2020.
E, G. X., Zhong, T., Ma, Y., Gao, H. I., and Huang, Y.: Conservation genetics in Chinese sheep: Diversity of fourteen indigenous sheep (Ovis aries) using microsatellite markers, Ecol. Evol., 6, 810–817, https://doi.org/10.1002/ece3.1891, 2016.
E, G. X., Ma, Y. H., Chu, M. X., Hong, Q. H., and Huang, Y. F.: Current genetic diversity in eight local Chinese sheep populations, Mol. Biol. Rep., 46, 1307–1311, https://doi.org/10.1007/s11033-018-4445-8, 2018.
E, G. X., Hong, Q. H., Zhao, Y. J., Ma, Y. H., Chu, M. X., Zhu, L., and Huang, Y. F.: Genetic diversity estimation of Yunnan indigenous goat breeds using microsatellite markers, Ecol. Evol., 9, 5916–5924, https://doi.org/10.1002/ece3.5174, 2019.
Falush, D., Stephens, M., and Pritchard, J. K.: Inference of population structure using multilocus genotype data: linked loci and correlated allele frequencies, Genetics, 164, 1567–1587, 2003.
Goudet, J., Perrin, N., and Waser, P.: Tests for sex-biased dispersal using Bi-parentally inherited genetic markers, Mol. Ecol., 11, 1103–1114, https://doi.org/10.1046/j.1365-294x.2002.01496.x, 2002.
Jawasreh, K. I., Ababneh, M. M., Ismail, Z. B., Younes, A. M. E. B., and Sukhni, I. A.: Genetic diversity and population structure of local and exotic sheep breeds in Jordan using microsatellites markers, Vet. World., 11, 778–781, https://doi.org/10.14202/vetworld.2018.778-781, 2018.
Jing, L. and Zhang, Y.: Advances in research of the origin and domestication of domestic animals, Biodiversity Science, 17, 319, https://doi.org/10.3724/sp.j.1003.2009.09150, 2009.
Kawamura, K., Akiyama, T., Yokota, H. O., Tsutsumi, M., and Wang, S.: Quantifying grazing intensities using geographic information systems and satellite remote sensing in the xilingol steppe region, Inner Mongolia, China. Agr. Ecosyst. Environ., 107, 83–93, https://doi.org/10.1016/j.agee.2004.09.008, 2005.
Kijas, J. W., Lenstra, J. A., Hayes, B., Boitard, S., Porto Neto, L. R., Cristobal, M. S., Servin, B., Mcculloch, R., Whan, V., and Gietzen, K.: Genome-wide analysis of the world's sheep breeds reveals high levels of historic mixture and strong recent selection, PLoS Biol., 10, e1001258, https://doi.org/10.1371/journal.pbio.1001258, 2012.
Laoun, A., Harkat, S., Lafri, M., Gaouar, S. B. S., and Silva, A. D.: Inference of breed structure in farm animals: empirical comparison between SNP and microsatellite performance, Genes., 11, 57, https://doi.org/10.3390/genes11010057, 2020.
Liu, J. B., Yue, Y. J., Lang, X., Wang, F., Zha, X., Guo, J., Feng, R. L., Guo, T. T., Yang, B. H., and Sun, X. P.: Analysis of geographic and pairwise distances among sheep populations, Genet. Mol. Res., 13, 4177–4186, https://doi.org/10.4238/2014.June.9.4, 2014.
Liu, G., Zhao, Q. J., Lu, J., Sun, F. Z., Han, X., Zhao, J. J., Feng, H. Y., Wang, K. J., and Liu, C. S.: Insights into the genetic diversity of indigenous goats and their conservation priorities, Asian-Australas, J. Anim. Sci., 32, 1501–1510, https://doi.org/10.5713/ajas.18.0737, 2019.
Ma, Y. Y., Zhao, Q. J., Yang, Y., Yan, J. J., Chen, H. Y., Yuan, C. Z., Ji, X., Di, R., Yang, J., Guo, J., Li, H. B., and Guan, W. J.: The genetic diversity of 31 Chinese indigenous sheep breeds analysis using microsatellite markers, Chinese Association of Animal Science and Veterinary Medicine, 2006, 146–150, 2006.
Madilindi, M. A., Banga, C. B., Bhebhe, E., Sanarana, Y. P., and Mapholi, N. O.: Genetic diversity and relationships among three Southern African Nguni cattle populations, Trop. Anim. Health Prod., 52, 753–762, https://doi.org/10.1007/s11250-019-02066-y, 2019.
Martin-Burriel, I., Garcia-Muro, E., and Zaragoza, P.: Genetic diversity analysis of six Spanish native cattle breeds using microsatellites, Anim. Genet., 30, 177–182, https://doi.org/10.1046/j.1365-2052.1999.00437.x, 1999.
Mburu, D. N., Ochieng, J. W., Kuria, S. G., Jianlin, H., Kaufmann, B., Rege, J. E., and Hanotte, O.: Genetic diversity and relationships of indigenous Kenyan camel (Camelus dromedarius) populations: implications for their classification, Anim. Genet., 34, 26–32, https://doi.org/10.1046/j.1365-2052.2003.00937.x, 2003.
Nei, M., Tajima, F., and Tateno, Y.: Accuracy of estimated phylogenetic trees from molecular data, J. Mol. Evol., 19, 19153–19170, https://doi.org/10.1007/BF02300753, 1983.
Niu, L. L., Li, H. B., Ma, Y. H., and Du, L. X.: Genetic variability and individual assignment of Chinese indigenous sheep populations (Ovis aries) using microsatellites, Anim. Genet., 43, 108–111, https://doi.org/10.1111/j.1365-2052.2011.02212.x, 2012.
Pariset, L., Bavarese, M. C., Cappuccio, I., and Valentini, A.: Use of microsatellites for genetic variation and inbreeding analysis in Sarda sheep flocks of central Italy, J. Anim. Breeding. Genet., 120, 425–432, https://doi.org/10.1046/j.0931-2668.2003.00411.x, 2003.
Park, S.: Excel Microsatellite toolkit, Version 3.1.1, Animal Genomics Lab website, Dublin, Ireland: University College, 2008.
Pickrell, J. K., Pritchard, J. K., and Tang, H.: Inference of population splits and mixtures from genome-wide allele frequency data, PLOS Genet., 8, e1002967, https://doi.org/10.1371/journal.pgen.1002967, 2012.
Pritchard, J. K., Stephens, M., and Donnely, P.: Inference of population structure using multilocus genotype data, Genetics, 155, 945–959, 2000.
Rosenberg, N. A. Distruct: a program for the graphical display of population structure, Mol. Ecol. Notes, 4, 137–138, https://doi.org/10.1046/j.1471-8286.2003.00566.x, 2003.
Sambrook, J. and Russell, D. W.: Molecular cloning: A Laboratory Manual, 3rd ed., Vol. 3. New York, NY: Cold Spring Harbour Laboratory Press, 2001.
Salamon, D., Gutierrez, G. B., Arranz, J. J., Barreta, J., Batinic, V., and Dzidic, A.: Genetic diversity and differentiation of 12 eastern Adriatic and western Dinaric native sheep breeds using microsatellites, Animal, 8, 200–207, https://doi.org/10.1017/S1751731113002243, 2014.
Stahlberger-Saitbekova, N., Shlapfer, J., Dolf, G., and Gaillard, C.: Genetic relationships in Swiss sheep breeds based on microsatellite analysis, J. Anim. Breed. Genet., 118, 379–387, https://doi.org/10.1111/j.1439-0388.2008.00768.x, 2001.
Tapio, M., Miceikiene, I., Vilkki, J., and Kantanen, J.: Comparison of microsatellite and blood protein diversity in sheep: inconsistencies in fragmented breeds, Mol. Ecol., 12, 2045–2056, https://doi.org/10.1046/j.1365-294x.2003.01893.x, 2003.
Tapio, M., Ozerov, M., Tapio, L., Toro, M. A., Marzanov, N., Cinkulov, M., Goncharenko, G., Kiselyova, T., Murawski, M., and Kantanen, J.: Microsatellite-based genetic diversity and population structure of domestic sheep in Northern Eurasia, BMC Genet., 11, 76, https://doi.org/10.1186/1471-2156-11-76, 2010.
Ullah, A., Ahmad, S., and Ibrahim, M.: Microsatellite based genetic characterization and bottleneck analysis of Kari and Madakhlasht sheep breeds from chitral district of khyber Pakhtunkhwa, Pakistan, Asian-Australas, J. Anim. Sci., https://doi.org/10.5713/ajas.19.0418, 2020.
Vargas, K., Erwin, J. A., Culver, M., Blais, B. R., and Bennett, K.: Genetic assessment of a bighorn sheep population expansion in the Silver Bell Mountains, Arizona. Peer J., 6, e5978, https://doi.org/10.7717/peerj.5978, 2018.
Wang, Y. L., Li, J. X., Mao, D. G., Wang, H. L., Li, Y. X., Qian, Y., Meng, C. H., and Cao, S. X.: Analysis of genetic diversity on microsatellite in six sheep breeds, China Animal Husbandry and Veterinary Medicine, 41, 174–179, https://doi.org/10.18632/oncotarget.4569, 2014.
Wei, C., Wang, H., Liu, G., Wu, M. M., Cao, J., Liu, Z., Liu, R. Z., Zhao, F. P., Zhang, L., Lu, J., Liu, C. S., and Du, L. X.: Genome-wide analysis reveals population structure and selection in Chinese indigenous sheep breeds, BMC Genomics, 16, 194, https://doi.org/10.1186/s12864-015-1384-9, 2015.
Zeder, M. A.: Domestication and early agriculture in the mediterranean basin: origins, diffusion, and impact, P. Natl. Acad. Sci. USA, 105, 11597–11604, https://doi.org/10.1073/pnas.0801317105, 2008.
Zhao, Y. X., Yang, J., Lv, F. H., Hu, X. J., Xie, X. L., Zhang, M., Li, W. R., Liu, M. J., Wang, Y. T., Li, J. Q., Liu, Y. G., Ren, Y. L., Wang, F., EEr, H., Kantanen, J., Lenstra, J. A., Han, J. L., and Li, M. H.: Genomic Reconstruction of the History of Native Sheep Reveals the Peopling Patterns of Nomads and the Expansion of Early Pastoralism in East Asia, Mol. Biol. Evol., 34, 2380–2395, https://doi.org/10.1093/molbev/msx181, 2017.
Zhong, T., Han, J. L., Guo, J., Zhao, Q. J., Fu, B. L., Pu, Y. B., He, X. H., Jeon, J. T., Guan, W. J., and Ma, Y. H.: Tracing genetic differentiation of Chinese Mongolian sheep using microsatellites, Anim. Genet., 42, 563–565, https://doi.org/10.1111/j.1365-2052.2011.02181.x, 2011.