
the Creative Commons Attribution 4.0 License.
the Creative Commons Attribution 4.0 License.
 | 29 Jan 2021
Effects of polymorphism of the GPAM gene on milk quality traits and its relation to triglyceride metabolism in bovine mammary epithelial cells of dairy cattle
Haibin Yu
Yaolu Zhao
Ambreen Iqbal
Lixin Xia
Zitong Bai
Hao Sun
Xibi Fang
Zhihui Zhao
Mitochondrial glycerol-3-phosphate acyltransferase (GPAM) catalyses the initial and rate-regulated first-stage pathway of glycerol lipid synthesis and helps to allocate acyl-CoA (acyl-coenzyme A) to triglyceride (TG) synthesis and away from degradation pathways in animal lipometabolism-related pathways. In this study, RNA interference (RNAi) and GPAM gene overexpression were used to examine the correlation between the expression of GPAM and adipogenesis in bovine mammary epithelial cells (bMECs). Additionally, three novel polymorphisms were identified within the bovine key functional domain of GPAM with Sanger sequencing. The relationship between variants of the GPAM gene and milk quality traits of Chinese Holstein cows was then analysed using statistical methods. The results showed that knockdown of the GPAM gene significantly reduced the synthesis of triglycerides in the bMECs (p < 0.05), whereas the overexpression of the GPAM gene significantly increased the synthesis of TG (p < 0.05). In Chinese Holstein dairy cattle, the polymorphic locus of the GPAM gene E20-3386G > A was significantly correlated with fat, protein and somatic cell count (p < 0.05); I18-652A > G was significantly correlated with fat, total fat content, protein, dry matter and somatic cell count (p < 0.05); and I18-726A > G was significantly correlated with protein, milk yield, dry matter and somatic cell count (p < 0.05). Specifically, individuals with the AA genotype of the I18-652A > G and E20-3386G > A polymorphic loci had a higher milk fat percentage (p < 0.05). In summary, GPAM plays a pivotal role in the intracellular regulation of triglyceride, and its mutations could work as a competent molecular marker for selective breeding in dairy cattle.
- Article
(1541 KB) - Full-text XML
- BibTeX
- EndNote


Milk is defined as the secretion from a mammal's mammary glands, and the key function of milk is to provide nutrition to mammalian young. The milk of some animals like buffalos, cows, sheep and goats is also used for human consumption. Worldwide, dairy farms produced about 820×106 tons of milk in 2016 (Salter, 2017). According to an estimation from the Food and Agriculture Organization (FAO), 85 % of all of the milk produced worldwide in 2011 came from cows (Gerosa and Skoet, 2012). Due to a change in consumer demand and preference towards milk fat, which is considered to be a good source of dietary fat, milk fat is currently used as an indicator of milk quality. This has prompted livestock farmers to produce dairy products with a diverse range of fat contents, thereby urging researchers to explore the molecular mechanisms governing milk fat production (Shen et al., 2016). Milk quality for the farmer is related to the price, but the price of milk depends on fat, protein content and somatic cell count. There are many factors that affect milk quality, with the most important of these being genetics, nutrition and the management of animals, the lactation amount and the stages of lactation (Vikram and Jancy, 2016). The major constituent of milk fat is triglycerides (TGs), which comprise almost 97 % to 98 % of the milk fat content. Milk fat also includes fatty acids (FA) and cholesterol (CHO) as minor components (Jiang et al., 2020). TGs are an important part of milk, and their synthesis in mammary cells of cattle can affect the milk fat percentage (Holub and Kuksis, 1972).
GPAM belongs to the GPAT gene family and is located at chromosome 26q22 in bovine. The GPAM gene is also called GPTA1 and mtGPAT. The gene sequence of GPAM shows that it contains 20 exons that encode for protein (Roy et al., 2002, 2006). The GPAM gene catalyses the first committed steps of phospholipid and triglyceride (TG) biosynthesis (Roy et al., 2006). Previous work has proven that the GPAM gene plays a dynamic role in triglyceride (TG) synthesis, such as the 10-fold increase in the activity of the GPAM gene in 3T3-L1 adipocyte differentiation (Coleman et al., 1978) and the 5-fold increase in the activity of the GPAM gene during hepatocyte TG synthesis in the neonatal liver (Coleman and Haynes, 1983). It has also been reported that the GPAM in fat storage initiates 50 % of the TGs in the adipose and liver tissue in mice (Hammond et al., 2002). Moreover, studies have reported that TG and glycerophospholipid enzyme synthesis is present at the location of GPAM on the outer membrane of mitochondria, which is responsible for the transportation of the lysophosphatidate products to the endoplasmic reticulum (Bell and Coleman, 1980).
Triglyceride (TG) accumulates in the body of animals due to factors such as a carbohydrate-rich diet, eating more frequently and the availability of more energy. The majority of research on TG synthesis has concentrated on the transcriptional control of genes by PPAR and sterol SREBP, although some studies have also proven that GPAM may regulate the synthesis of triglyceride acutely (Lewin et al., 2001). Due to advancements in technology, examination of the role of the GPAM gene in lipid metabolism and fat deposition in Chinese Holstein cows is now possible.
The objective of this study is to explore the regulatory role of the GPAM gene on adipogenesis by RNA interference (RNAi) and gene overexpression as well as to investigate single nucleotide polymorphisms of the GPAM gene in Chinese Holstein cows in order to identify the relationship between genotypes and milk quality traits.
2.1 Ethics statements
All animal experiments in the present study strictly comply with the relevant regulations regarding the care and use of experimental animals issued by the Animal Protection and Use Committee of Jilin University (permit no. SYXK(Ji)pzpx20181227083).
2.2 Experimental materials
2.2.1 Animal cell line
The mammary epithelial cells were preserved by the Laboratory of Molecular Genetics, College of Animal Science, at Jilin University.
2.2.2 Animals
This study involved 241 Chinese Holstein dairy cattle from a dairy farm in Heilongjiang Province. The cows used were all from the same farm and the same batch, and their genetic backgrounds were similar. Milk was collected after the cow's second pregnancy in order to measure the related milk quality traits.
2.3 Traits analysis
Milk samples were collected 11 times at an interval of 30 d. Following sample collection, milk quality tests (milk yield, fat, protein, lactose, dry matter and urea) and data collection were carried out with a milk composition analyser (FOSS, MilkoScan FT3, Denmark).
2.4 Primers design and polymerase chain reaction (PCR) amplification
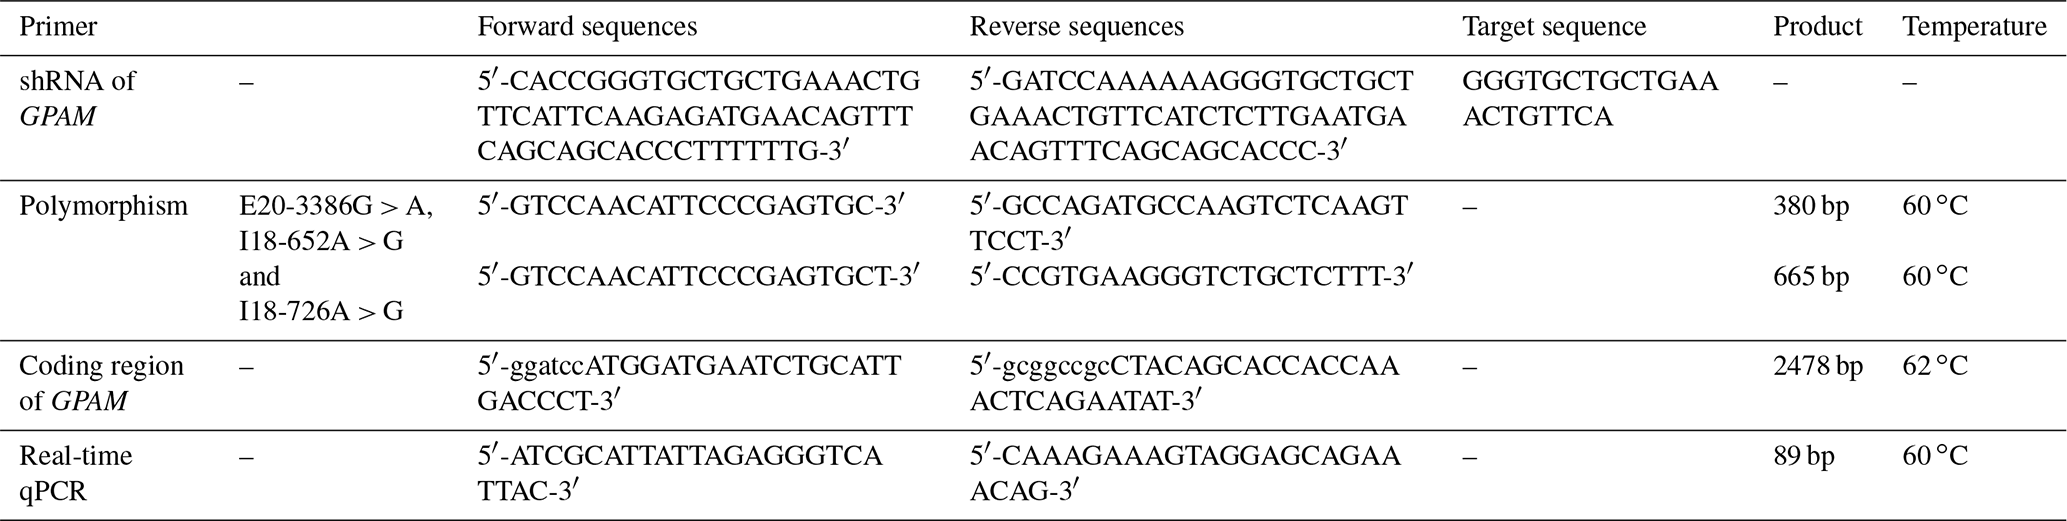
Premier 5 software was utilised to design the shRNA (short hairpin RNA) primers, the GPAM gene coding sequence (CDS) primers and the SNP (single nucleotide polymorphism) primers, based on the bovine GPAM gene's existing published sequences (ENSBTAG00000011917). All of the primers used in this study were synthesised by Genewiz (SuZhou, China). The primers' sequences are given in Table 1.
For polymerase chain reaction (PCR) amplification, a total 20 µL volume of 10 pmol L−1 of each primer, 140 ng of bovine genomic DNA, 5 µL of dNTP mix, 2 µL of buffer and 1.5 µL of Taq DNA polymerase (Takara), was made. The PCR amplification conditions were as follows: incubation of the PCR mixture at 95 ∘C for 5 min, 35 cycles of 95 ∘C for 30 s, the annealing temperature of each fragment for 30 s, 62 ∘C for 1000 bp min−1 and a final extension at 72 ∘C for 10 min.
A total volume of 50 µL was made for GPAM PCR amplification's open reading frame (ORF) and consisted of the following contents: 250 ng of bovine cDNA, 10 pmol L−1 of each primer, 10 µL of dNTP, 5 µL of buffer and 4 µL of PrimeSTAR HS DNA polymerase (Takara). The PCR amplification conditions were as follows: PCR mixture was first incubated at 95 ∘C for 5 min, followed by 30 cycles of 98 ∘C for 30 s, annealing temperature of each fragments for 30 s, and 72 ∘C for 2 min 30 s with a final extension step at 72 ∘C for 10 min.
2.5 Construction of the pBI-CMV3-GPAM and pGPU6-shRNA-GPAM vectors
2.5.1 Target site selection for small interfering RNA (siRNA) and the design of the hairpin siRNA template oligonucleotide
The target sequence of GPAM is GGGTGCTGCTGAAACTGTTCA. A hairpin-like oligonucleotide sequence derived from GPAM mRNA target sequences and an interfering RNA were synthesised by GenePharma Corporation (Shanghai, China). The oligonucleotide sequences for the pGPU6/GFP/Neo vector are shown in Table 1.
2.5.2 Construction of the pBI-CMV3-GPAM vector
The CDS sequence of GPAM with Not I and BamH I restriction sites was obtained using PCR. The pBI-CMV3 vector was linearised with Not I and BamH I restriction enzymes (New England Biolabs, Ipswich, MA, USA), and GPAM's CDS sequence was then cloned into the linearised pBI-CMV3 plasmid by T4 ligase (Thermo Scientific, Massachusetts, USA).
2.6 Mammary epithelial cell culture and transfection
The bMECs were proliferated for 24 h in six-well plates (Thermo Fisher Scientific, Massachusetts, USA), and the final concentration of cells was 1.2 × 10⁶ cells per well. Each well was supplemented with 10 % fetal bovine serum (FBS; Tian Hang, Zhe Jiang, China) and incubated at 37 ∘C in a 5 % CO2 incubator (Thermo Fisher Scientific, Massachusetts, USA).
For transfection, pBI-CMV3-GPAM and pGPU6-shRNA-GPAM vector DNA (3.0–3.5 µg) and 7.5 µL FuGENE HD transfection reagent (Promega, Madison, Wisconsin, USA) were diluted in 150 µL Opti-MEM serum-free media (Sigma-Aldrich, St. Louis, Missouri, USA) and were mixed lightly. The mixture was incubated at room temperature for 15 min and then added to the pores of each six-well plate. After 36 h of transfection, green fluorescent protein (GFP) expression was detected using a fluorescence microscope (NikonTE2000, Tokyo, Japan).
2.7 Detection and analysis of protein and mRNA levels of GPAM in bMECs
Whole RNA was extracted from bMECs with TRIzol reagent (Thermo Fisher Scientific, Massachusetts, USA). The PrimeScript™ RT reagent kit (TaKaRa, Bejing, China) was used for cDNA synthesis. Real-time qPCR (RT qPCR) was followed through with SYBR Green Real-Time PCR Master Mix (TaKaRa) utilising the specific primers shown in Table 1. In order to determine the mRNA level of GPAM, the threshold of the GPAM gene was normalised to an internal reference gene (β-actin) using the formula 2-CT as the relative expression rate; the relative expression amount of each group was then calculated.
For the extraction of total protein, RIPA lysis buffer (Takara) was used when cell confluence reached 90 %. The cells were incubated on ice for 5 min and then whirled for 5 min; this procedure was repeated five times. Finally, the lysate was removed by centrifugation at 4 ∘C with 15 000 × g for 10 min. Using SDS-PAGE (sodium dodecyl sulfate–polyacrylamide gel electrophoresis), total protein (40 µg per sample) was loaded, made up by vertical electrophoresis and transfer onto polyvinylidene fluoride or polyvinylidene difluoride (PVDF; 0.22 µm) membranes (Millipore, Massachusetts, USA). Western blotting was then performed using the following antibodies: anti-GPAM (Abcam, Cambridge, UK) and anti-β-actin (Abcam).
2.8 Determination of the TG content in bMECs
In serum-free DMEM/F12 medium, 1.2 × 10⁶ cells were inoculated into each well. At a total of 46 h of post-transfection, the cells were assembled at a concentration equal between control cells and positive. A triglyceride detection kit (Solarbio, Beijing, China) was utilised to evaluate the total TG content in bMECs of the GPAM gene that were silenced and overexpressed. At the same time, the optical density (OD) value was detected using a microplate reader (SpectraMax iD5, California, USA). The total protein concentration was then detected using an Enhanced BCA Protein Quantitation Assay Kit (KeyGEN BioTECH, Jiangsu, China).
2.9 SNPs detection in the GPAM gene and genotyping
DNA samples of 241 dairy cows were amplified by PCR. The PCR products were sequenced by Genewiz (Suzhou, China). The polymorphisms of the GPAM gene's key functional regions were identified by sequencing. The primers' digestion and sequences of each reaction system of SNP are given in Table 1.
2.10 Correlation analysis
The allelic and genotypic frequencies were worked out for the population of Chinese Holstein cows in this study. An analysis of the GPAM gene's genotypic effects was carried out using the GLM procedure in SPSS 13.0 for Windows. The fixed model was as follows: , where Yijkl is daily milk yield, peak milk yield or persistence of genotype j in the ith year and season, u is the observed values' least square mean, mj is the effective value of genotype j, si is the ith year and season's effective value, β is the somatic score's regression coefficient, x is somatic score and eijkl is the random residual effect (Fang et al., 2014).
3.1 The results of the pBI-CMV3-GPAM and pGPU6-shRNA-GPAM vector construction and transfection
Sequence analysis showed that the shRNA, which targeted the GPAM gene's oligonucleotide sequence, was cloned and constructed into the Bbs I and BamH I sites of the pGPU6/GFP/Neo vector. Moreover, sequence analysis showed that the DNA fragments, including CDS sequences of GPAM, that were obtained by PCR and pBI-CMV3 plasmid were selected as the vector to overexpress GPAM. The cells in the pGPU6-shRNA-GPAM group and the pBI-CMV3-GPAM group were observed under fluorescent microscopes beginning 24 h after transfection for the expression of GFP as an indicator of successful transfection (Fig. 1c-i, ii).
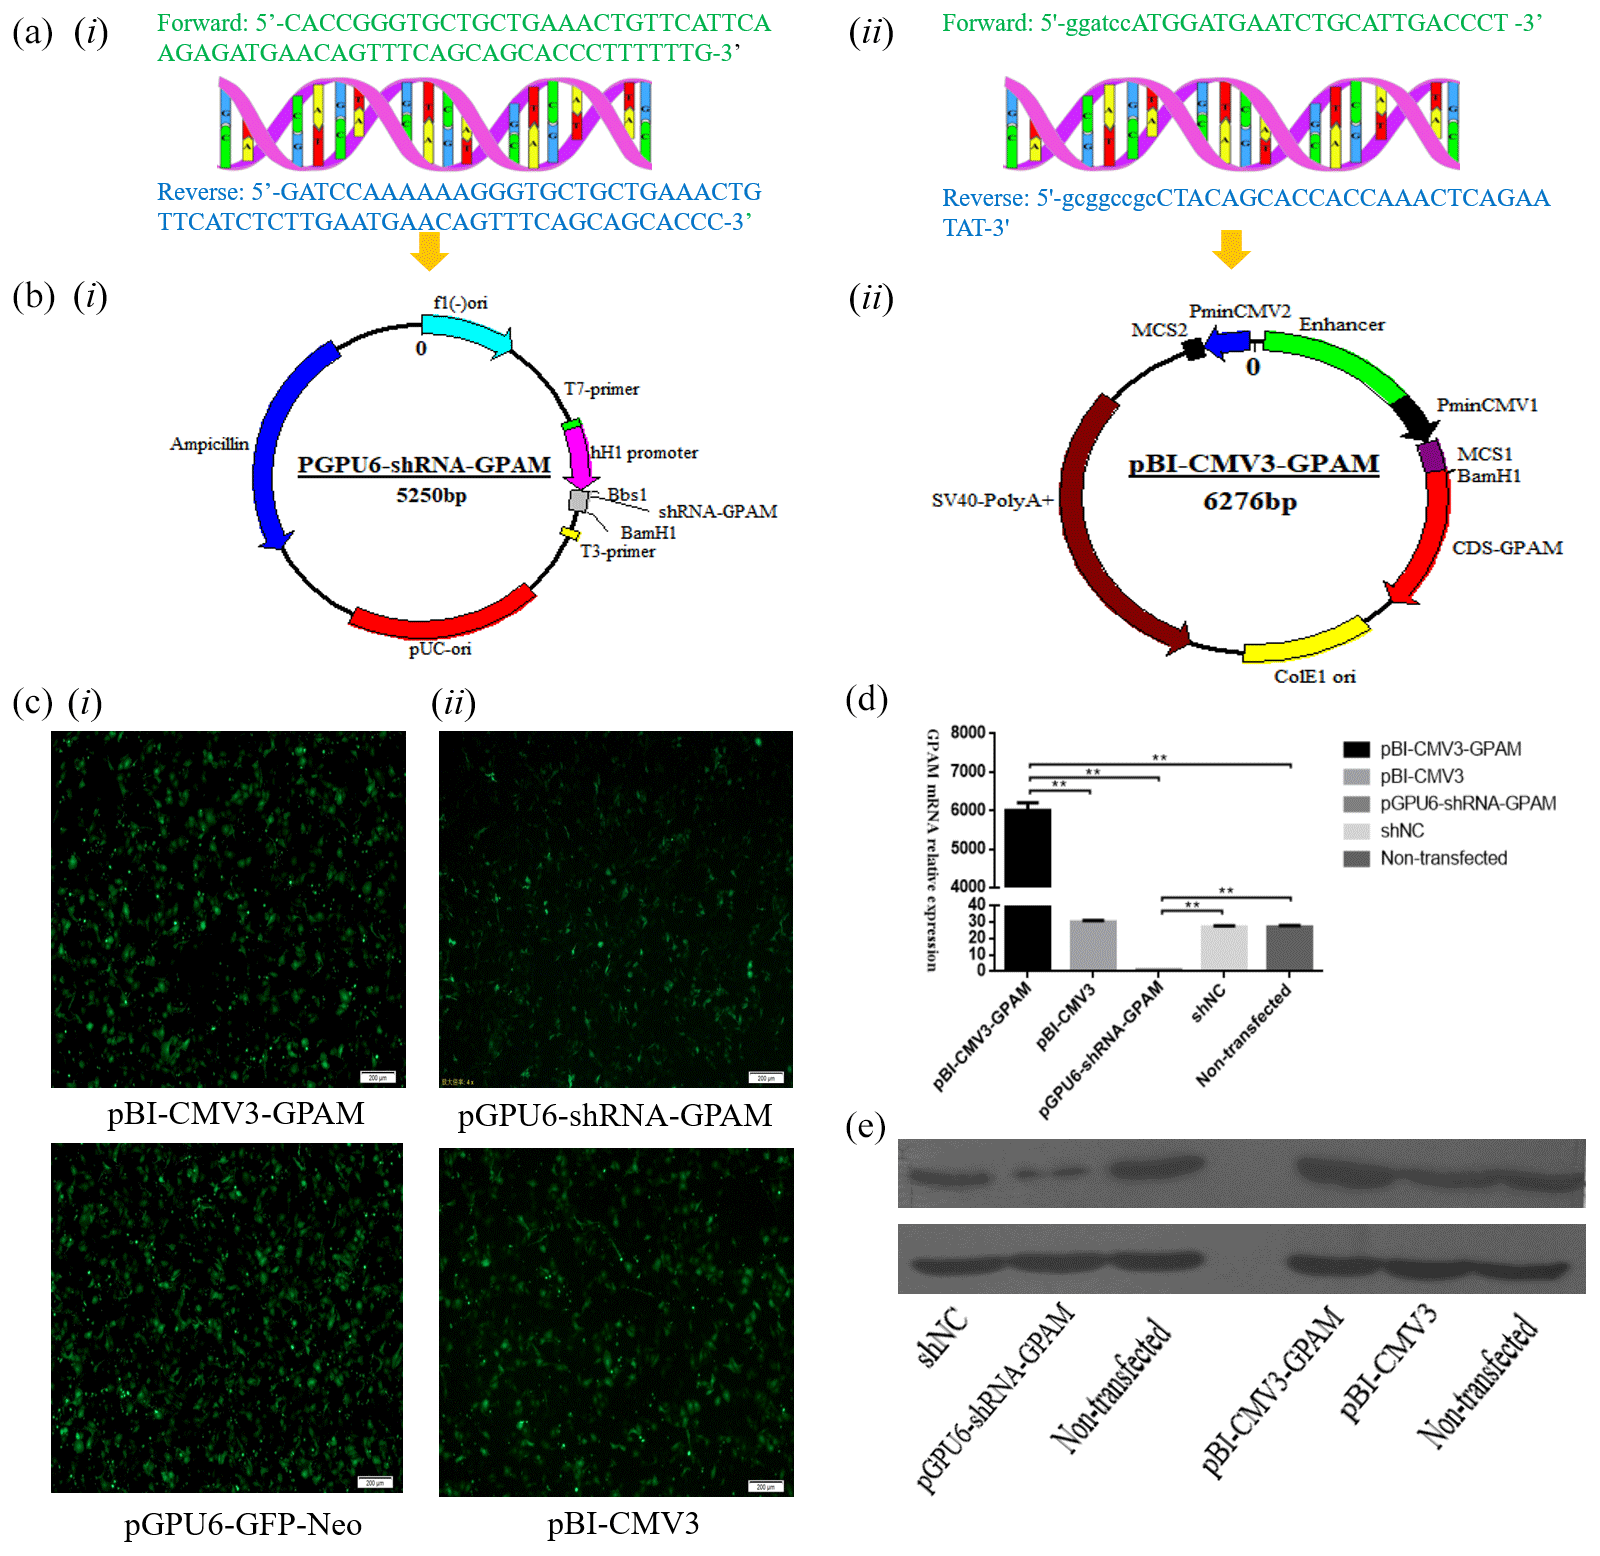
Figure 1The expression of the GPAM gene effect on the synthesis of triglyceride in bMECs. (a) The bovine GPAM gene's primer sequences: (i) the bovine GPAM gene's shRNA primer sequences; (ii) primer sequence of GPAM gene's CDS region. (b) Construction of the pBI-CMV3-GPAM and pGPU6-shRNA-GPAM vector: (i) the bovine GPAM RNAi vector; (ii) the bovine GPAM gene overexpression vector. (c) Green fluorescence's expression was observed under a fluorescence microscope. (d) GPAM mRNA expression levels in bMECs. (e) GPAM protein expression levels in bMECs.
3.2 The mRNA and protein expression levels of the GPAM gene in bMECs were overexpression and knockdown
The effect of GPAM was investigated through RNAi and overexpression of GPAM. The results of the analysis revealed that the expression levels of GPAM mRNA in the GPAM knockdown transfection group was substantially lower than that in the pGPU6-shRNA-NC group (Fig. 1d, p < 0.01), and the mRNA expression levels of GPAM in the pBI-CMV3-GPAM transfection group was considerably upregulated (Fig. 1d, p < 0.01).
Moreover, we also investigated the effects of GPAM-specific RNAi and overexpression on the mRNA expression of GPAM and on GPAM's protein levels. Western blotting results showed that the pGPU6-shRNA-GPAM transfected bMECs' protein expression was downregulated in comparison with that of the negative control group cells (Fig. 1e, p < 0.01), whereas the pBI-CMV3-GPAM transfected bMECs' protein expression was upregulated in relation to that of the control group cells (Fig. 1e, p < 0.01). These western blotting results were consistent with the RT-qPCR results, indicating that the RNAi and overexpression of GPAM affect both the protein and mRNA levels of GPAM.
3.3 GPAM gene expression increases the intracellular triglyceride content in bMECs
The effect of pBI-CMV3-GPAM and pGPU6-shRNA-GPAM transfection on the triglyceride levels in bMECs was assessed and showed a substantial decrease in the triglyceride levels in the bMECs of the RNA interference group (p < 0.05, Table 2). The TG content, in comparison, increased considerably in bMECs due to the overexpression of the GPAM gene, indicating that GPAM plays a cardinal role in TG synthesis in the lipid metabolism pathway of bMECs.
Table 2The TG and total protein contents of each transfected group in bMECs.
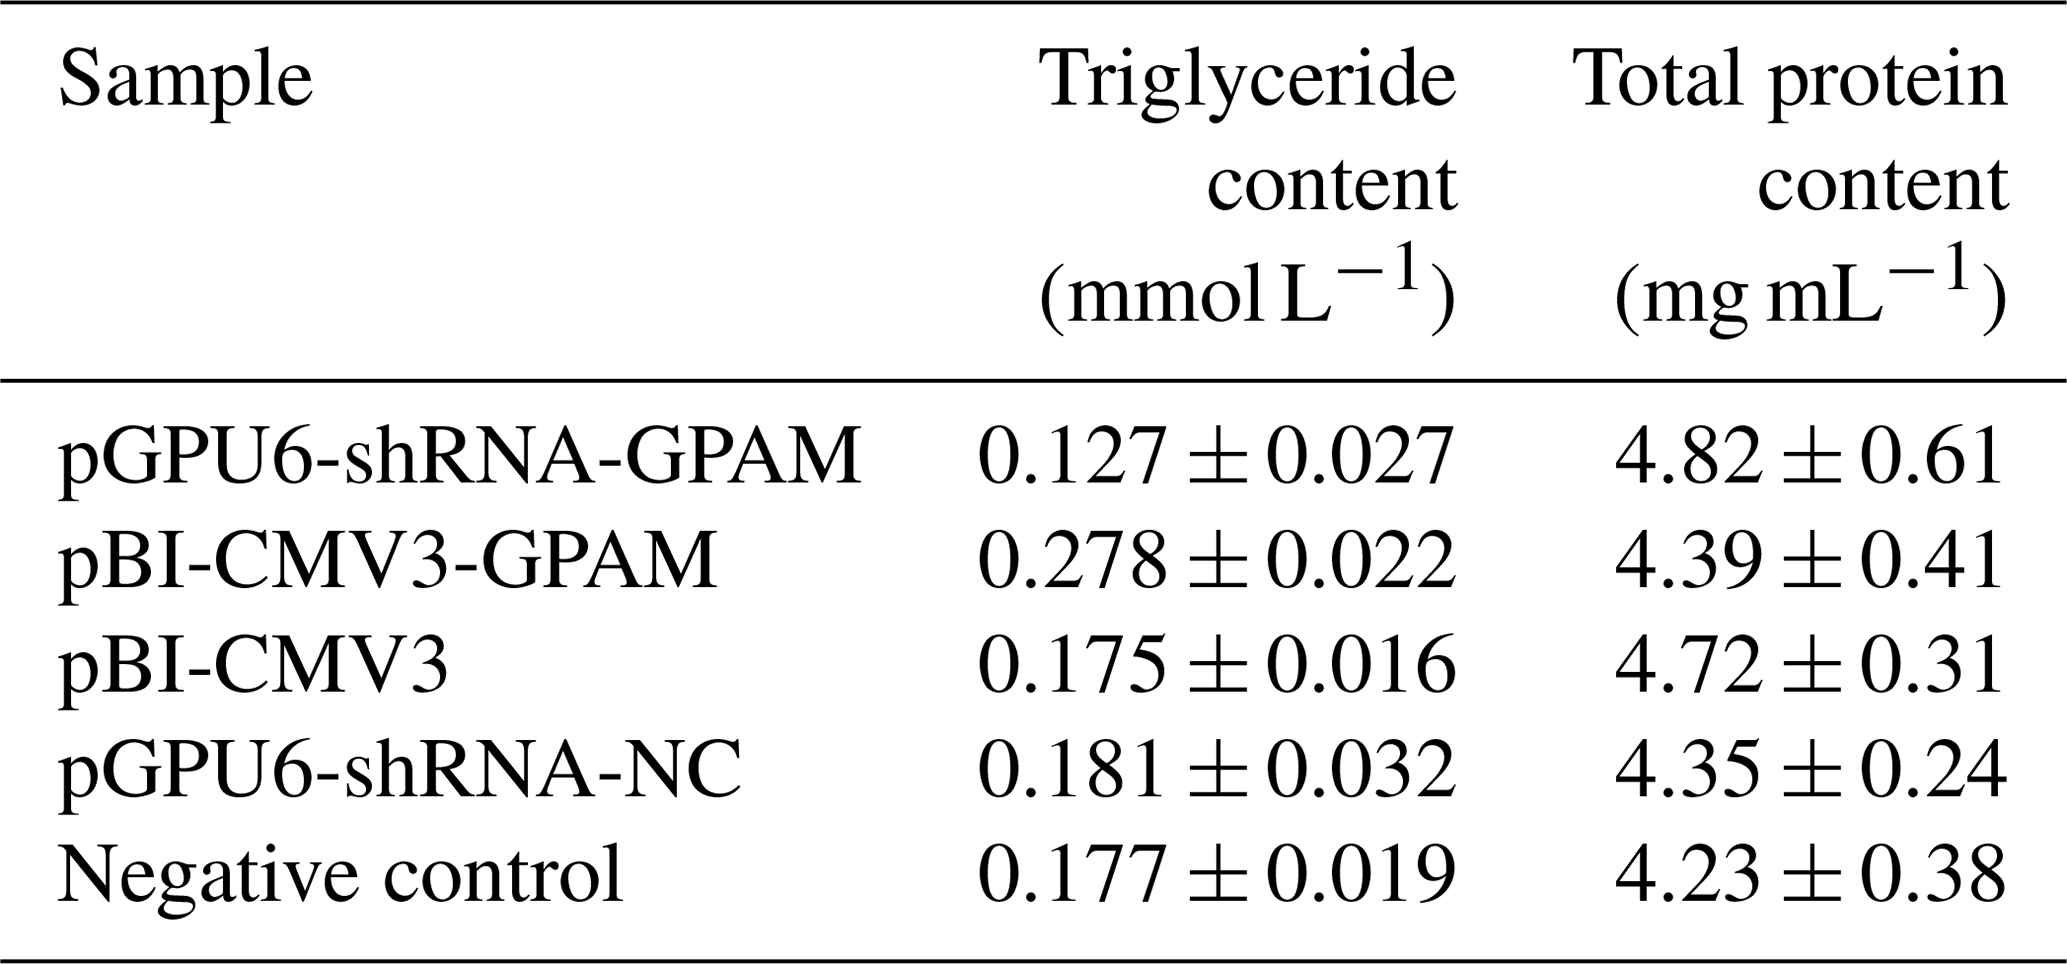
Note that values are expressed as the mean ± SE. pGPU6-shRNA-GPAM refers to cells transfected with the GPAM RNAi vector. pBI-CMV3-GPAM refers to cells transfected with the pBI-CMV3-GPAM vector. pGPU6-shRNA-NCC refers to cells transfected with the pGPU6-shRNA-NC vector. Negative Control refers to non-transfected cells.
3.4 Genetic diversity of SNPs in the GPAM gene in a Chinese Holstein cow population
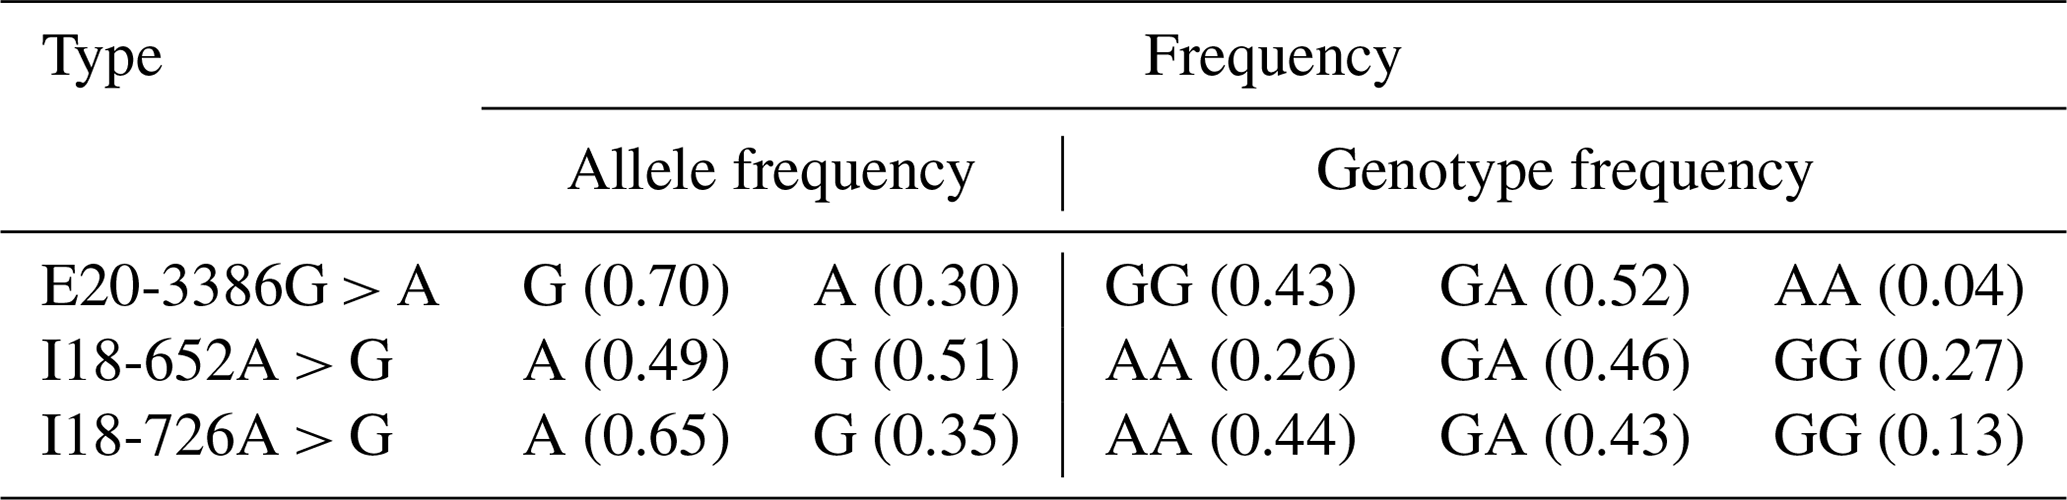
The PCR products were consistent and had good specificity with the target, which could be used for sequencing. Upon analysis of the sequencing result, a peak was obtained in the mutations of the three SNPs (E20-3386G > A, I18-652A > G and I18-726A > G; Fig. 2b). At location 3386 bp in the 20th exon, there was a G > A substitution that resulted in the replacement of arginine with histidine (Fig. 2b); there was also an A > G substitution at position 652 and 726 bp in the 18th intron. Allele A had a frequency of 0.26 and 0.44 at the I18-652 and I18-726 loci in the Holstein cow population respectively. At the E20-3386 polymorphism site, the dominant allele G had a frequency of 0.43 in the Chinese Holstein cows. The SNP's genotype distribution at E20-3386G > A, I18-652A > G and I18-726A > G in the studied cow population is shown in Table 3. The results showed that there were three polymorphisms in the intron and exon regions of the bovine GPAM gene.
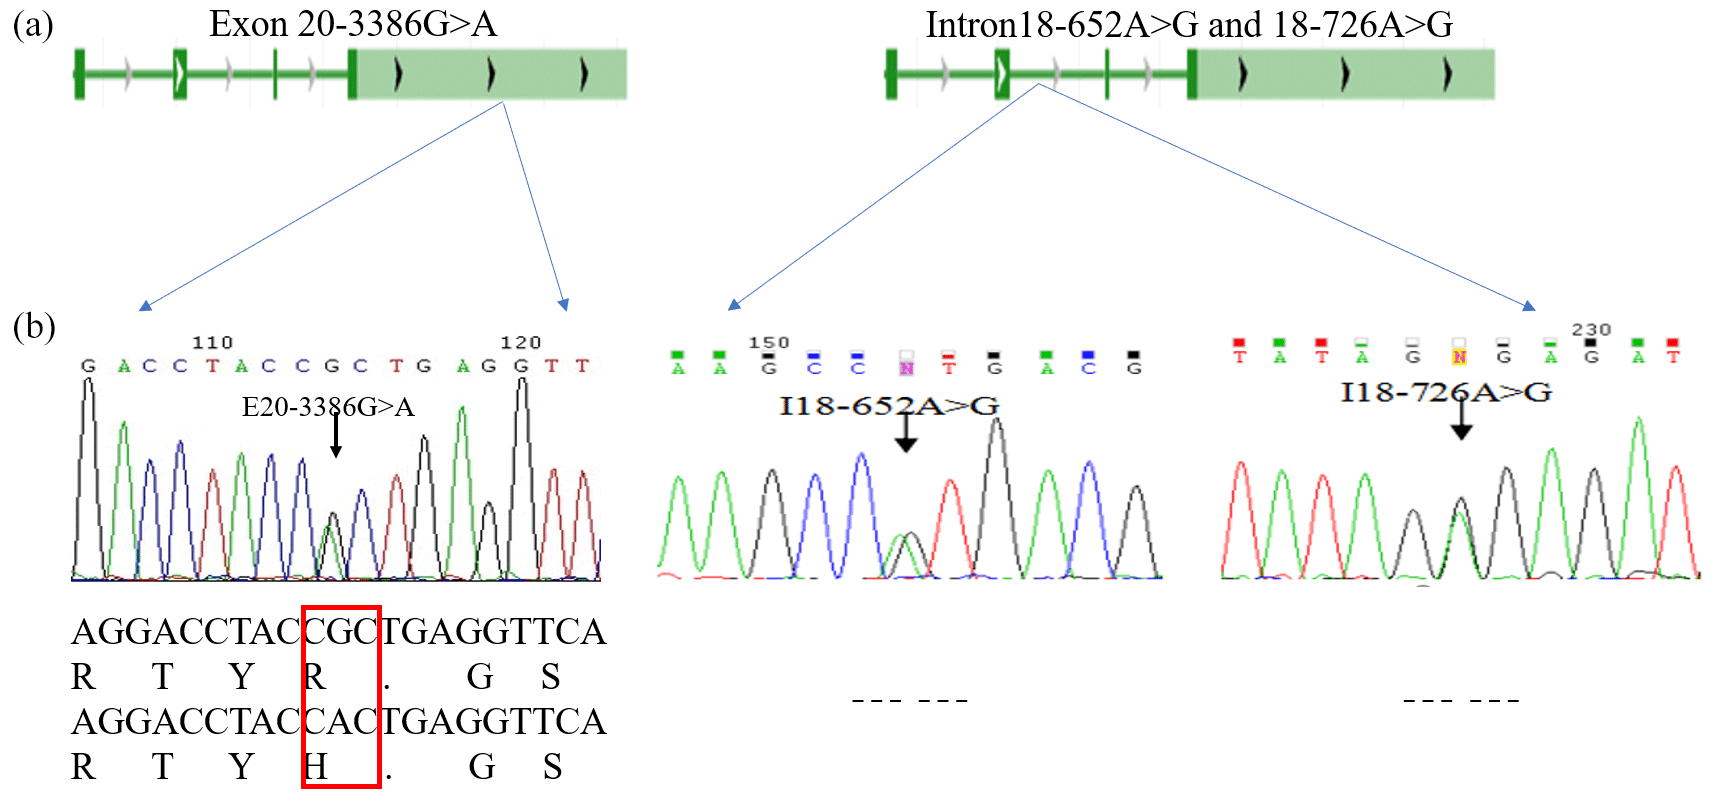
Figure 2Analysis and sequencing of SNPs in the GPAM gene. Panel (a) shows the determination and sequence analysis of SNPs in the GPAM gene's functional regions; panel (b) shows that there was a G to A substitution at position 3386 bp of the 20th exon in the GPAM gene that replaced arginine with histidine, and there was no alteration in amino acids at locations I18-726A > G and I18-652A > G.
3.5 Correlation analyses of GPAM polymorphisms with milk quality in China Holstein cows
The lactation traits of the Holstein cattle population include milk yield, milk fat percentage, milk protein percentage and somatic cell number. The mean value and standard error of each trait of the Holstein cattle population are shown in Table 4. The connections between GPAM gene polymorphisms and milk quality traits in Chinese Holstein cows were analysed. The results show that the three SNPs (E20-3386G > A, I18-652A > G and I18-726A > G) have substantial links with milk quality traits.
Table 4The number of records and the means and standard deviations for the Chinese Holstein dairy cattle milk traits involved in the association analyses.
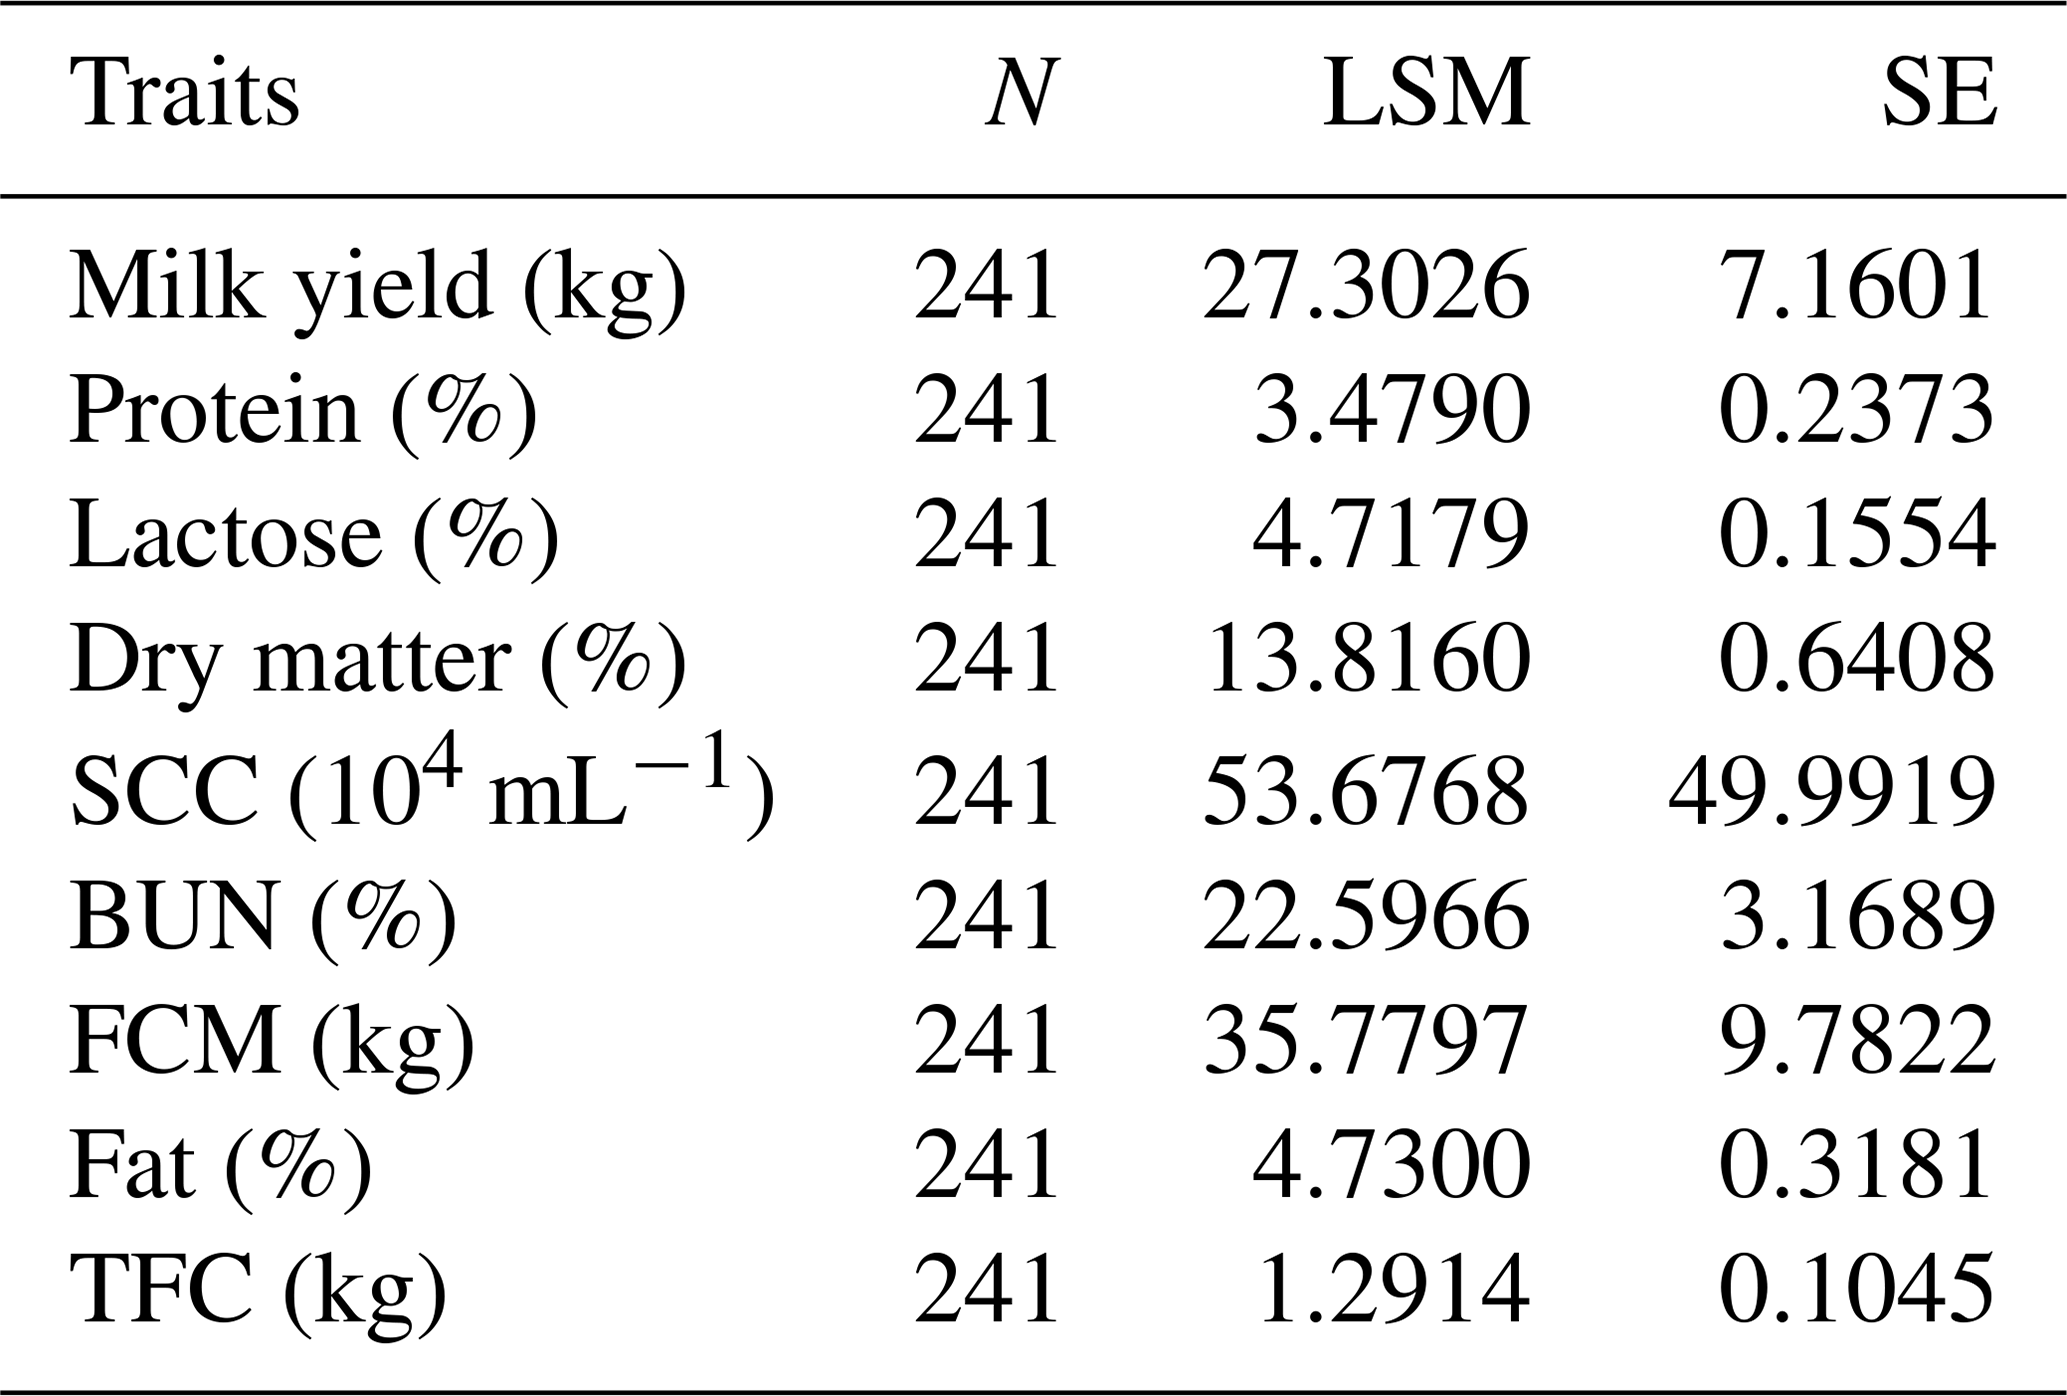
N refers to the number of samples, LSM is the least square mean, SE is the standard error, SCC is the somatic cell count, BUN is the urea nitrogen, FCM is the fat-corrected milk and TFC is the total fat content.
We found that the E20-3386G > A SNP of the GPAM gene was potentially correlated with fat, total fat content (TFC), protein and somatic cell count (SCC) (p < 0.05; Table 5). Individuals with the GA genotype possessed higher milk fat (5.03 ± 0.04) and TFC (1.38 ± 0.04 kg) than homozygotes with AA and GG in the studied population of Chinese Holstein cows (p < 0.05). Individuals cows with the GA genotype also had higher milk protein rate (3.54 ± 0.03) than AA genotype individuals (3.43 ± 0.08), and individuals with the AA genotype had a higher somatic cell count (110.92 ± 35.14) than GG genotype individuals (40.75 ± 6.11) and GA genotype individuals (58.18 ± 8.30). The I18-652A > G SNP was correlated with fat, protein, dry matter and somatic cell count (p < 0.05; Table 5). Individuals with the AA genotype had higher milk fat (4.89 ± 0.02) and TFC (1.40 ± 0.02 kg) than GA and GG homozygotes (p < 0.05). In terms of milk protein rate, values from GG genotype individuals (3.54 ± 0.03) and GA genotype individuals (3.48 ± 0.02) were significantly higher than that of AA genotype individuals (3.41 ± 0.03). In the context of dry matter content, values from GG genotype individuals (13.96 ± 0.09) were significantly higher than that of GA genotype individuals. The number of somatic cells in the GG genotype (56.78 ± 6.55) and GA genotype (60.37 ± 5.16) was significantly higher than that for the AA genotype (38.52 ± 4.04). The I18-726A > G SNP of the GPAM gene was significantly correlated with milk protein rate, milk yield, dry matter and somatic cell count (p < 0.05; Table 5), and this SNP may also have a significant correlation with the milk fat rate (p = 0.051). In terms of milk yield, the AA genotype (28.51 ± 0.71) was significantly higher than the GA genotype (26.22 ± 0.70) and the GG genotype (26.86 ± 1.17). The milk protein rate in the GA genotype (3.52 ± 0.02) was significantly higher than that for the AA genotype (3.42 ± 0.02). The dry matter content in the GG genotype (13.99 ± 0.11) was significantly higher than that of the AA genotype (13.72 ± 0.06). With respect to the somatic cell count, GG genotype individuals showed significantly higher values (66.31 ± 11.53) than AA genotype individuals (46.27 ± 4.00). Thus, the polymorphisms in GPAM could alter the milk quality traits attributed to the presence of a type of nucleotide.
Table 5The association of the three SNPs in the GPAM gene with milk quality traits in Chinese Holstein dairy cattle.
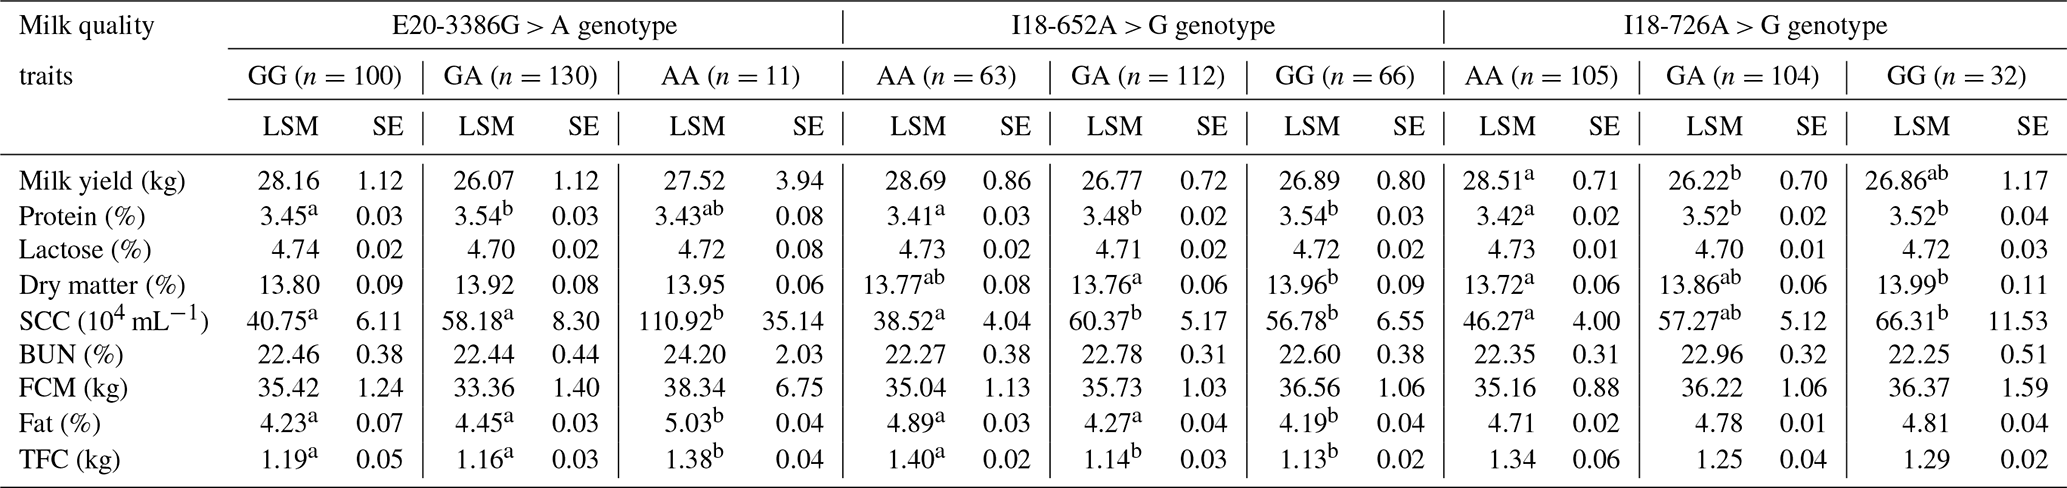
Note that significant differences (p < 0.05) among the mean values of the traits are shown using different lowercase letters (a, b) in the same column. SE refers to standard error, LSM is the least square mean, FCM is the fat-corrected
milk, SCC is the somatic cell count, BUN is urea nitrogen and TFC is the total fat content.
In the animal industry, fat traits are one of the most important characteristic with respect to commercial value. Many factors affect fat traits, including nutrition, management and genetics (Keogh et al., 2015; Sakamoto et al., 2014). In animal breeding and genetics, a number of techniques have been introduced for the analysis of molecular markers, including gene localisation, gene cloning, germplasm resource assessment, genetic mapping, the use of heterosis and molecular marker-assisted selection (Beuzen et al., 2000; de Los Campos et al., 2013; Thompson et al., 2015). The GPAM gene depends on physiological condition including nutrition and hormones (Harada et al., 2007; Onorato et al., 2005). The GPAM gene plays an important role in phospholipid and triglyceride synthesis (Lewin et al., 2004, 2005; Turnbull et al., 2001). Previous work on the GPAM gene has mostly focused on the function of the gene, whereas less research has been undertaken on polymorphisms of the GPAM gene. The expression levels of the GPAM gene were found to be increased during lactation in bovine (Bionaz et al., 2008), and the function of the GPAM gene in bovine is the same as mouse hepatic tissue (Wendel et al., 2013). The GPAM is located on BTA26, and the SNP of GPAM is linked with the fatty acid concentration (Stoop et al., 2009). To verify the role of the GPAM gene in triglyceride synthesis, experiments have been carried out on mice; this research suggested that the GPAM gene has various effects after knockout, including lighter gonadal fat pads, reduced weight, reduced plasma triglyceride levels and decreased liver triglyceride content. Thus, these results strongly suggest that the GPAM gene has a vital role in the synthesis of triglycerides in liver and plays a considerable role in the regulation of the fatty acid components of glycerophosphatides (Dawson et al., 2006; Jung et al., 2013). This result is consistent with our previous work (Yu et al., 2017), which found that the GPAM gene influences the TG content in bovine fetal fibroblasts (BFFs), the knockdown of the GPAM gene could cause the triglyceride in BFFs to significantly decrease and the overexpression of GPAM gene significantly increased the TG level compared with the BFF control group. This gives us more strong evidence that the GPAM gene has a role in fat metabolism and triglyceride synthesis (Yu et al., 2017).
As the relation between the GPAM gene and bovine lipid metabolism was confirmed in BFFs, we examine the knockdown and overexpression of GPAM in bMECs in the present study. In bMECs, the knockdown of the GPAM gene level of triglyceride was significantly decreased compared with the control group, whereas the overexpression of the GPAM gene significantly increased the TG level compared with the bMEC control group.
Moreover, previous work on mice has revealed that animals lacking the GPAM gene were much lighter, had a lower fat content in their gonads and had a 40 % lower TG content in their livers compared with wild mice (Wendel et al., 2013). In this study, the results showed that the TG content increased substantially with the overexpression of GPAM in bMECs; however when GPAM was knocked down in bMECs, the TG content decreased significantly
Three novel SNPs of the GPAM gene (E20-3386G > A, I18-652A > G and I18-726A > G) were also found to be significantly correlated with fat, the total fat content (TFC), protein, milk yield, dry matter and somatic cell count (SCC) in this study. Our data suggest that GPAM polymorphism may be one of the significant genetic factors affecting milk quality; therefore, it may provide a competent marker for milk and meat quality traits in dairy cattle breeding and production. It could also be used to develop or improve the dual purpose of cattle breeds.
In summary, TG synthesis can be promoted by the GPAM gene in the fat metabolism pathway of bMECs. Furthermore, milk quality can be significantly affected by mutations in the GPAM gene's functional domain. GPAM plays a pivotal role in the regulation of phospholipid levels and cellular triglyceride, and its mutations could serve as a competent molecular marker that could be utilised for marker-assisted selection.
The data sets are available upon request from the corresponding author.
ZZ, RY and HY were responsible for carrying out the experiment (design) and data analysis as well as writing the first draft of the paper. HS and ZB undertook the animal experiments. LX and AI helped revise the paper. HY and YZ assisted with the analysis and data collection. XF participated in the cell transfection.
The authors declare that they have no conflict of interest.
The authors are grateful to Heilongjiang Holstein dairy farm for providing samples and data.
This research has been supported by the National Natural Science Foundation of China (grant nos. 31772562, 31802034, 31672389 and 31972993), the Jilin Scientific and Technological Development Program (grant no. 20180101275JC) and the National Major Special Project on New Varieties Cultivation for Transgenic Organisms (grant no. 2016ZX08009003-006).
This paper was edited by Antke-Elsabe Freifrau von Tiele-Winckler and reviewed by two anonymous referees.
Bell, R. M. and Coleman, R. A.: Enzymes of glycerolipid synthesis in eukaryotes, Annu. Rev. Biochem., 49, 459–487, https://doi.org/10.1146/annurev.bi.49.070180.002331, 1980.
Beuzen, N. D., Stear, M. J., and Chang, K. C.: Molecular markers and their use in animal breeding, Vet. J., 160, 42–52, https://doi.org/10.1053/tvjl.2000.0468, 2000.
Bionaz, M., Baumrucker, C. R., Shirk, E., Vanden Heuvel, J. P., Block, E., and Varga, G. A.: Characterization of Madin-Darby bovine kidney cell line for peroxisome proliferator-activated receptors: temporal response and sensitivity to fatty acids, J. Dairy Sci., 91, 2808–2813, https://doi.org/10.3168/jds.2007-0789, 2008.
Coleman, R. A. and Haynes, E. B.: Selective changes in microsomal enzymes of triacylglycerol and phosphatidylcholine synthesis in fetal and postnatal rat liver. Induction of microsomal sn-glycerol 3-phosphate and dihydroxyacetonephosphate acyltransferase activities, J. Biol. Chem., 258, 450–456, 1983.
Coleman, R. A., Reed, B. C., Mackall, J. C., Student, A. K., Lane, M. D., and Bell, R. M.: Selective changes in microsomal enzymes of triacylglycerol phosphatidylcholine, and phosphatidylethanolamine biosynthesis during differentiation of 3T3-L1 preadipocytes, J. Biol. Chem., 253, 7256–7261, 1978.
Dawson, P. A., Gardiner, B., Grimmond, S., and Markovich, D.: Transcriptional profile reveals altered hepatic lipid and cholesterol metabolism in hyposulfatemic NaS1 null mice, Physiol. Genomics, 26, 116–124, https://doi.org/10.1152/physiolgenomics.00300.2005, 2006.
De Los Campos, G., Hickey, J. M., Pong-Wong, R., Daetwyler, H. D., and Calus, M. P.: Whole-genome regression and prediction methods applied to plant and animal breeding, Genetics, 193, 327–345, https://doi.org/10.1534/genetics.112.143313, 2013.
Fang, X. B., Zhang, L. P., Yu, X. Z., Li, J. Y., Lu, C. Y., Zhao, Z. H., and Yang, R. J.: Association of HSL gene E1-c.276C > T and E8-c.51C > T mutation with economical traits of Chinese Simmental cattle, Mol. Biol. Rep., 41, 105–112, https://doi.org/10.1007/s11033-013-2842-6, 2014.
Gerosa, S. and Skoet, J.: Milk availability: trends in production and demand and medium-term outlook, ESA Working Paper, 12-01, https://doi.org/10.22004/ag.econ.289000, 2012.
Hammond, L. E., Gallagher, P. A., Wang, S., Hiller, S., Kluckman, K. D., Posey-Marcos, E. L., Maeda, N., and Coleman, R. A.: Mitochondrial glycerol-3-phosphate acyltransferase-deficient mice have reduced weight and liver triacylglycerol content and altered glycerolipid fatty acid composition, Mol. Cell. Biol., 22, 8204–8214, 2002.
Harada, N., Hara, S., Yoshida, M., Zenitani, T., Mawatari, K., Nakano, M., Takahashi, A., Hosaka, T., Yoshimoto, K., and Nakaya, Y.: Molecular cloning of a murine glycerol-3-phosphate acyltransferase-like protein 1 (xGPAT1), Mol. Cell. Biochem., 297, 41–51, https://doi.org/10.1007/s11010-006-9321-5, 2007.
Holub, B. J. and Kuksis, A.: Further evidence for the interconversion of monophosphoinositides in vivo, Lipids, 7, 78–80, https://doi.org/10.1007/BF02531275, 1972.
Jiang, P., Xia, L., Jin, Z., Ali, S., Wang, M., Li, X., Yang, R., Fang, X., and Zhao, Z.: New function of the CD44 gene: Lipid metabolism regulation in bovine mammary epithelial cells, J. Dairy Sci., 103, 6661–6671, https://doi.org/10.3168/jds.2019-17415, 2020.
Jung, C. H., Cho, I., Ahn, J., Jeon, T. I., and Ha, T. Y.: Quercetin reduces high-fat diet-induced fat accumulation in the liver by regulating lipid metabolism genes, Phytother. Res., 27, 139–143, https://doi.org/10.1002/ptr.4687, 2013.
Keogh, K., Waters, S. M., Kelly, A. K., and Kenny, D. A.: Feed restriction and subsequent realimentation in Holstein Friesian bulls: I. Effect on animal performance; muscle, fat, and linear body measurements; and slaughter characteristics, J. Anim. Sci., 93, 3578–3589, https://doi.org/10.2527/jas.2014-8470, 2015.
Lewin, T. M., Granger, D. A., Kim, J. H., and Coleman, R. A.: Regulation of mitochondrial sn-glycerol-3-phosphate acyltransferase activity: response to feeding status is unique in various rat tissues and is discordant with protein expression, Arch. Biochem. Biophys., 396, 119–127, https://doi.org/10.1006/abbi.2001.2604, 2001.
Lewin, T. M., Schwerbrock, N. M., Lee, D. P., and Coleman, R. A.: Identification of a new glycerol-3-phosphate acyltransferase isoenzyme, mtGPAT2, in mitochondria, J. Biol. Chem., 279, 13488–13495, https://doi.org/10.1074/jbc.M314032200, 2004.
Lewin, T. M., Wang, S., Nagle, C. A., Van Horn, C. G., and Coleman, R. A.: Mitochondrial glycerol-3-phosphate acyltransferase-1 directs the metabolic fate of exogenous fatty acids in hepatocytes, Am. J. Physiol.-Endoc. M., 288, E835–844, https://doi.org/10.1152/ajpendo.00300.2004, 2005.
Onorato, T. M., Chakraborty, S., and Haldar, D.: Phosphorylation of rat liver mitochondrial glycerol-3-phosphate acyltransferase by casein kinase 2, J. Biol. Chem., 280, 19527–19534, https://doi.org/10.1074/jbc.M410422200, 2005.
Roy, R., Gautier, M., Hayes, H., Laurent, P., Zaragoza, P., Eggen, A., and Rodellar, C.: Assignment of mitochondrial glycerol-3-phosphate acyltransferase (GPAM) gene to bovine chromosome 26 (26q22) by in situ hybridization and confirmation by somatic cell hybrid mapping, Cytogenet. Genome Res., 97, 276F, https://doi.org/10.1159/000066602, 2002.
Roy, R., Ordovas, L., Taourit, S., Zaragoza, P., Eggen, A., and Rodellar, C.: Genomic structure and an alternative transcript of bovine mitochondrial glycerol-3-phosphate acyltransferase gene (GPAM), Cytogenet. Genome Res., 112, 82–89, https://doi.org/10.1159/000087517, 2006.
Sakamoto, L. S., Mercadante, M. E., Bonilha, S. F., Branco, R. H., Bonilha, E. F., and Magnani, E.: Prediction of retail beef yield and fat content from live animal and carcass measurements in Nellore cattle, J. Anim. Sci., 92, 5230–5238, https://doi.org/10.2527/jas.2012-6065, 2014.
Salter, A. M.: Improving the sustainability of global meat and milk production, P. Nutr. Soc., 76, 22–27, https://doi.org/10.1017/S0029665116000276, 2017.
Shen, B., Zhang, L., Lian, C., Lu, C., Zhang, Y., Pan, Q., Yang, R., and Zhao, Z.: Deep Sequencing and Screening of Differentially Expressed MicroRNAs Related to Milk Fat Metabolism in Bovine Primary Mammary Epithelial Cells, Int. J. Mol. Sci., 17, 200, https://doi.org/10.3390/ijms17020200, 2016.
Stoop, W. M., Bovenhuis, H., Heck, J. M., and van Arendonk, J. A.: Effect of lactation stage and energy status on milk fat composition of Holstein-Friesian cows, J. Dairy Sci., 92, 1469–1478, https://doi.org/10.3168/jds.2008-1468, 2009.
Thompson, N. M., DeVuyst, E. A., Brorsen, B. W., and Lusk, J. L.: Yield and quality grade outcomes as affected by molecular breeding values for commercial beef cattle, J. Anim. Sci., 93, 2045–2055, https://doi.org/10.2527/jas.2014-8511, 2015.
Turnbull, A. P., Rafferty, J. B., Sedelnikova, S. E., Slabas, A. R., Schierer, T. P., Kroon, J. T., Simon, J. W., Fawcett, T., Nishida, I., Murata, N., and Rice, D. W.: Analysis of the structure, substrate specificity, and mechanism of squash glycerol-3-phosphate (1)-acyltransferase, Structure, 9, 347–353, 2001.
Vikram, S. and Jancy, G.: Factors affecting raw milk quality in dairy value chain in Rajasthan (India): A comprehensive study, Indian J. Anim. Sci., 86, 1204–1209, 2016.
Wendel, A. A., Cooper, D. E., Ilkayeva, O. R., Muoio, D. M., and Coleman, R. A.: Glycerol-3-phosphate acyltransferase (GPAT)-1, but not GPAT4, incorporates newly synthesized fatty acids into triacylglycerol and diminishes fatty acid oxidation, J. Biol. Chem., 288, 27299–27306, https://doi.org/10.1074/jbc.M113.485219, 2013.
Yu, H., Zhao, Z., Yu, X., Li, J., Lu, C., and Yang, R.: Bovine lipid metabolism related gene GPAM: Molecular characterization, function identification, and association analysis with fat deposition traits, Gene, 609, 9–18, https://doi.org/10.1016/j.gene.2017.01.031, 2017.