
the Creative Commons Attribution 4.0 License.
the Creative Commons Attribution 4.0 License.
 | 25 Mar 2019
Identification of potential genomic regions and candidate genes for egg albumen quality by a genome-wide association study
Liang Qu
Manman Shen
Jun Guo
Xingguo Wang
Taocun Dou
Yuping Hu
Yongfeng Li
Meng Ma
Kehua Wang
Honglin Liu
Albumen quality is a leading economic trait in the chicken industry. Major studies have paid attention to genetic architecture underlying albumen quality. However, the putative quantitative trait locus (QTL) for this trait is still unclear. In this genome-wide association study, we used an F2 resource population to study longitudinal albumen quality. Seven single-nucleotide polymorphism (SNP) loci were found to be significantly () related to albumen quality by univariate analysis, while 11 SNPs were significantly () associated with albumen quality by multivariate analysis. A QTL on GGA4 had a pervasive function on albumen quality, including a SNP at the missense of NCAPG, and a SNP at the intergenic region of FGFPB1. It was further found that the putative QTLs at GGA1, GGA2, and GGA7 had the strongest effects on albumen height (AH) at 32 weeks, Haugh units (HU) at 44 weeks, and AH at 55 weeks. Moreover, novel SNPs on GGA5 and GGA3 were associated with AH and HU at 32, 44, and 48 weeks of age. These results confirmed the regions for egg weight that were detected in a previous study and were similar with QTL for albumen quality. These results showed that GGA4 had the strongest effect on albumen quality. Only a few significant loci were detected for most characteristics probably reflecting the attributes of a pleiotropic gene and a minor-polygene in quantitative traits.
- Article
(1489 KB) - Full-text XML
-
Supplement
(2062 KB) - BibTeX
- EndNote


Chicken eggs are one of the world's perfect table foods. Egg quality comprises external and internal quality, and can be defined by the eggshell, albumen, and yolk quality, and special emphasis on the importance of albumen quality, which is the major component (accounting for ∼60 %) of the whole egg (Campbell et al., 2003). From an exterior view, good albumen quality should keep the yolk in the center of the egg (Li-Chan and Kim, 2008) and is a very important parameter to indicate egg freshness. According to the interior structures of an egg, albumen contains many functionally important proteins and is a good protein food with complete amino acid composition (Abeyrathne et al., 2013). The thicker the albumen height, the grater the foaming, emulsifying, and gelling properties, and the proteome composition would be better, which is meaningful in the food industry (Sun et al., 2017). Thus, improving the egg albumen quality is the current focus of breeding purposes. At present, the most widely used criterion of albumen quality are the albumen height (AH) and Haugh unit (HU) (Haugh, 1937).
Egg albumen quality is affected by several factors including strain or breed, age, nutrition, storage, and disease (Roberts, 2004). The most important factor is the strain or breed, and studies have shown that different strains of hen vary significantly in albumen quality. The heritability estimates of AH were reported as moderate from 0.29 to 0.51 (Honkatukia et al., 2013), so albumen quality could be improved by genetic selection (Scott and Silversides, 2000).
Albumen quality decreases with the aging process, and previous reports focused on the genetics of albumen quality and are based on one time point, especially on week 40. Many of the quantitative trait loci (QTLs) detected are related to albumen quality, Tuiskula-Haavisto et al. (2002) identified regions located on chromosome 2 that affected the Haugh unit. The QTL located on chromosomes 7 and Z are associated with albumen quality at 40 weeks old, while a region located on chromosomes 4 and 26, detected by Honkatukia et al. (2013), could explain 2 %–4 % of phenotypic variance. Far less attention has been paid to longitudinal albumen quality, although it is an age-dependent complex trait (Honkatukia et al., 2005). Wolc et al. (2014) reported that the AH of brown layer hens was affected by different QTL regions at different ages. Consequently, it is necessary to study longitudinal albumen quality.
A remarkable range of discoveries from genome-wide association studies (GWASs) have been made in the past decade (Visscher et al., 2017), both in human and animals. GWAS results have been shown to be useful for prediction and selection for phenotypic traits by a customized gene chip. In the present study, we conducted GWAS analysis on the dynamic albumen quality at 11 time points using a 600 K high-density SNP array in an F2 resource population. The main goals of our work were to dissect the genomic loci and genes that contribute to the albumen quality and lay a foundation for future QTL detection of albumen traits in chickens.
2.1 Population and trait collection
Our experiment was carried out in the Jiangsu Institute of Poultry Science, Yangzhou, China. Standard conditions were maintained throughout and a daily cycle of 16 h light and 8 h dark. A diet corresponding to National Research Council requirements was provided to laying hens, which were fed and watered ad libitum. White Leghorns (WL) and Dongxiang Blue-Shelled (DX) chickens, a Chinese indigenous breed, were crossed to generate the F0 population. Six DX males were mated with 80 WL females and 6 WL males were mated with 133 DX females to generate F1 populations of 552 and 1029 chicks, respectively. An F2 resource population of 1534 chicks was generated from WL/DX (25 males, 407 females) and DX/WL (24 males, 235 females) in a single hatch originating from 49 half-sib and 590 full-sib F1 population. More details on the source and housing in the current experiment are described in previous reports (Yuan et al., 2015; Li et al., 2015; Yi et al., 2015; Sun et al., 2015; Shen et al., 2016).
Albumen quality, including AH and HU, was measured in eggs of the first lay from each of the hens and then in eggs every 4 weeks from 32 to 60 weeks of age, and 6 weeks from 60 to 72 weeks of age. Fresh eggs were collected within 1 week. Two eggs per hen were used for analysis and three eggs when hens first start laying. Then the traits were evaluated with an EA-01 egg analyzer (ORKA Food Technology Ltd, Ramat Hasharon, Israel). The device measures HU by the method of Haugh (1937).
Data on descriptive statistics and correlation analysis were calculated with the R v3.0.3 project. The “rntransform” function in the GenABEL package (Aulchenko et al., 2007) of R v3.0.3 was used for the rank-based inverse normal transformations of trait deviations.
2.2 Genotyping and quality control
Nucleic acids were extracted by phenol / chloroform from 1534 blood samples collected from venipuncture. The genotyping data were from a 600 K Affymetrix Axiom Chicken Genotyping Array (Affymetrix, Inc. Santa Clara, CA, USA). The Axiom GT1 algorithm in Affymetrix Power Tools v1.16.0 (APT) software was used for genotype calling and quality control (QC). Sequences with a dish quality control (DQC) ≤0.82 and call rate ≤97 % were excluded from the subsequent analyses. Then, 1534 individuals and 532 299 SNPs remained valid after the application of APT for QC. To enhance the quality of the detection, further QC was carried out using the PLINK v1.90 program (Purcell et al., 2007), with missing rate minor allele frequency (MAF) <5 % and Hardy–Weinberg equilibrium (HWE) . We imputed the sporadic missing genotypes by using the BEAGLE v4.0 package (Browning and Browning, 2009); SNPs were retained only if the imputation quality score was R2>0.5. Finally, a total of 1512 samples and 435 867 SNPs were used in subsequent analysis. Detailed information on the quality control has been described in previous papers (Yuan et al., 2015; Yi et al., 2015; Sun et al., 2015; Shen et al., 2016).
2.3 Genome-wide association analysis
Principal component analysis (PCA) was conducted in the PLINK package to prevent spurious associations that can result from hidden population stratification or cryptic relatedness. Thresholds to determine significant or suggestive genome-wide associations were determined by the “simpleM” method (Gao et al., 2010) with correction for the number of multiple tests. After Bonferroni adjustment, we obtained 59 308 independent results. Hence the significance levels for genome-wide significant and suggestive values were obtained as explained in a previous paper (Shen et al., 2016), which were (0.05∕59 308) and (1.00∕59 308), respectively.
The albumen quality at each point was first analyzed using a univariate linear mixed model. After the quality control of genotype data, the univariate analysis was implemented using the GEMMA v0.94 package (Zhou and Stephens, 2014). The significance level was calculated from the P value derived from the Wald test. The univariate linear mixed model is as follows:
where y is an n×1 vector of phenotypic values for n individuals; W is an n×c matrix of covariates (fixed effects, top five principal components (PCs) in our study including a column of ones); α is a c×1 vector of the corresponding coefficients including the intercept; X is an n×1 vector of the genotypes of the SNP marker; β is the substitution effects of marker; Z is an n×n relatedness matrix of random effects; μ is an n×1 vector of random effects; and ε is an n×1 vector of errors.
When the SNPs that had suggestive associations with a phenotype at the time points in univariate analysis were included in the subsequent multivariate analysis to avoid computational issues when considering all points simultaneously, the formula is given as follows:
where Y∗ is an n×d matrix of d phenotypes for n samples, W is an n×c matrix of covariates (fixed covariates, top five PCs in our study including a column of ones); α∗ is a c×d matrix of corresponding coefficients including the intercept; X is an n vector of marker genotypes; and β∗ is a d vector of the substitution effects of marker. Z is an n×d relatedness matrix of random effects, , Zd are the incidence matrices relating phenotype of the dth trait to random effects; μ∗ is an n by d matrix of random effects; ε∗ is an n by d matrix of errors; I is the identity matrix.
The Manhattan and Q–Q plots were created by the “gap” and “qqman” packages (Zhao, 2007) in the R project. The GenABEL package (Aulchenko et al., 2007) in the R project was used to calculate the genomic inflation factor resulting from the estimate of false positive signals.
2.4 Linkage disequilibrium analysis
We used Haploview v4.2 software (Barrett et al., 2005) to analyze linkage disequilibrium (LD) between significant markers for loci that have a strong linkage to causal mutants. A strong block was defined as a region with LD (r2≥0.33) between all significant SNPs.
2.5 Estimation of variance explained and gene annotation
SNP-based heritability ( as genomic heritability) from the GWAS was estimated by univariate restricted maximum likelihood in the GCTA v1.24 program (Yang et al., 2011). We used the bivariate mixed model to estimate pairwise phenotypic and genetic correlations simultaneously for each result relating to albumen quality. The genetic relationship matrix partitioned the chicken genome into 28 autosomes and identified two linkage groups by calculating the contribution to phenotypic variance (CPV) for each point.
The genes nearest or harboring significant SNPs associated with albumen quality were chosen as candidate locations. Ensemble and the UCSC (http://genome.ucsc.edu/) Genome Browser (Gallus gallus genome v5.0) were used to identify annotated genes located in candidate regions.
3.1 Phenotypic description and genetic parameters
The phenotype for albumen quality is given in Table 1. The AH at the age of first egg (AFE) was largest when the egg weight was lowest (Coorey et al., 2015). The AH and HU at most points showed weak phenotypic correlations except at weeks 60, 66, and 72. Trends observed in AH and HU were nearly unchanged with the age of the hen. Moreover, no significant differences were found in AH or HU at different week time points.
Table 1Phenotypic data of albumen quality.

No. is number of samples; AFE is age of first egg; AH is albumen height; HU
is Haugh unit.
* extremely significant correlation between albumen height and Haugh units
at the same week.
The heritability of AH ranged from 0.15 to 0.35, which was higher than HU at each point for the HU derived from egg weight. The highest SNP-based heritability estimates of AH and HU were both found at 32 weeks of age (, 0.31, respectively).
The phenotypic correlation and genetic parameters are shown in Tables 2 and 3. The phenotypic correlation coefficient by Pearson correlation and the genetic correlation analysis by bivariate GCTA revealed that both AH and HU at multiple ages are highly and positively interrelated. The correlation coefficient between AH and HU at the same point showed a positive and high value. Moreover, the correlation coefficient indicated that AH or HU showed lower genetic correlations with the traits at other points, compared with those among albumen quality from 32 to 72 weeks of age.
Table 2Phenotypic correlation and genetic parameters of albumen height.

Genetic correlations (upper triangle) and phenotypic correlations (above diagonal) and with heritability estimates in the diagonal. AFE_AH = first egg albumen height; AH32, AH36, AH40, AH44, AH48, AH52, AH56, AH60, AH66, AH72 = albumen height every 4 weeks from 32 to 60 weeks old, and every 6 weeks from 60 to 72 weeks old.
Table 3Phenotypic correlation and genetic parameters of Haugh units (HU).
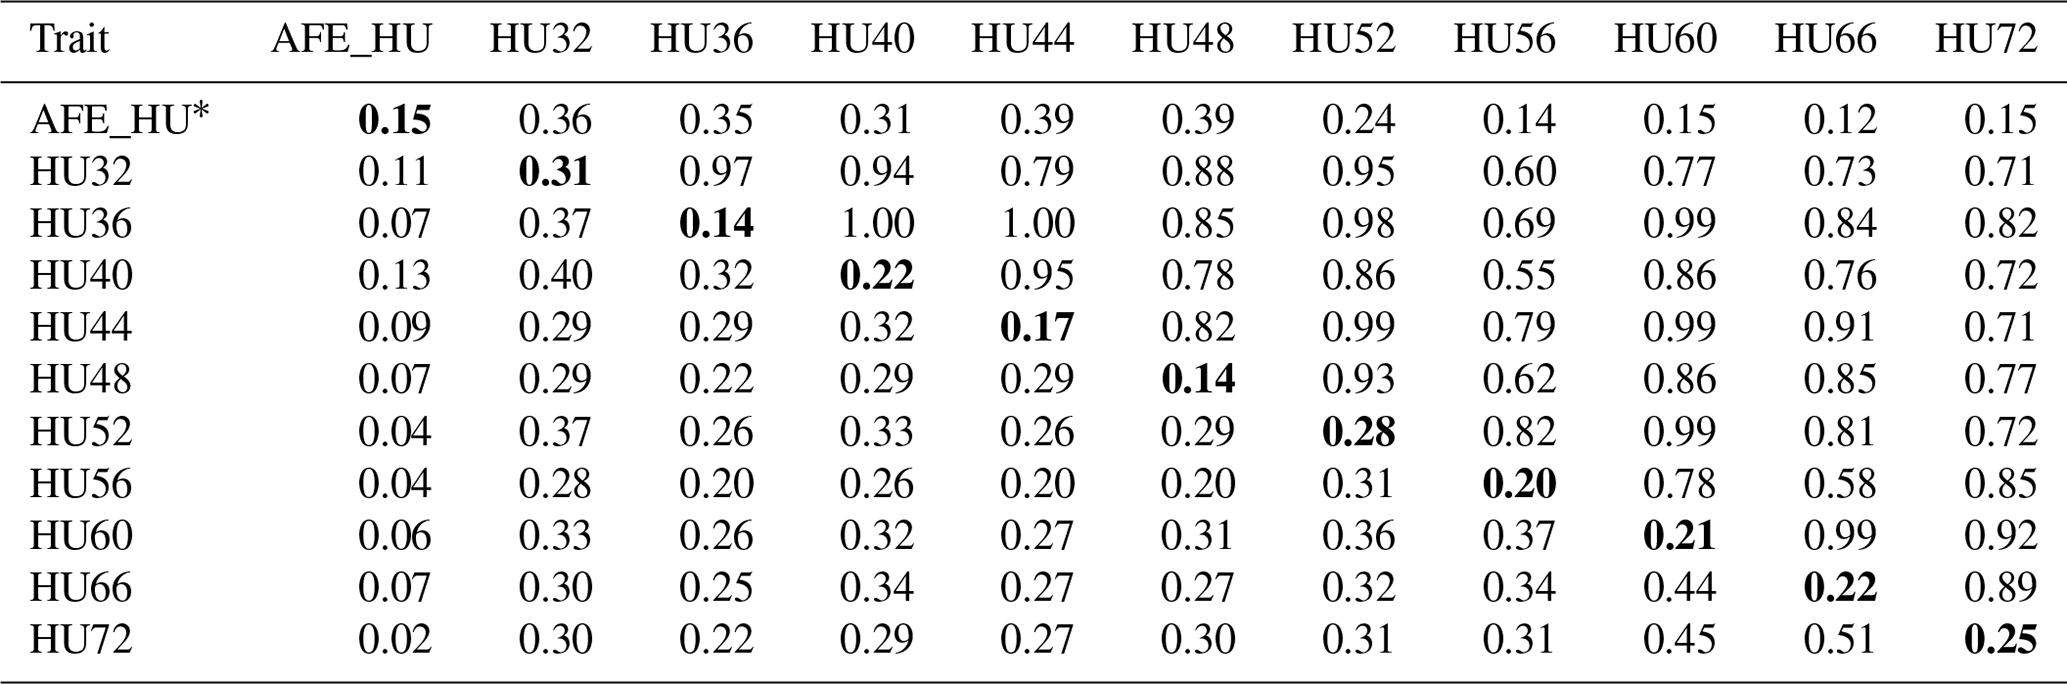
Genetic correlations (upper triangle) and phenotypic correlations (above
diagonal) and with heritability estimates in the diagonal.
* AFE_HU = first egg albumen height; HU32, HU36, HU40, HU44,
HU48, HU52, HU56, HU60, HU66, HU72 = Haugh unit every 4 weeks from 32 to
60 weeks old, and every 6 weeks from 60 to 72 weeks old.
3.2 Identifying candidate loci by GWAS
We performed GWAS analysis for AH and HU at 11 separate time points. Using a univariate method, we found only 3, 2, and 1 SNPs reached a significant level related to AH at 32 (GGA1, GGA4), 52 (GGA4), and 56 (GGA7) week points, respectively. Two SNPs on GGA2 are related to HU at 44 weeks. Moreover, a total of 221 genome-wide suggestive SNPs was obtained from 11 independent univariate analyses, located on 14 (GGA1–9, GGA14, GGA17–20, GGA23, GGA24, GGA30) different chromosomes (Table S1 in the Supplement). From the phenotypic and genetic data obtained above, it is assumed that analysis of the data from 32 weeks of age would be more reliable. A Q–Q and Manhattan plot for all SNPs affecting AH at 32, 52, and 56 weeks and HU at 44 weeks is given in Fig. 1, and the remaining parameters are shown in the Supplement Fig. S1. The detailed significant SNPs by univariate analysis are shown in Table 4.
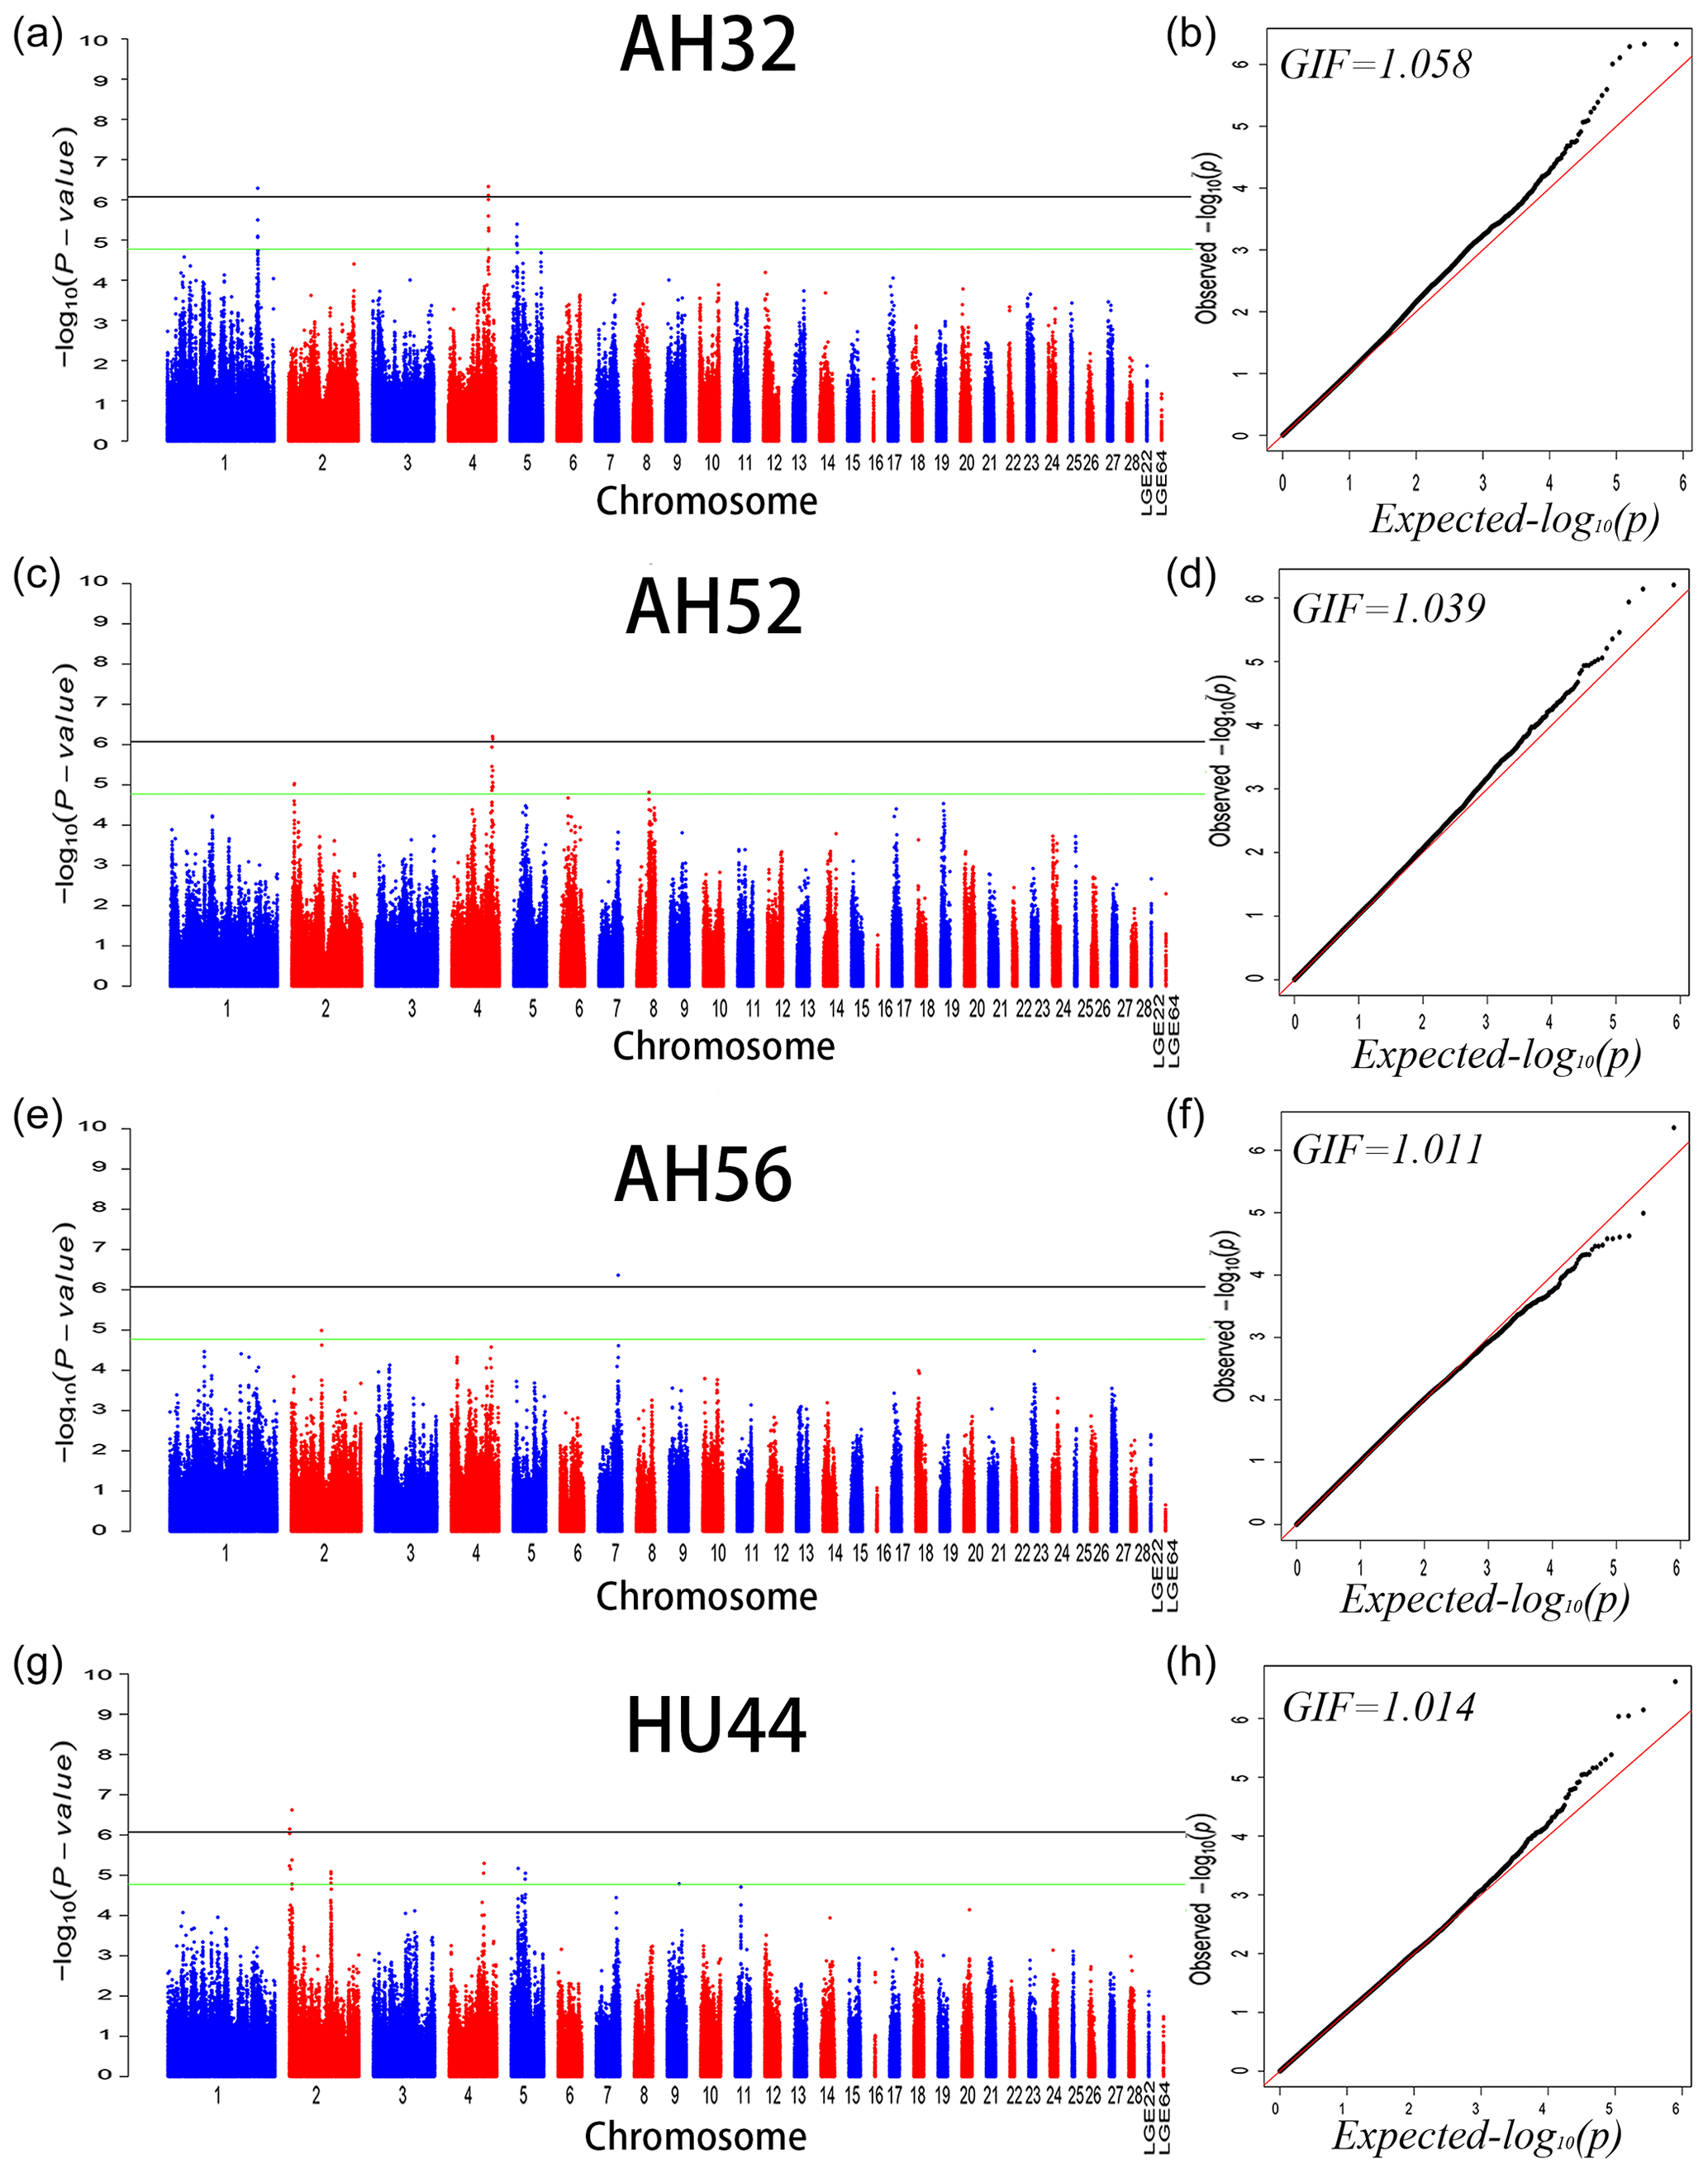
Figure 1Manhattan plot (a, c, e, f) and quantile–quantile (Q–Q) plot (b, d, f, h) of the observed P values for albumen height at 32, 52, and 56 weeks of age and Haugh units at 44 weeks of age. For the Manhattan plots, the black and green lines depict the genome-wide significant and suggestive thresholds with values of and , respectively.
Table 4SNP markers with significant effects on albumen quality by univariate genome-wide association study.
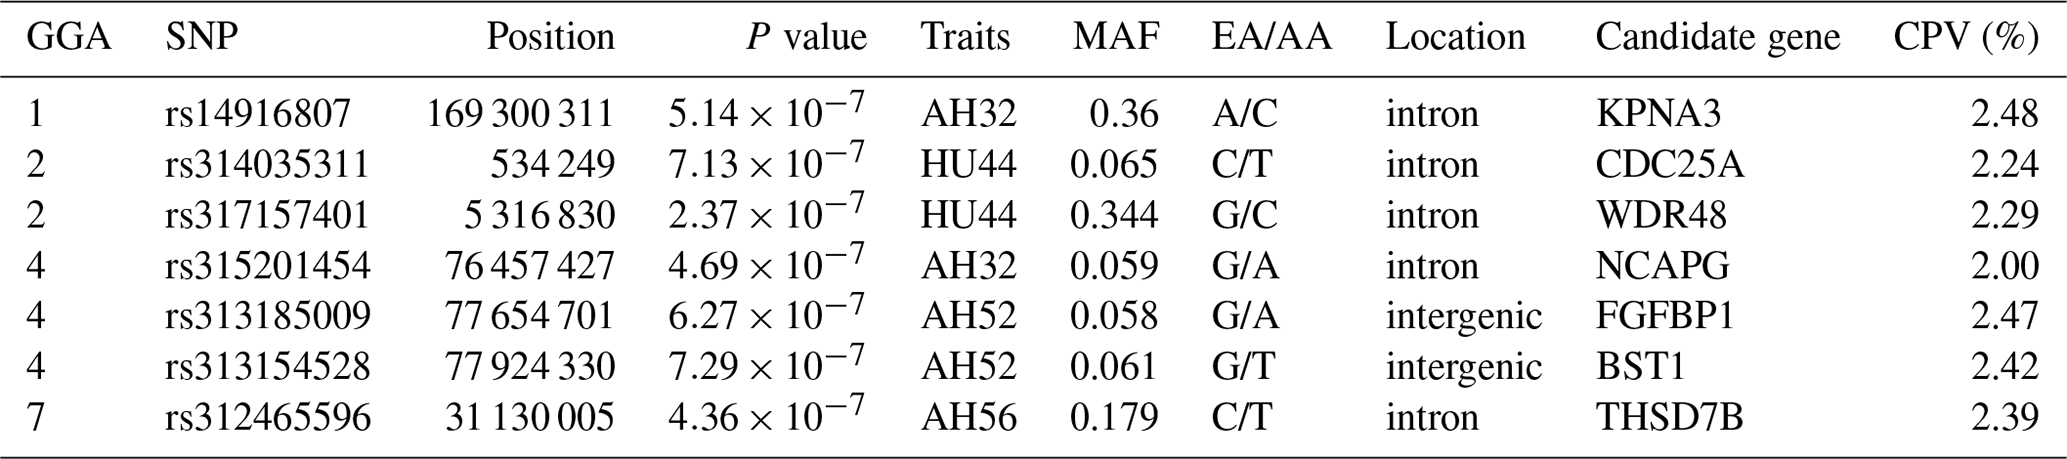
Abbreviations: GGA, Gallus gallus chromosome; EA, effect allele (minor allele); AA, alternative allele (major allele); MAF, minor allele frequency; CPV, contribution to phenotypic variance (%).
The different points that had similar significant or suggestive SNP regions were performed by a multivariate model. Then we conducted GWAS for the AH and HU at 32, 44, and 48 weeks of age. Moreover, the AH at 32, 52, and 60 weeks were also conducted by multivariate analysis in GEMMA. Consequently, nine loci exceeded the threshold for genome-wide significance association with AH at 32, 52, and 60 weeks. Figure 2 depicts the Manhattan and Q–Q plots for all SNPs. Detailed information about significant and suggestive SNPs by multivariate analysis are shown in Table S2.
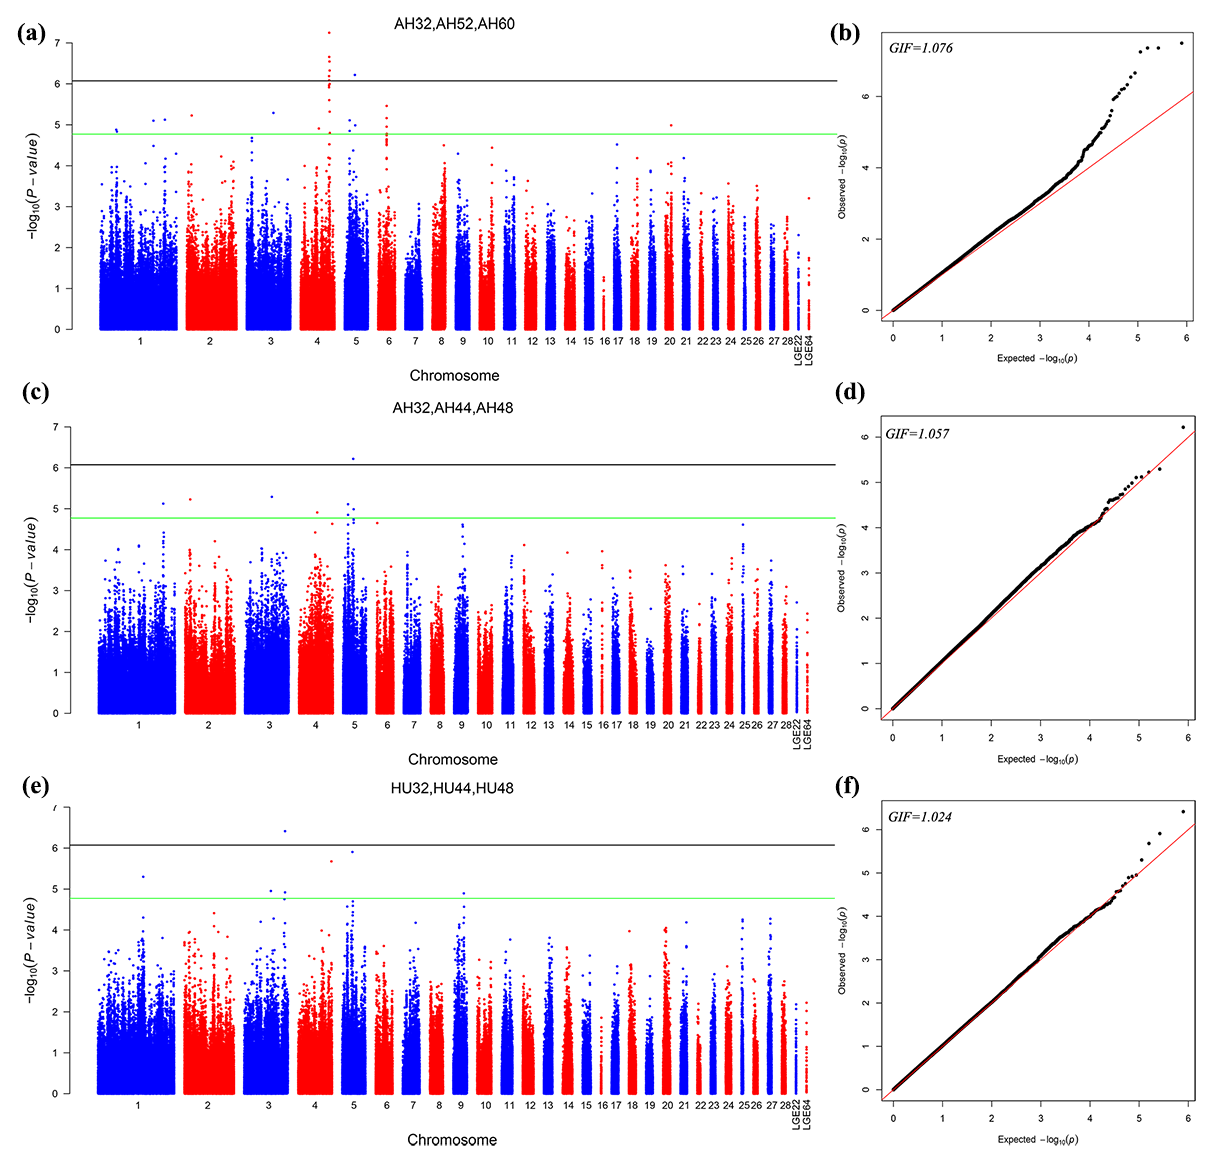
Figure 2Manhattan plot (a, c, e) and quantile–quantile (Q–Q) plot (b, d, f) of the observed P values for the albumen quality by multivariate analysis. For the Manhattan plots, the black line and green lines are the genome-wide significant and suggestive thresholds with values of and , respectively.
One locus on GGA5 and nine loci on GGA4 provided convincing evidence for associations with AH at week 32. In addition, one locus on GGA3 was related to HU at 32, 44, and 48 weeks old. The results are given in Table 5.
Table 5Eleven SNP markers with significant effects on albumen quality by multivariate analysis.
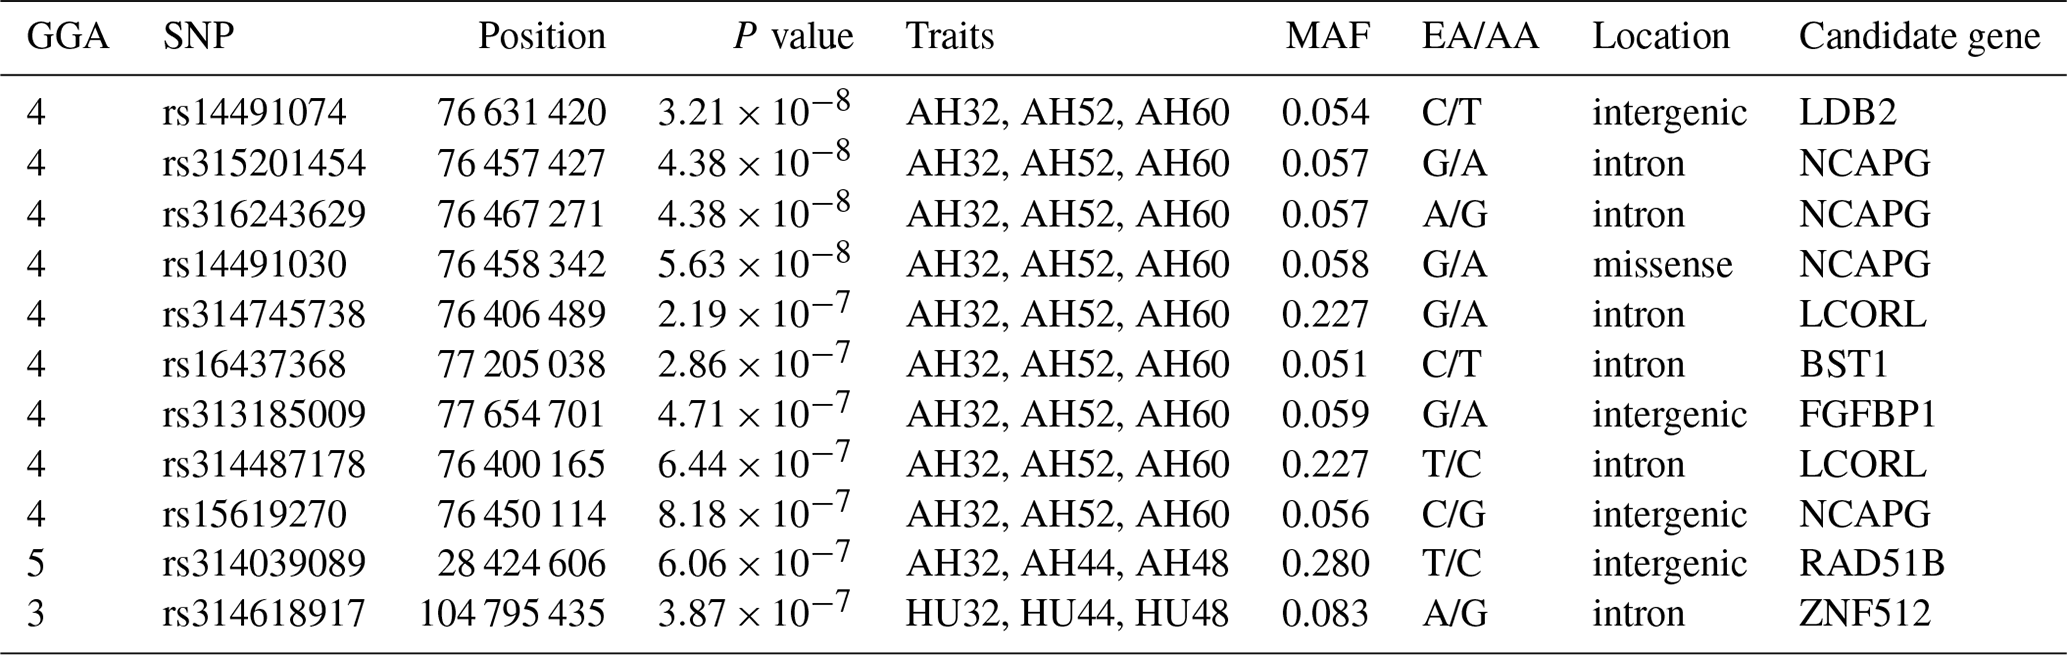
Abbreviations: SNP, single nucleotide polymorphism; GGA, Gallus gallus chromosome; EA, effect allele (minor allele); AA, alternative allele (major allele); MAF, minor allele frequency.
3.3 SNP effects on albumen quality
LD analysis of the significant SNPs on GGA4 showed that there are three strong LD blocks (Fig. 3) in the DX and WL crossed population, corresponding with the SNPs rs314487178, rs14491030, and rs313185009. Overall, the SNPs obtained from univariate analysis explained more than 2 % of the phenotypic variance for the AH. The proportion of SNPs obtained from multivariate analysis was highest at 32, 44, 52, and 56 weeks old. To detect candidate genes, the significant SNPs were used to blast the Gallus gallus assembly 5.0 on Ensemble. The detailed genes are showed in Tables 4 and 5. It is noteworthy that SNPrs14491030 located in the missense area of gene NCAPG has a significant association with AH. The largest estimate was obtained from AH at 52 weeks old with the proportion reaching 2.47 %. The CPV of the remaining SNPs ranged from 0 % to ∼2 % (Table 6).
Table 6Contributions to the phenotypic variance in albumen quality by eight mutations at different weeks.
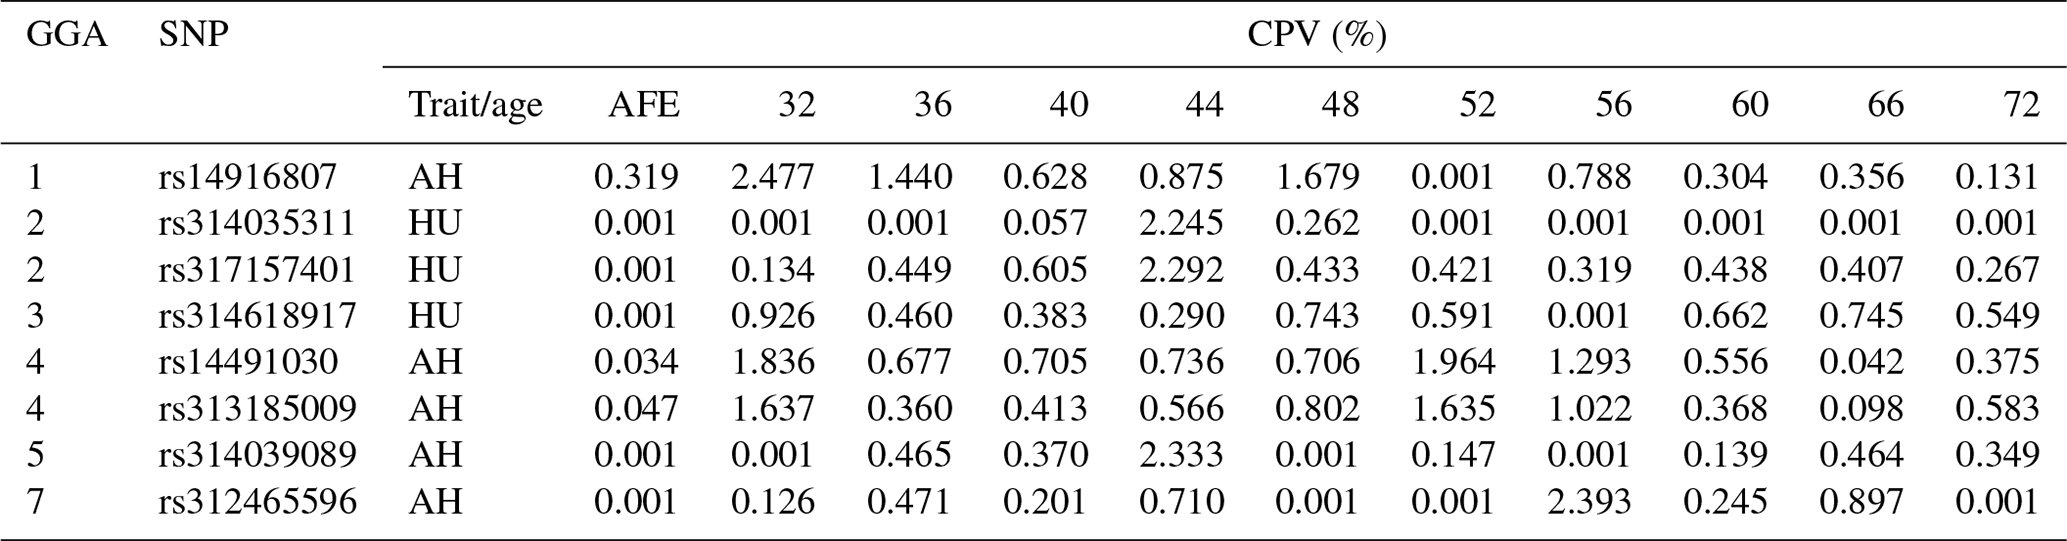
Abbreviations: CPV, Contributions to the phenotypic variance; AH, albumen height; HU, Haugh unit; AFE, age at first egg.
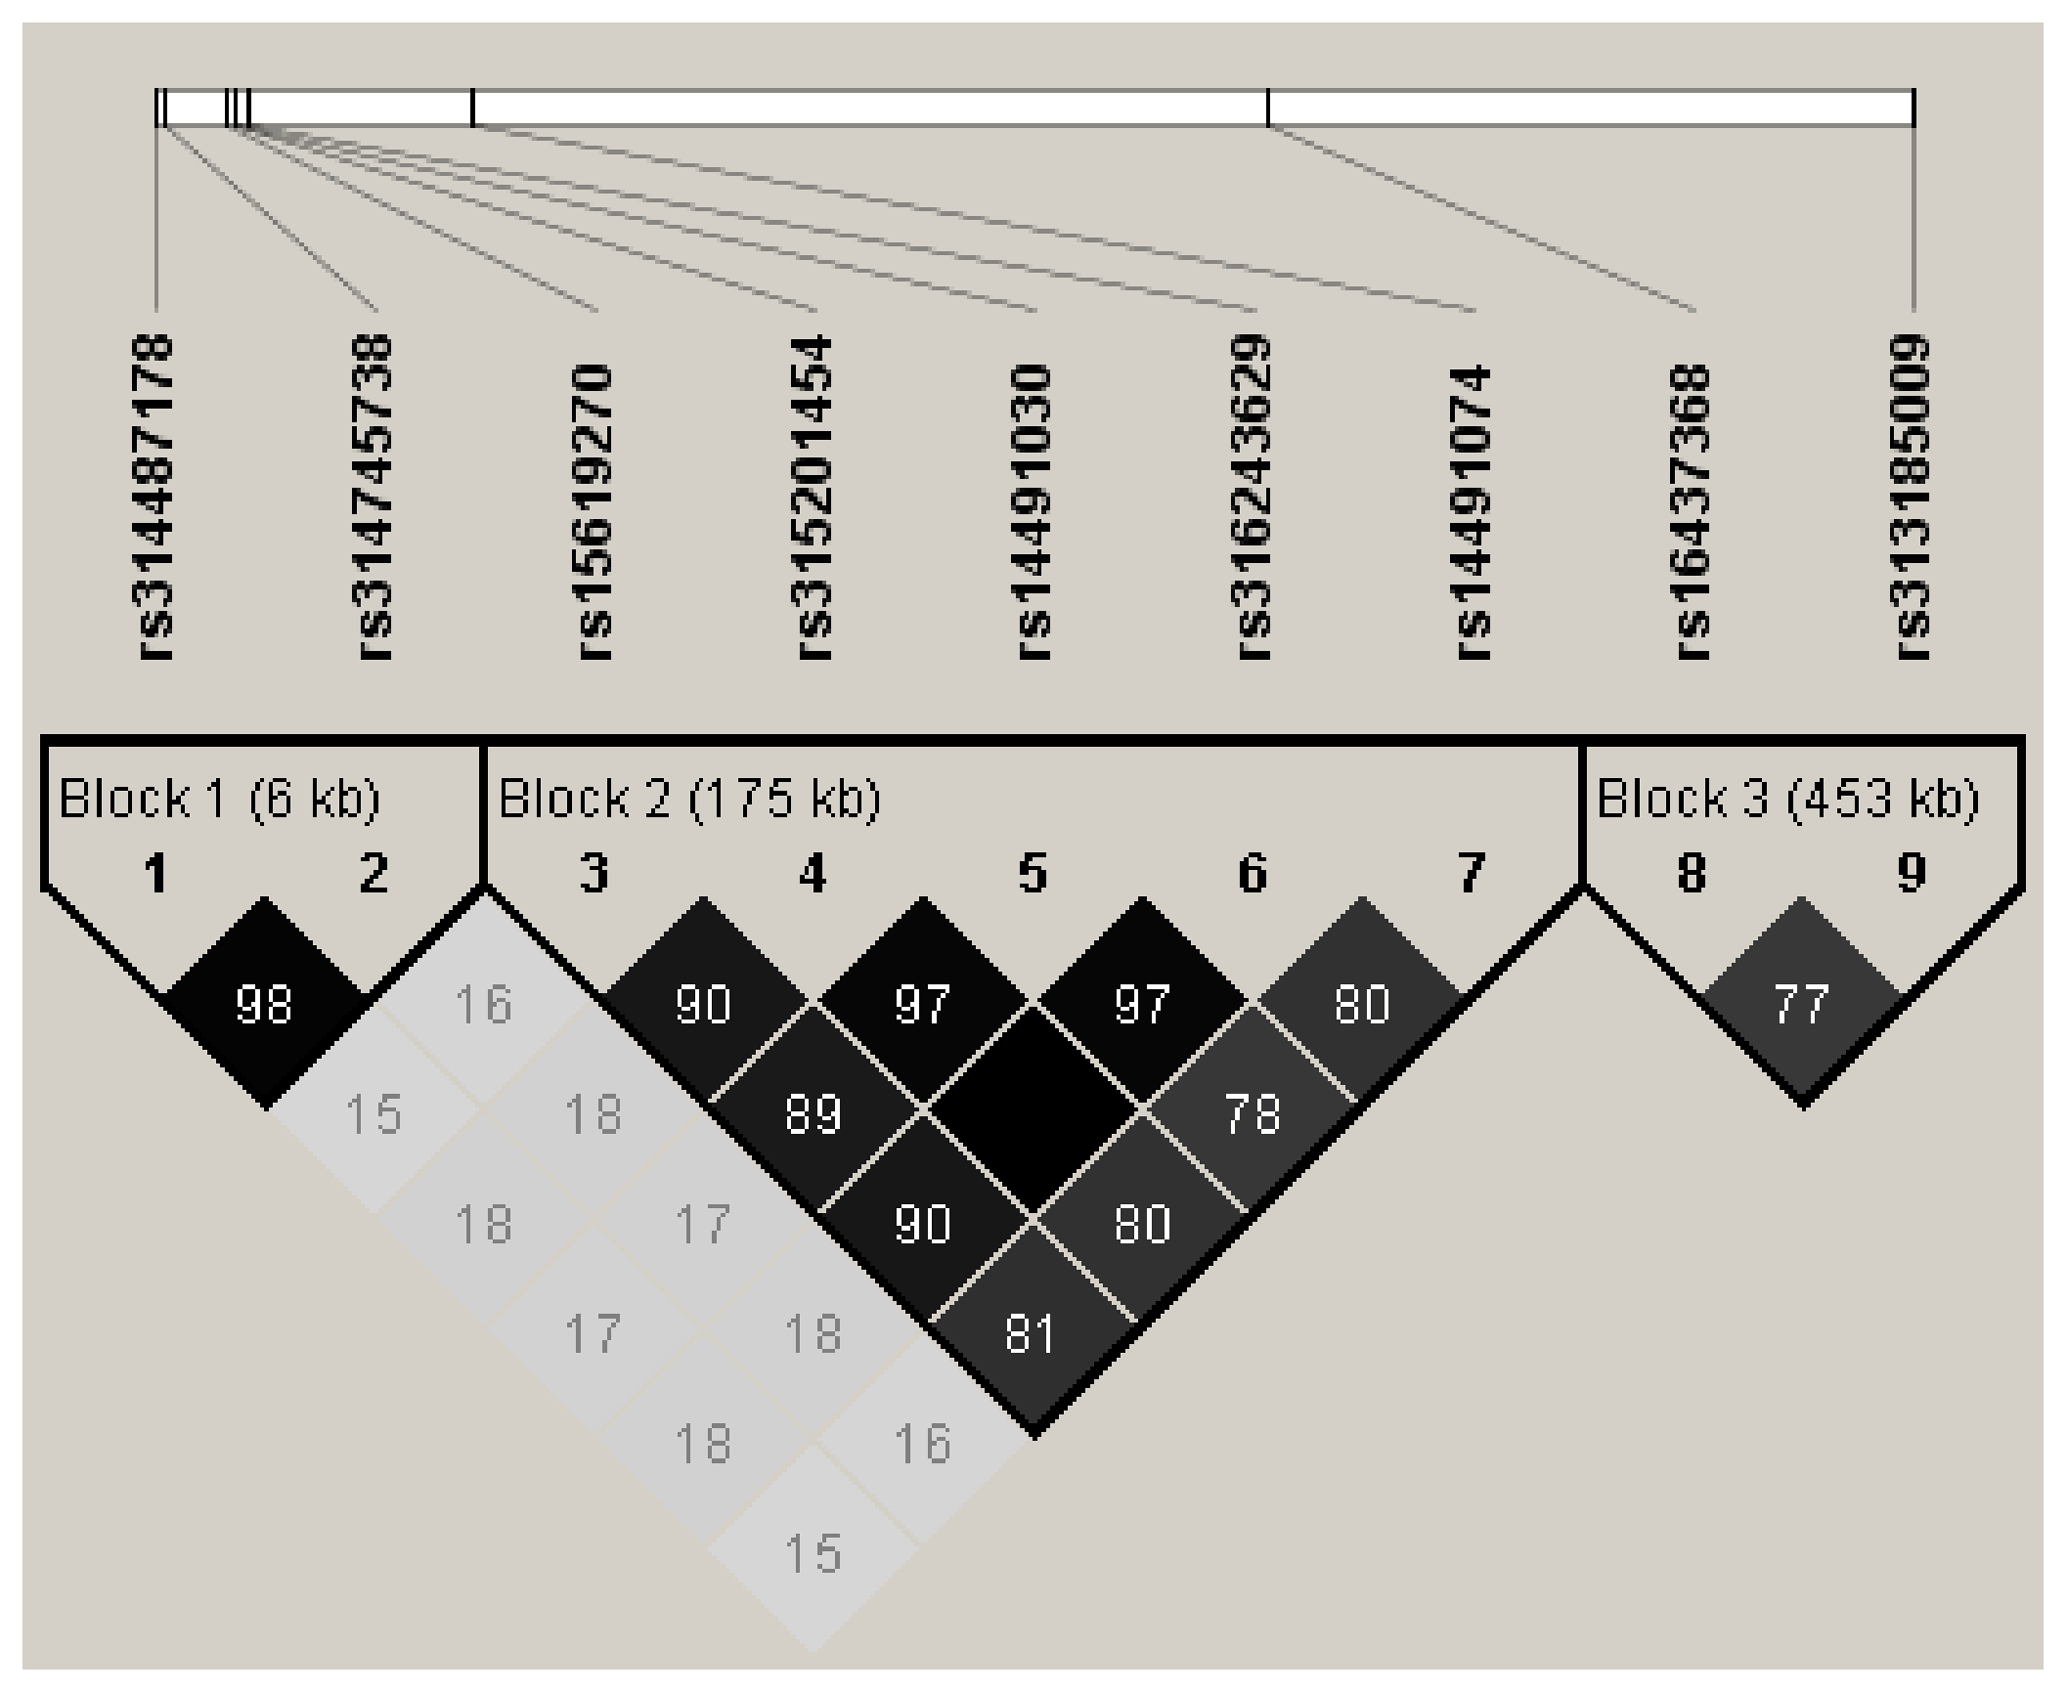
Figure 3LD analysis of the significant SNPs on GGA4. Three strong blocks were observed in this significant region, number in the diamond block is the R2 value.
Previous genome-wide studies have focused on albumen quality from a limited time point, with different results from different reports. In the current research, we integrated multiple ages, a high-density array, and statistical analysis strategies with an aim to understand the molecular mechanisms of albumen quality in chickens.
The value of AH ranged from 4.05 to 4.56 mm when measured by the egg analyzer, which was lower than the conventional method used in previous reports (Ledur et al., 2002; Sert et al., 2011; Honkatukia et al., 2013; Goto et al., 2014; Rath et al., 2015). The first reason for this is that the egg analyzer is an automatic testing device, therefore the albumen at the thickest point is not within the range of testing because the testing area is in a relatively fixed position. It is assumed that the conventional method may be a more reliable method to test AH. Second, the AH of unselected local hens had a lower albumen compared to commercial hens (Kehua et al., 2012). Our population of F0 is generated from a local Chinese chicken, the DX chicken, which has a lower AH than commercial lines.
Heritability estimation on AH and HU by GCTA was lower, except for the value at 32 weeks of age, when compared to previous studies (Honkatukia et al., 2013; Goto et al., 2014; Rath et al., 2015; Wolc et al., 2012). The genetic correlation between AH at different time points was from 0.41 to 1.0, while the phenotypic correlation was lower. The genetic parameters estimated from genomic relationship will be more accurate compared to pedigree relationship (Wolc et al., 2013), and are easily affected by the structure of statistical models, depth of pedigree, and data size. On the other hand, this suggests that the trait of albumen quality is easily affected by the environment; moreover, given that high-density SNP genotypes increased accuracies of estimated breeding value (Wolc et al., 2013), it is likely that genomic selection should be applied in albumen quality breeding.
We obtained a total of seven significant SNPs located on GGA1, 2, 4, and 7 that were associated with AH and HU by univariate analysis, while 10 SNPs were found mainly on GGA4 by conducting multivariate analysis, which indicated that common variants were important contributors to the albumen quality. The HU is influenced by the strain and age, the calculation of which has been questioned (Silversides and Villeneuve, 1994). In our results, the significant number of SNPs that were associated with HU was less than for AH, this may be because of the overcompensation for egg weight in the HU formula (Silversides, 1994; Nestor and Jaap, 1963). It suggests that only taking AH into account to describe albumen quality would be sufficient.
The QTL affecting albumen quality was on different chromosomes with different breeds in previous reports. Goto et al. (2014) found the region associated with albumen was located on GGA1, 2, 4, 5, 6, 8, 9, 27, and Z. Honkatukia et al. (2013). obtained QTL on chromosomes 7 and Z chromosome related to HU, and Wolc et al. (2014) reported that a region on GGA2 significantly affected AH. Combined with the results from our previous study, this suggests that albumen quality is a complex quantitative trait affected by polygenes.
From our study, evidence for the region between position 76.4 to 77.7 Mb on GGA4 associated with many traits corresponded to the previous findings of different resource populations (Schreiweis et al., 2006; Kerje et al., 2003), which suggests that GGA4 may play a key role in different traits. Moreover, our study identified candidate genes on GGA4 that provide strong confirmation of our previously reported region for egg weight (Yi et al., 2015) and eggshell traits (Sun et al., 2015). It is noted that the QTL that affects egg weight or shell traits also influences albumen quality. The significant SNPs on GGA4 were distributed into two blocks. The rs14491030 located in the missense of gene NCAPG (non-SMC condensin I complex, subunit G). The gene has a pleiotropy function on many traits, like residual feed intake in bovines (Widmann et al., 2015), withers height in horses (Tetens et al., 2013), and body weight in chickens (Setoguchi et al., 2009). The results of our population study revealed that NCAPG may affect egg weight because albumen is the major contributor to egg weight (Silversides and Budgell, 2004). The egg weight gain may be through increasing albumen by NCAPG modulation. Another SNP rs313185009 located on FGFBP1 (fibroblast growth factor, FGF, binding protein 1) showed 1.637 % CPV for AH at 32 weeks. FGFBP1 binds to FGFs to play a role in the control of wound healing and tumor angiogenesis in humans (Tomaszewski et al., 2011). In chickens, the release of FGFs from local extracellular matrix storage is essential for chicken embryonic development within the first 3 days (Gibby et al., 2009). Many genes displayed a pleiotropic effect in multiple phenotypes simultaneously (Mackay et al., 2009); it is speculated that FGFBP1 may be involved in albumen synthesis.
On GGA1, two regions around 50 Mb (Tuiskula-Haavisto et al., 2004) and between 90.35 and 123.03 Mb (Yi, 2005) are associated with albumen quality. The locus rs14916807 located on GGA1 with a physical position of 169.3 Mb was significantly associated with AH at 32 weeks old, and the CPV (2.48 %) was highest in all significant loci. Findings obtained from other reports showed that this region was also related to body weight (Wang et al., 2015; Xie et al., 2012) and bone traits (Zhang et al., 2010), which indicated that the region has a pleiotropic function on many traits. The locus is located in the intron of gene KPNA3 (karyopherin alpha 3). KPNA3 affects breast muscle weight and leg muscle weight in chicken (Xie et al., 2012), and is highly expressed in adipose tissue acting on the importation of proteins in rat (Plant et al., 2006). The changes in ovomucin significantly affect thick albumen (Toussant and Latshaw, 1999). The aforementioned genes may participate in the process of synthesis and transportation of ovomucin.
Notably, it was shown that the genomic region on 24.52–29.72 Mb overlapped on GGA7 based on galgal 4.0 association with AH and HU at the age of 40 weeks (Honkatukia et al., 2013). Our results revealed that the rs312465596 at position 31.13 Mb based on galgal 5.0 also influences albumen height at 56 weeks old. Accordingly, it was revealed that the region around 31 Mb on GGA7 may be a candidate QTL for albumen quality. The SNP rs312465596 located in gene THSD7B (thrombospondin type-1 domain-containing protein 7B precursor). THSD7B affects atherothrombotic disease in humans (Brand-Herrmann, 2008). Further study on how this gene affects albumen quality is necessary.
Two adjacent SNPs on GGA2 in our present study were significantly associated with HU at 44 weeks, which did not coincide with previous reports that show a QTL located at 10.05 Mb related to AH at 40 weeks (Liu et al., 2011). The nearest genes to the two markers were CDC25A and WDR48. The gene CDC25A (cell division cycle 25A) is a crucial regulator of cell cycle progression (Shreeram et al., 2008), while WDR48 (WD repeat protein 48) is considered a potential tumor suppressor (Gangula and Maddika, 2013), yet its function on albumen quality is almost unknown. Moreover, another two SNPs on GGA5 and GGA3 association with AH and HU at three different ages did not agree with a previously reported region on the same chromosome (Abasht et al., 2009). The results show compellingly that albumen height is a complex trait that is affected by polygenes or multiple QTL regions.
Although the results from the current study may be more vulnerable to different regions at longitudinal points, the present research strongly suggests that at least one major QTL on GGA4 and several other loci of minor effects are involved in albumen quality, which suggests that the genetic architecture of albumen quality is partially discrete at different QTL regions and these QTLs have age-dependent manners of controlling albumen trait (Goto et al., 2018). This has important ramifications for understanding complex trait interactions and pleiotropy in domestication. A complex trait is often a quantitative trait that is affected by polygenes. Moreover, most of the genes detected in the current research have not been reported in association with egg quality in previous work. This highlights that pleiotropy may occur between traits that are not thought to be functionally related (Mackay et al., 2009). For example, some diseases in humans are not physiologically associated but can still be affected by the same mutation (Flint and Mackay, 2009). Albumen quality is a complex trait that involves transportation, protein synthesis, and secretion; it is assumed that genetic relationships exist between the albumen and other traits in the process of albumen formation. Despite all this, the impact on albumen quality of the genes identified by us requires further investigation.
From the current research, one major QTL detected on GGA4 showed significant association with albumen quality. In this region, NCAPG and FGFBP1 were analyzed as candidate genes. Moreover, it was found that putative QTLs at GGA1, GGA2, GGA7, GGA5, and GGA3 were associated with albumen quality. This result suggests that albumen quality is a complex trait that is affected by one major QTL and polygenes.
The datasets used and/or analyzed during the current research are available upon request.
The supplement related to this article is available online at: https://doi.org/10.5194/aab-62-113-2019-supplement.
HL and KW were responsible for the study design. LQ, MS, and JG performed data analysis. XW, YH, YL, and MM collected the data. LQ wrote the manuscript. LQ, MS, and JG participated in the interpretation of the results and review of the paper. All authors read and approved the final manuscript.
The authors declare that they have no conflict of interest.
This work was supported by the China Agriculture Research Systems (CARS-40-K01), Sanxin Project in Jiangsu Province (JATS[2018]247), and Program for the Agricultural Major New Variety of the Jiangsu Province (PZCZ201729) PR China. The funders had no role in the study design, data collection and analysis, decision to publish, or preparation of the manuscript. The authors also gratefully acknowledge the staff of China Agricultural University for involvement in this program.
This paper was edited by Steffen Maak and reviewed by two anonymous referees.
Abasht, B., Sandford, E., Arango, J., Settar, P., Fulton, J. E., O'Sullivan, N. P., Hassen, A., Habier, D., Fernando, R. L., Dekkers, J. C., and Lamont, S. J.: Extent and consistency of linkage disequilibrium and identification of DNA markers for production and egg quality traits in commercial layer chicken populations, BMC Genomics, 10 Suppl 2, S2, https://doi.org/10.1186/1471-2164-10-s2-s2, 2009.
Abeyrathne, E. D., Lee, H. Y., and Ahn, D. U.: Egg white proteins and their potential use in food processing or as nutraceutical and pharmaceutical agents–a review, Poultry Sci., 92, 3292–3299, https://doi.org/10.3382/ps.2013-03391, 2013.
Aulchenko, Y. S., Ripke, S., Isaacs, A., and Van Duijn, C. M.: GenABEL: an R library for genome-wide association analysis, Bioinformatics (Oxford, England), 23, 1294–1296, https://doi.org/10.1093/bioinformatics/btm108, 2007.
Barrett, J. C., Fry, B., Maller, J., and Daly, M. J.: Haploview: analysis and visualization of LD and haplotype maps, Bioinformatics (Oxford, England), 21, 263–265, 2005.
Brand-Herrmann, S. M.: Where do we go for atherothrombotic disease genetics?, Stroke, 39, 1070–1075, https://doi.org/10.1161/strokeaha.107.508515, 2008.
Browning, B. L. and Browning, S. R.: A unified approach to genotype imputation and haplotype-phase inference for large data sets of trios and unrelated individuals, Am. J. Hum. Genet., 84, 210–223, https://doi.org/10.1016/j.ajhg.2009.01.005, 2009.
Campbell, L., Raikos, V., and Euston, S. R.: Modification of functional properties of egg-white proteins, Die Nahrung, 47, 369–376, https://doi.org/10.1002/food.200390084, 2003.
Coorey, R., Novinda, A., Williams, H., and Jayasena, V.: Omega-3 fatty acid profile of eggs from laying hens fed diets supplemented with chia, fish oil, and flaxseed, J. Food Sci., 80, S180–187, https://doi.org/10.1111/1750-3841.12735, 2015.
Flint, J. and Mackay, T. F.: Genetic architecture of quantitative traits in mice, flies, and humans, Genome Res., 19, 723–733, https://doi.org/10.1101/gr.086660.108, 2009.
Gangula, N. R. and Maddika, S.: WD repeat protein WDR48 in complex with deubiquitinase USP12 suppresses Akt-dependent cell survival signaling by stabilizing PH domain leucine-rich repeat protein phosphatase 1 (PHLPP1), J. Biol. Chem., 288, 34545–34554, https://doi.org/10.1074/jbc.M113.503383, 2013.
Gao, X., Becker, L. C., Becker, D. M., Starmer, J. D., and Province, M. A.: Avoiding the high Bonferroni penalty in genome – wide association studies, Genet. Epidemiol., 34, 100–105, https://doi.org/10.1002/gepi.20430, 2010.
Gibby, K. A., McDonnell, K., Schmidt, M. O., and Wellstein, A.: A distinct role for secreted fibroblast growth factor-binding proteins in development, P. Natl. Acad. Sci. USA, 106, 8585–8590, https://doi.org/10.1073/pnas.0810952106, 2009.
Goto, T., Ishikawa, A., Yoshida, M., Goto, N., Umino, T., Nishibori, M., and Tsudzuki, M.: Mapping of Main-Effect and Epistatic Quantitative Trait Loci for Internal Egg Traits in an F2 Resource Population of Chickens, J. Poultry Sci., 51, 375–386, 2014.
Goto, T., Ishikawa, A., Nishibori, M., and Tsudzuki, M.: A longitudinal quantitative trait locus mapping of chicken growth traits, Mol. Genet. Genomics, https://doi.org/10.1007/s00438-018-1501-y, 2018.
Haugh, R.: The Haugh unit for measuring egg quality, United States Egg and Poultry Magazine, 522–555, 572–573, 1937.
Honkatukia, M., Tuiskula-Haavisto, M., de Koning, D. J., Virta, A., Maki-Tanila, A., and Vilkki, J.: A region on chicken chromosome 2 affects both egg white thinning and egg weight, Genet. Sel. Evol., 37, 563–577, https://doi.org/10.1051/GSE:2005016, 2005.
Honkatukia, M., Tuiskula-Haavisto, M., Arango, J., Tabell, J., Schmutz, M., Preisinger, R., and Vilkki, J.: QTL mapping of egg albumen quality in egg layers, Genetics, selection, evolution, Genet. Sel. Evol., 45, 31, https://doi.org/10.1186/1297-9686-45-31, 2013.
Kehua, W., Taocun, D., Liang, Q., Jun, G., and Jun, H.: Comparison and Analysis for Egg Quality of Seven Breeds of Layer, China Poultry, 24, 23–28, 2012.
Kerje, S., Carlborg, O., Jacobsson, L., Schutz, K., Hartmann, C., Jensen, P., and Andersson, L.: The twofold difference in adult size between the red junglefowl and White Leghorn chickens is largely explained by a limited number of QTLs, Anim Genet., 34, 264–274, 2003.
Ledur, M. C., Liljedahl, L. E., McMillan, I., Asselstine, L., and Fairfull, R. W.: Genetic effects of aging on egg quality traits in the first laying cycle of White Leghorn strains and strain crosses, Poultry Sci., 81, 1439–1447, 2002.
Li-Chan, E. C. and Kim, H.-O.: Structure and chemical composition of eggs, Egg Bioscience and Biotechnology, https://doi.org/10.1002/9780470181249.ch1, 2008.
Li, J., Yang, S., Su, N., Wang, Y., Yu, J., Qiu, H., and He, X.: Overexpression of long non-coding RNA HOTAIR leads to chemoresistance by activating the Wnt/β-catenin pathway in human ovarian cancer, Tumor Biol., 37, 2057–2065, https://doi.org/10.1007/s13277-015-3998-6, 2015.
Liu, W., Li, D., Liu, J., Chen, S., Qu, L., Zheng, J., Xu, G., and Yang, N.: A genome-wide SNP scan reveals novel loci for egg production and quality traits in white leghorn and brown-egg dwarf layers, PloS one, 6, e28600, https://doi.org/10.1371/journal.pone.0028600, 2011.
Mackay, T. F., Stone, E. A., and Ayroles, J. F.: The genetics of quantitative traits: challenges and prospects, Nat. Rev. Genet., 10, 565-577, https://doi.org/10.1038/nrg2612, 2009.
Nestor, K. E. and Jaap, R. G.: Egg Weight May Influence Albumen Height, Poultry Sci., 42, 1249–1250, 1963.
Plant, K. E., Everett, D. M., Gordon Gibson, G., Lyon, J., and Plant, N. J.: Transcriptomic and phylogenetic analysis of Kpna genes: a family of nuclear import factors modulated in xenobiotic-mediated liver growth, Pharmacogenet Genomics, 16, 647–658, https://doi.org/10.1097/01.fpc.0000220570.82842.4d, 2006.
Purcell, S., Neale, B., Todd-Brown, K., Thomas, L., Ferreira, M. A., Bender, D., Maller, J., Sklar, P., De Bakker, P. I., and Daly, M. J.: PLINK: a tool set for whole-genome association and population-based linkage analyses, Am. J. Hum. Genet., 81, 559–575, https://doi.org/10.1086/519795, 2007.
Rath, P. K., Mishra, P. K., Mallick, B. K., and Behura, N. C.: Evaluation of different egg quality traits and interpretation of their mode of inheritance in White Leghorns, Vet. World, 8, 449–452, https://doi.org/10.14202/vetworld.2015.449-452, 2015.
Roberts, J. R.: Factors affecting egg internal quality and egg shell quality in laying hens, J. Poultry Sci., 41, 161–177, 2004.
Schreiweis, M., Hester, P., Settar, P., and Moody, D.: Identification of quantitative trait loci associated with egg quality, egg production, and body weight in an F2 resource population of chickens1, Anim Genet., 37, 106–112, 2006.
Scott, T. A. and Silversides, F. G.: The effect of storage and strain of hen on egg quality, Poultry Sci., 79, 1725–1729, 2000.
Sert, D., Aygun, A., and Demir, M. K.: Effects of ultrasonic treatment and storage temperature on egg quality, Poultry Sci., 90, 869–875, https://doi.org/10.3382/ps.2010-00799, 2011.
Setoguchi, K., Furuta, M., Hirano, T., Nagao, T., Watanabe, T., Sugimoto, Y., and Takasuga, A.: Cross-breed comparisons identified a critical 591-kb region for bovine carcass weight QTL (CW-2) on chromosome 6 and the Ile-442-Met substitution in NCAPG as a positional candidate, BMC Genet., 10, https://doi.org/10.1186/1471-2156-10-43, 2009.
Shen, M., Qu, L., Ma, M., Dou, T., Lu, J., Guo, J., Hu, Y., Yi, G., Yuan, J., Sun, C., Wang, K., and Yang, N.: Genome-Wide Association Studies for Comb Traits in Chickens, PloS one, 11, e0159081, https://doi.org/10.1371/journal.pone.0159081, 2016.
Shreeram, S., Hee, W. K., and Bulavin, D. V.: Cdc25A serine 123 phosphorylation couples centrosome duplication with DNA replication and regulates tumorigenesis, Mol. Cell Biol., 28, 7442–7450, https://doi.org/10.1128/mcb.00138-08, 2008.
Silversides, F. G.: The haugh unit correction for egg weight is not adequate for comparing eggs from chickens of different lines and ages, J. Appl. Poultry Res., 3, 120–126, 1994.
Silversides, F. G. and Budgell, K.: The relationships among measures of egg albumen height, pH, and whipping volume, Poultry Sci., 83, 1619–1623, 2004.
Silversides, F. G. and Villeneuve, P.: Is the Haugh Unit Correction for Egg Weight Valid for Eggs Stored at Room Temperature?, Poultry Sci., 73, 50–55, 1994.
Sun, C., Qu, L., Yi, G., Yuan, J., Duan, Z., Shen, M., Qu, L., Xu, G., Wang, K., and Yang, N.: Genome-wide association study revealed a promising region and candidate genes for eggshell quality in an F2 resource population, BMC Genomics, 16, https://doi.org/10.1186/s12864-015-1795-7, 2015.
Sun, C., Liu, J., Li, W., Xu, G., and Yang, N.: Divergent Proteome Patterns of Egg Albumen from Domestic Chicken, Duck, Goose, Turkey, Quail and Pigeon, Proteomics, 17, 1700145, https://doi.org/10.1002/pmic.201700145, 2017.
Tetens, J., Widmann, P., Kuhn, C., and Thaller, G.: A genome-wide association study indicates LCORL/NCAPG as a candidate locus for withers height in German Warmblood horses, Anim. Genet., 44, 467–471, https://doi.org/10.1111/age.12031, 2013.
Tomaszewski, M., Charchar, F. J., Nelson, C. P., Barnes, T., Denniff, M., Kaiser, M., Debiec, R., Christofidou, P., Rafelt, S., van der Harst, P., Wang, W. Y., Maric, C., Zukowska-Szczechowska, E., and Samani, N. J.: Pathway analysis shows association between FGFBP1 and hypertension, J. Am. Soc. Nephrol., 22, 947–955, https://doi.org/10.1681/asn.2010080829, 2011.
Toussant, M. J. and Latshaw, J. D.: Ovomucin content and composition in chicken eggs with different interior quality, J. Sci. Food Agri., 79, 1666–1670, 1999.
Tuiskula-Haavisto, M., Honkatukia, M., Vilkki, J., de Koning, D.-J., Schulman, N. F., and Maki-Tanila, A.: Mapping of quantitative trait loci affecting quality and production traits in egg layers, Poultry Sci., 81, 919–927, 2002.
Tuiskula-Haavisto, M., de Koning, D. J., Honkatukia, M., Schulman, N. F., Maki-Tanila, A., and Vilkki, J.: Quantitative trait loci with parent-of-origin effects in chicken, Genet. Res., 84, 57–66, 2004.
Visscher, P. M., Wray, N. R., Zhang, Q., Sklar, P., McCarthy, M. I., Brown, M. A., and Yang, J.: 10 Years of GWAS Discovery: Biology, Function, and Translation, Am. J. Hum. Genet., 101, 5–22, https://doi.org/10.1016/j.ajhg.2017.06.005, 2017.
Wang, W., Wang, J., Zhang, T., Wang, Y., Zhang, Y., and Han, K.: Genome – wide association study of growth traits in Jinghai Yellow chicken hens using SLAF – seq technology, Animal Genet., https://doi.org/10.1111/age.12346, 2015.
Widmann, P., Reverter, A., Weikard, R., Suhre, K., Hammon, H. M., Albrecht, E., and Kuehn, C.: Systems biology analysis merging phenotype, metabolomic and genomic data identifies Non-SMC Condensin I Complex, Subunit G (NCAPG) and cellular maintenance processes as major contributors to genetic variability in bovine feed efficiency, PloS one, 10, e0124574, https://doi.org/10.1371/journal.pone.0124574, 2015.
Wolc, A., Arango, J., Settar, P., O'Sullivan, N. P., Olori, V. E., White, I. M., Hill, W. G., and Dekkers, J. C.: Genetic parameters of egg defects and egg quality in layer chickens, Poultry Sci., 91, 1292–1298, https://doi.org/10.3382/ps.2011-02130, 2012.
Wolc, A., Arango, J., Jankowski, T., Settar, P., Fulton, J. E., O'Sullivan, N. P., Fernando, R., Garrickf, D. J., and Dekkers, J. C.: Pedigree and genomic analyses of feed consumption and residual feed intake in laying hens, Poultry Sci., 92, 2270–2275, 2013.
Wolc, A., Arango, J., Jankowski, T., Dunn, I., Settar, P., Fulton, J., O'Sullivan, N., Preisinger, R., Fernando, R., and Garrick, D.: Genome – wide association study for egg production and quality in layer chickens, J. Anim. Breeding Genetics, 131, 173–182, https://doi.org/10.1111/jbg.12086, 2014.
Xie, L., Luo, C., Zhang, C., Zhang, R., Tang, J., Nie, Q., Ma, L., Hu, X., Li, N., and Da, Y.: Genome-wide association study identified a narrow chromosome 1 region associated with chicken growth traits, PloS one, 7, e30910, https://doi.org/10.1371/journal.pone.0030910, 2012.
Yang, J., Lee, S., Goddard, M., and Visscher, P.: GCTA: a tool for genome-wide complex trait analysis, Am. J. Hum. Genet., 88, 76–82, https://doi.org/10.1016/j.ajhg.2010.11.011, 2011.
Yi, G., Shen, M., Yuan, J., Sun, C., Duan, Z., Qu, L., Dou, T., Ma, M., Lu, J., Guo, J., Chen, S., Qu, L., Wang, K., and Yang, N.: Genome-wide association study dissects genetic architecture underlying longitudinal egg weights in chickens, BMC Genomics, 16, 746, https://doi.org/10.1186/s12864-015-1945-y, 2015.
Yi, N.: Identification of QTL for production traits in chickens, Anim. Biotechnol., 16, 67–79, 2005.
Yuan, J., Wang, K., Yi, G., Ma, M., Dou, T., Sun, C., Qu, L.-J., Shen, M., Qu, L., and Yang, N.: Genome-wide association studies for feed intake and efficiency in two laying periods of chickens, Genet. Sel. Evol., 47, 1–13, https://doi.org/10.1186/s12711-015-0160-2, 2015.
Zhang, H., Zhang, Y. D., Wang, S. Z., Liu, X. F., Zhang, Q., Tang, Z. Q., and Li, H.: Detection and fine mapping of quantitative trait loci for bone traits on chicken chromosome one, J. Anim. Breed & Genet., 127, 462–468, https://doi.org/10.1111/j.1439-0388.2010.00871.x, 2010.
Zhao, J. H.: gap: Genetic Analysis Package, J. Stat. Softw., 23, 1–18, https://doi.org/10.18637/jss.v023.i08, 2007.
Zhou, X. and Stephens, M.: Efficient multivariate linear mixed model algorithms for genome-wide association studies, Nature Methods, 11, 407–409, 2014.