
the Creative Commons Attribution 4.0 License.
the Creative Commons Attribution 4.0 License.
 | 07 Aug 2026
Effects of different slaughter weights on meat quality parameters and gene expression related to fat metabolism in muscles, liver, and gluteal fat in Lalahan lambs
Rabia Arslan
Necmettin Ünal
Akın Yakan
The study examined the meat quality characteristics and expression levels of 3 genes (SREBP-1c, PPARγ, and FASN) affecting fatty acid composition in Lalahan lambs at different slaughter weights. Thirty-six male lambs were randomly divided into three groups and fed intensively. Six lambs from each group were slaughtered at average slaughter weights of 35 (Gr35), 40 (Gr40), and 45 kg (Gr45), respectively. Slaughter weight had a significant effect (P<0.05) on pH and a∗ index from color parameters at 24 h post-mortem, but there was no significant effect on , , , AI, and TI values. There were no significant differences between groups in terms of the expression of SREBP-1c and PPARγ genes in either liver or Musculus longissimus dorsi lumbalis (MLD) tissues, whereas the difference in expression was significant for the FASN gene in liver and MLD (P<0.05). There were no significant differences between groups in terms of the expression of the three genes in gluteal adipose tissue. The findings indicate that Lalahan lambs exhibit favorable meat quality traits and lipid metabolism gene expression patterns under intensive feeding conditions. Comparisons with previously published studies suggest that these characteristics may be somewhat better than those reported for Kivircik sheep (Lalahan sheep are a breed derived from Kivircik sheep); however, studies conducted under the same experimental conditions are needed to make direct comparisons among breeds. In short, high-quality meat can be produced from lambs of the Lalahan sheep genotype.
- Article
(454 KB) - Full-text XML
- BibTeX
- EndNote


In sheep breeding, sheep meat production is the most important source of income. In order to maximize sheep meat production, it is necessary to obtain a high parturition rate with high viability and quickly bring lambs to slaughter weight. To produce high-quality sheep meat, it is necessary to have a high enough milk yield for the lambs, while, in sheep, it is essential to have good nutrition, carcass quality characteristics, and meat quality characteristics with high viability (Unal et al., 2006).
Lalahan sheep, which were obtained by combination melting between the Kivircik and Akkaraman breeds, contain approximately 75 % Kivircik genotype and 25 % Akkaraman genotype (Akçapınar et al., 2004; Erol, 2013). Several studies have investigated Lalahan sheep product characteristics in the first years of breeding, single lactation, and single slaughtering weight. However, no studies have investigated milk yield, milk quality, breast types, and breast sizes in sheep with different lactations, nor have they investigated yield performance, cutting, carcass, and meat quality characteristics or the levels of expression of genes affecting the quality of meat in different weight cuts. While Erol et al. (2017) studied the genotype of parturition rate and several morphological characteristics, no study has examined meat quality and the levels of expression of genes potentially affecting these parameters in sheep at different slaughtering weights.
Meat quality is influenced by several factors, such as breed, gender, age, nutrition, slaughtering weight, and pre-slaughtering stress. Meat quality is evaluated in terms of various criteria, including pH, color, water-holding capacity, cooking loss, and fatty acid composition (Yakan and Ünal, 2010).
The relationships between genes and yield characteristics in farm animals have been intensively investigated, with one area being the levels of expression of genes that affect meat yield and quality. in particular, many genes related to lipid metabolism have been identified. These include genes involved in controlling the energy that lambs take from their feed, which can affect the composition of fatty acids in the body, and genes involved in regulating lipid metabolism, such as SREBP-1c (sterol regulator element binding protein 1c), PPAR (peroxisome proliferator-activated receptor gamma), and FASN (fatty acid synthase) (Deng et al., 2016; Fernández-Alvarez et al., 2011; Yakan et al., 2021). Accordingly, the present study examined the meat quality characteristics in Lalahan lambs and the levels of expression of three genes (SREBP-1c, PPARγ, and FASN) known to affect the composition of fatty acids at three different slaughter weights (35, 40, and 45 kg).
2.1 Animal material
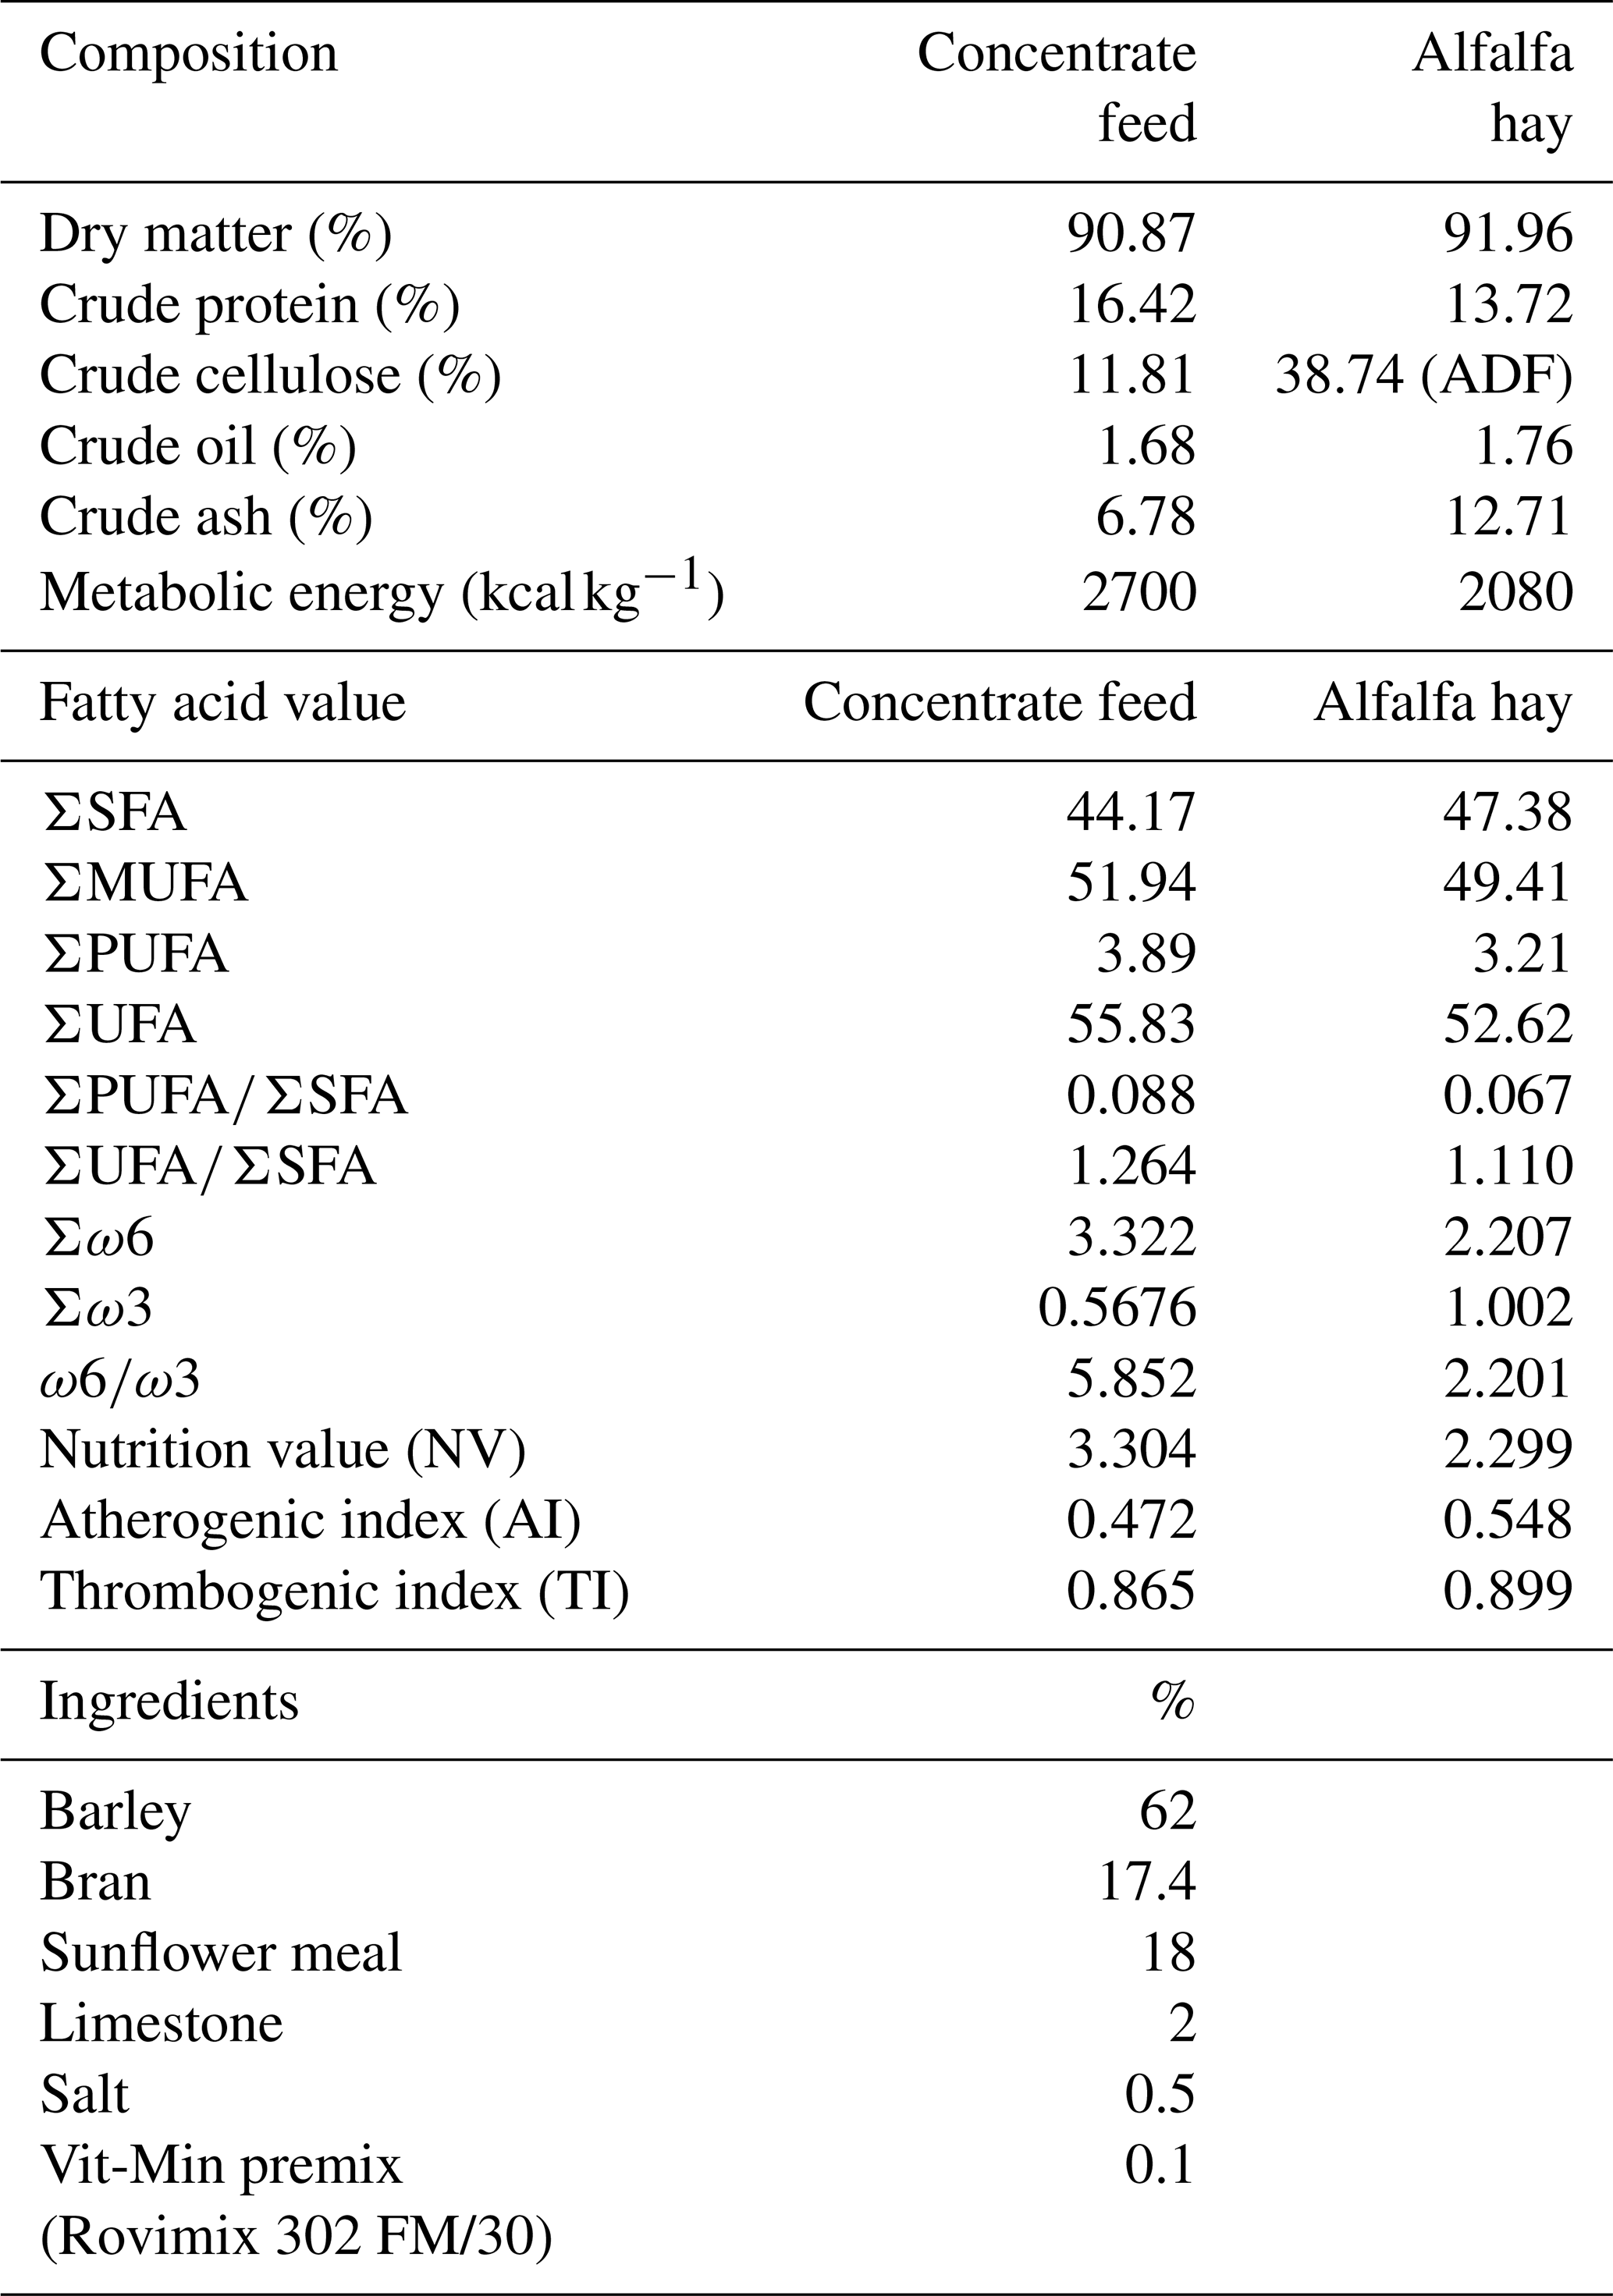
The animal material was male Lalahan sheep genotype lambs raised in the Sheep and Goat Breeding Unit of the Lalahan International Animal Research and Training Center Directorate. Thirty-six male sheep, weaned at 90 d and with starting weights of approximately 20 kg, were randomly divided into three groups. The lambs were then fed intensively according to the schedule in Table 1 until they reached approximately the target living weight for each group, namely 35 (Gr35), 40 (Gr40), and 45 kg (Gr45). From each group of 12, 6 lambs were selected for slaughter (total of 18 lambs divided into three groups). Although the animals selected for slaughter represented the average live weight of the groups, they were considered to be a limitation of the study. Feeding was stopped for 12 h before slaughtering, but access to water was allowed until slaughtering. Each animal was weighed immediately before slaughtering.
Table 1Nutrient content of concentrate feed and alfalfa hay.
NV .
AI .
TI .
2.2 Meat quality analyses
To determine meat quality, the pH, color, water retention capacity, cooking loss, and fatty acid composition characteristics were measured, as detailed below.
The pH was measured with a portable pH meter (Mettler Toledo SG2) from Musculus longissimus dorsi lumbalis (MLD) and Musculus semimembranosus (MSM) samples using a glass electrode (Inlab 427). Measurements were taken from meat samples stored at +4 °C at 15 and 60 min and 24 h after slaughtering.
Meat color was measured using a colorimeter (Konika Minolta CR-400 Chromometer) using the L∗, a∗, and b∗ systems (Honikel, 1998). Measurements were taken from the fatless parts of the cut surfaces of MLD and MSM samples at 15 and 60 min and 24 h after slaughter. After the carcasses were aged for 24 h, prior to instrumental color measurements, the freshly cut meat surfaces were allowed to undergo the “bloom” process for 30 min by exposing them to atmospheric oxygen at 4 °C.
Water-holding capacity was measured at 24, 48, and 72 h after cutting. A 5 g MLD meat sample was divided into five pieces, and each piece was weighed using an electronic scale, sensitive to 0.001 g. Each piece was then placed between two layers of glass and filter paper, and a weight of 2250 g was placed on top for 5 min. The meat pieces were then removed and reweighed. The sample's percentage water-holding capacity was calculated as the difference between the weight before and after compression (Barton-Gade et al., 1994).
Cooking loss was measured 24 and 48 h after slaughter. A 50 g MLD meat sample was weighed on an electronic scale sensitive to 0.001 g. The sample was placed in a vacuum-packed plastic bag and cooked at 80 °C for 1 h in a water bath. The meat was then kept at +4 °C for 12 h before being removed from the bag, thoroughly dried with a paper towel, and reweighed. The sample's percentage cooking loss was calculated as the difference in weight before and after cooking (Honikel, 1998).
Meat samples of 50 g were taken from tail fat, liver tissue, and MLD before freezing at −18 °C. Fat samples were extracted from each sample using the Soxhlet Extraction method by AOAC (method no. 960.39). The extracted fats were then stored at −20 °C until analyzed. The fatty acids were converted into fatty acid methyl esters (FAMEs) using 0.5 N methanolic NaOH and 20 % methanolic boron trifloride (BF3). The FAMEs were isolated in n-heptan, determined using a gas chromatograph (Schimadzu GC-2025) and equipped with a Rt-2560 Restek column with dimensions. The column temperature program was started at 100 °C for 2 min before being increased to 250 °C at a rate of 4 °C min−1 for 15 min. The carrier gas was hydrogen, while the gas flow rate was 1.2 mL min−1, and the split ratio was set at 50:1. The injection was 1 µL using an automatic sampler. Both the injector and detector temperatures were set at 250 °C. The results for the individual fatty acids in shown the chromatograms are expressed as a percentage of the reference standard (Restek FAME Mix).
2.3 Gene expression analysis
For the gene expression analyses, tissue samples of 1 g each were taken from the MLD, liver, and gluteal fat (through the gluteal muscle) and quickly placed in nuclease-free tubes, frozen in liquid nitrogen, and stored at −86 °C. The RNA was then isolated using the Trizol method (Rio et al., 2010) to measure the expression levels of the SREBP-1c, PPARγ, and FASN genes in each sample. The purity and concentration levels of the nucleic acids in the isolated RNA samples were evaluated with a Merinton-SMA 1000 device. The RNA quality of each sample was checked via the 28S and 18S bands in 1 % agarose gel electrophoresis (100 V and 25 min). RNA isolation was repeated for each sample until the appropriate purity, concentration, and non-integrity were achieved. To eliminate genomic DNA contamination before cDNA synthesis, the samples were treated using DNA digestion processes (DNase I, RNase free, Thermo Fisher Scientific, USA, cat. no. 18068015). cDNA synthesis was then conducted using a high-capacity cDNA reverse transcription kit (Thermo Fisher Scientific, USA, Cat No.: 4368814). The post-reaction samples were completed to 200 µL in nuclease-free water and stored at −20 °C until the analyses.
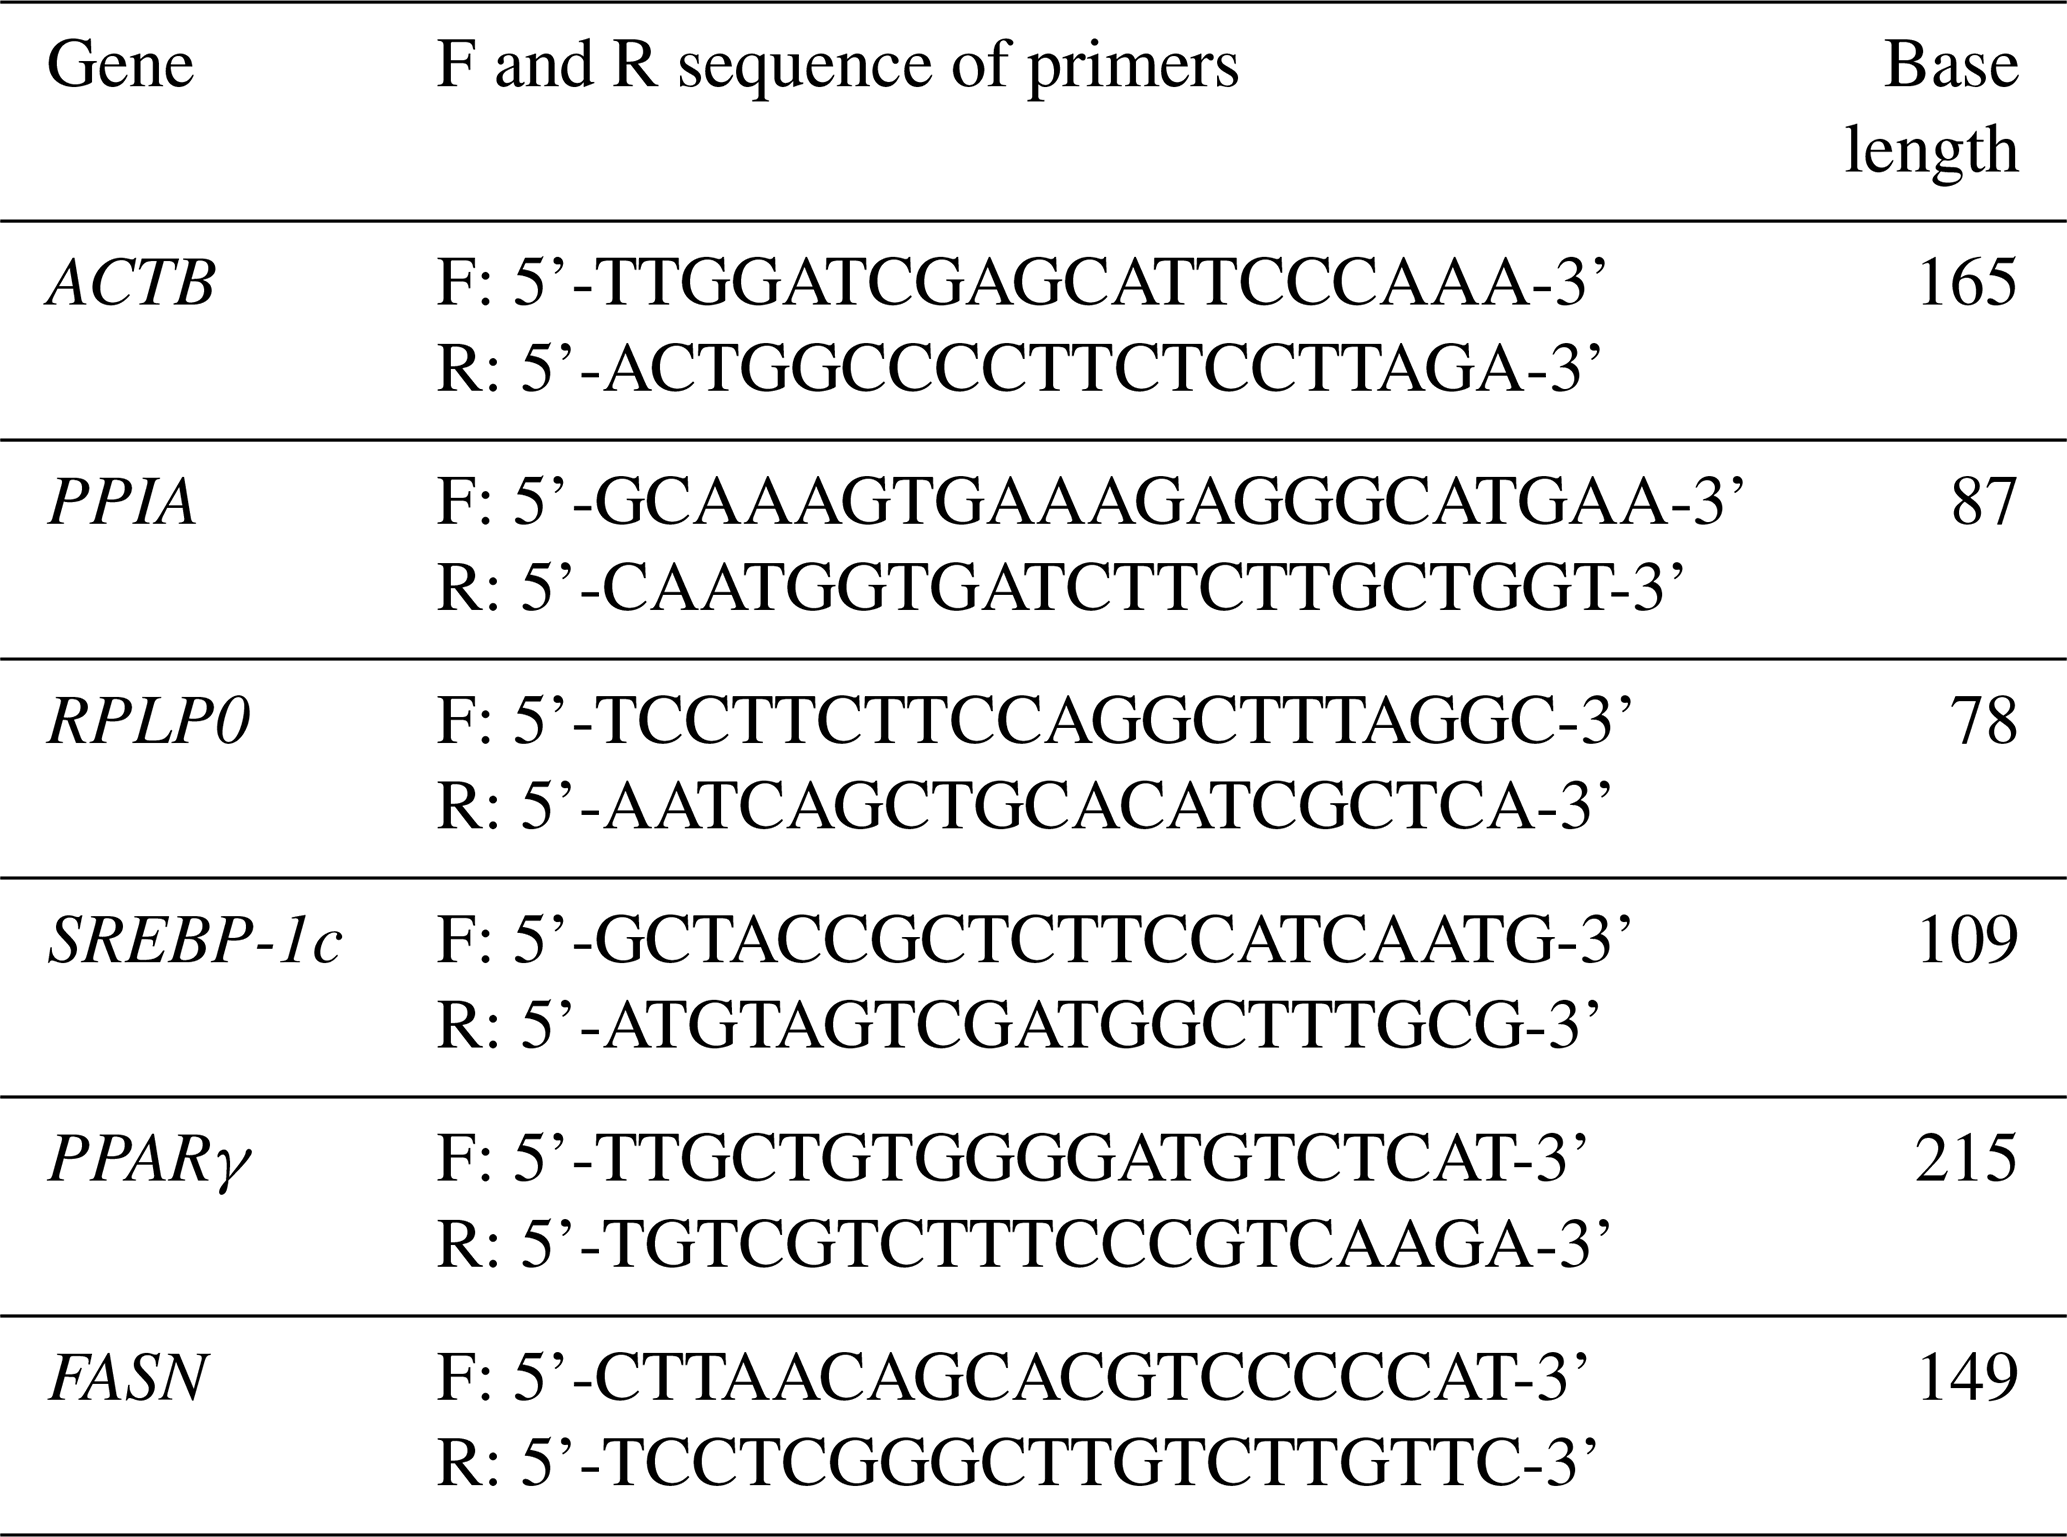
Amplification of the SREBP-1c, PPARγ, and FASN genes in the liver, MLD, and gluteal fat tissue samples was performed using real-time PCR (Rotor Gene Q, Qiagen). For gene amplification, a kit was used containing SYBR Green I paint (Power SYBR green PCR Master, Thermo Fisher Scientific, USA, cat no.: 4368702). Each example was duplicated. The RT-qPCR reaction comprised 40 cycles of 15 s at 95 °C, 60 s at 60 °C, and 30 s at 72 °C. The ACTB and PPIA genes were used as housekeeping genes for the liver and MLD muscle tissue samples, respectively. Table 2 presents the sequences of the target gene and housekeeping genes. Product control after the real-time PCR application was performed using a 50 bp DNA ladder (Thermo Fisher Scientific, cat. no.: SM0371) in 1.5 % agarose gel electrophoresis (100 V and 45 dk).
Table 2Forward (F) and reverse (R) sequence of primers∗.
∗ The primers were designed by authors.
2.4 Statistical analysis
Statistical analyses were performed using the SPSS 23.0 package program. Descriptive statistics for each variable were calculated and presented as mean ± standard error of mean (SEM). Before the significance tests, the variables were evaluated in terms of normality and homogeneity of variance using the Shapiro–Wilk and Levene's tests, respectively. The significance of the differences in meat quality characteristics among the three slaughter weight groups was determined using the one-way ANOVA and Tukey multiple comparison tests. The Bonferroni correction was applied after ANOVA to adjust p values for multiple comparisons. While the geometric means were determined for the housekeeping genes, the expression levels of the studied genes were calculated with the 2-ΔΔCt method and presented as fold change (Livak and Schmittgen, 2001) and compared to the Gr35 as a control group. A probability value of less than 0.05 was considered to be significant in all of the analyses.
3.1 Meat quality characteristics
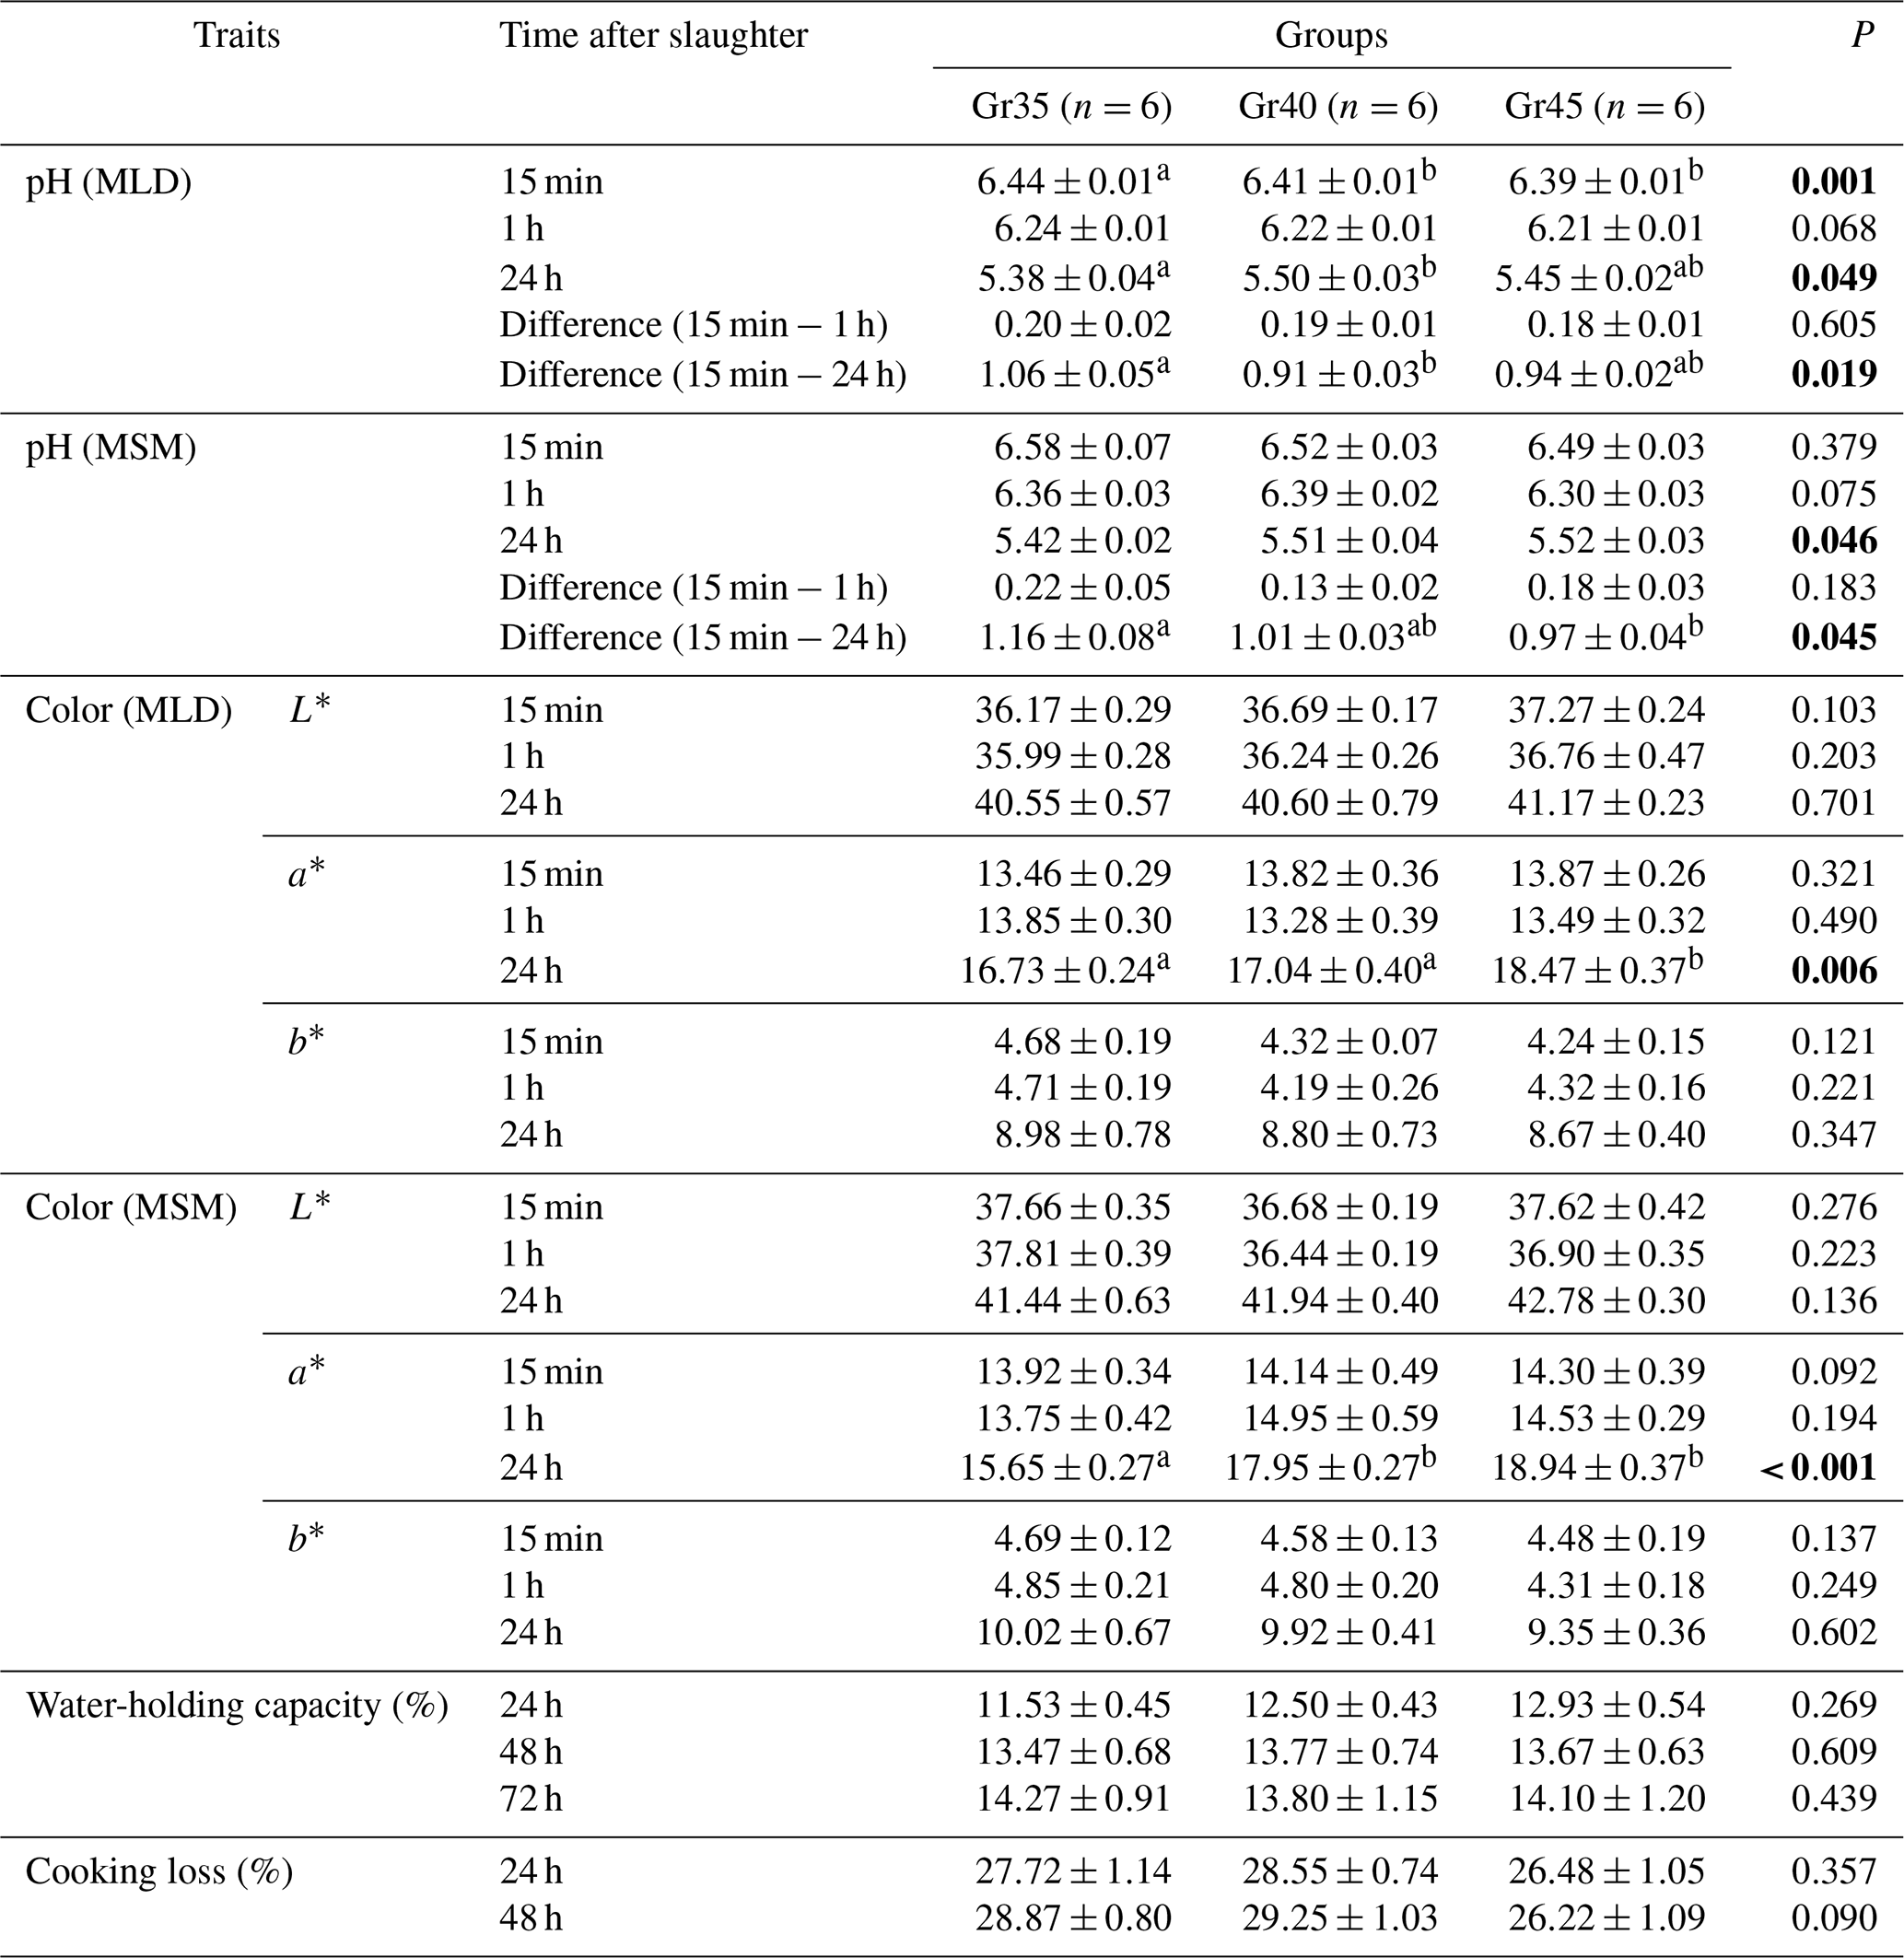
Table 3 presents the results of the meat quality analysis. For the MLD muscle, the pH values in the three slaughter weight groups (Gr35, Gr40, and Gr45) were significantly different 15 min after slaughter (6.44±0.01, 6.41±0.01, and 6.39±0.01, respectively) (P<0.001) and 24 h after slaughter (5.38±0.04, 5.50±0.03, and 5.45±02.0, respectively) (P=0.049). In terms of color, 24 h after slaughtering, the L∗ and b∗ values for both the MLD and MSM samples were similar across all three groups, while the a∗ values showed significant differences in both the MLD (P=0.006) and MSM (P<0.001) groups. Neither water-holding capacity (11.53 %–14.27 %) nor cooking loss (26.22 %–29.25 %) varied significantly between groups.
Table 3Meat quality traits in experimental groups (X±Sx). Bold font indicates statistical significance.
a,b Means with different letters in rows differ significantly (P<0.05).
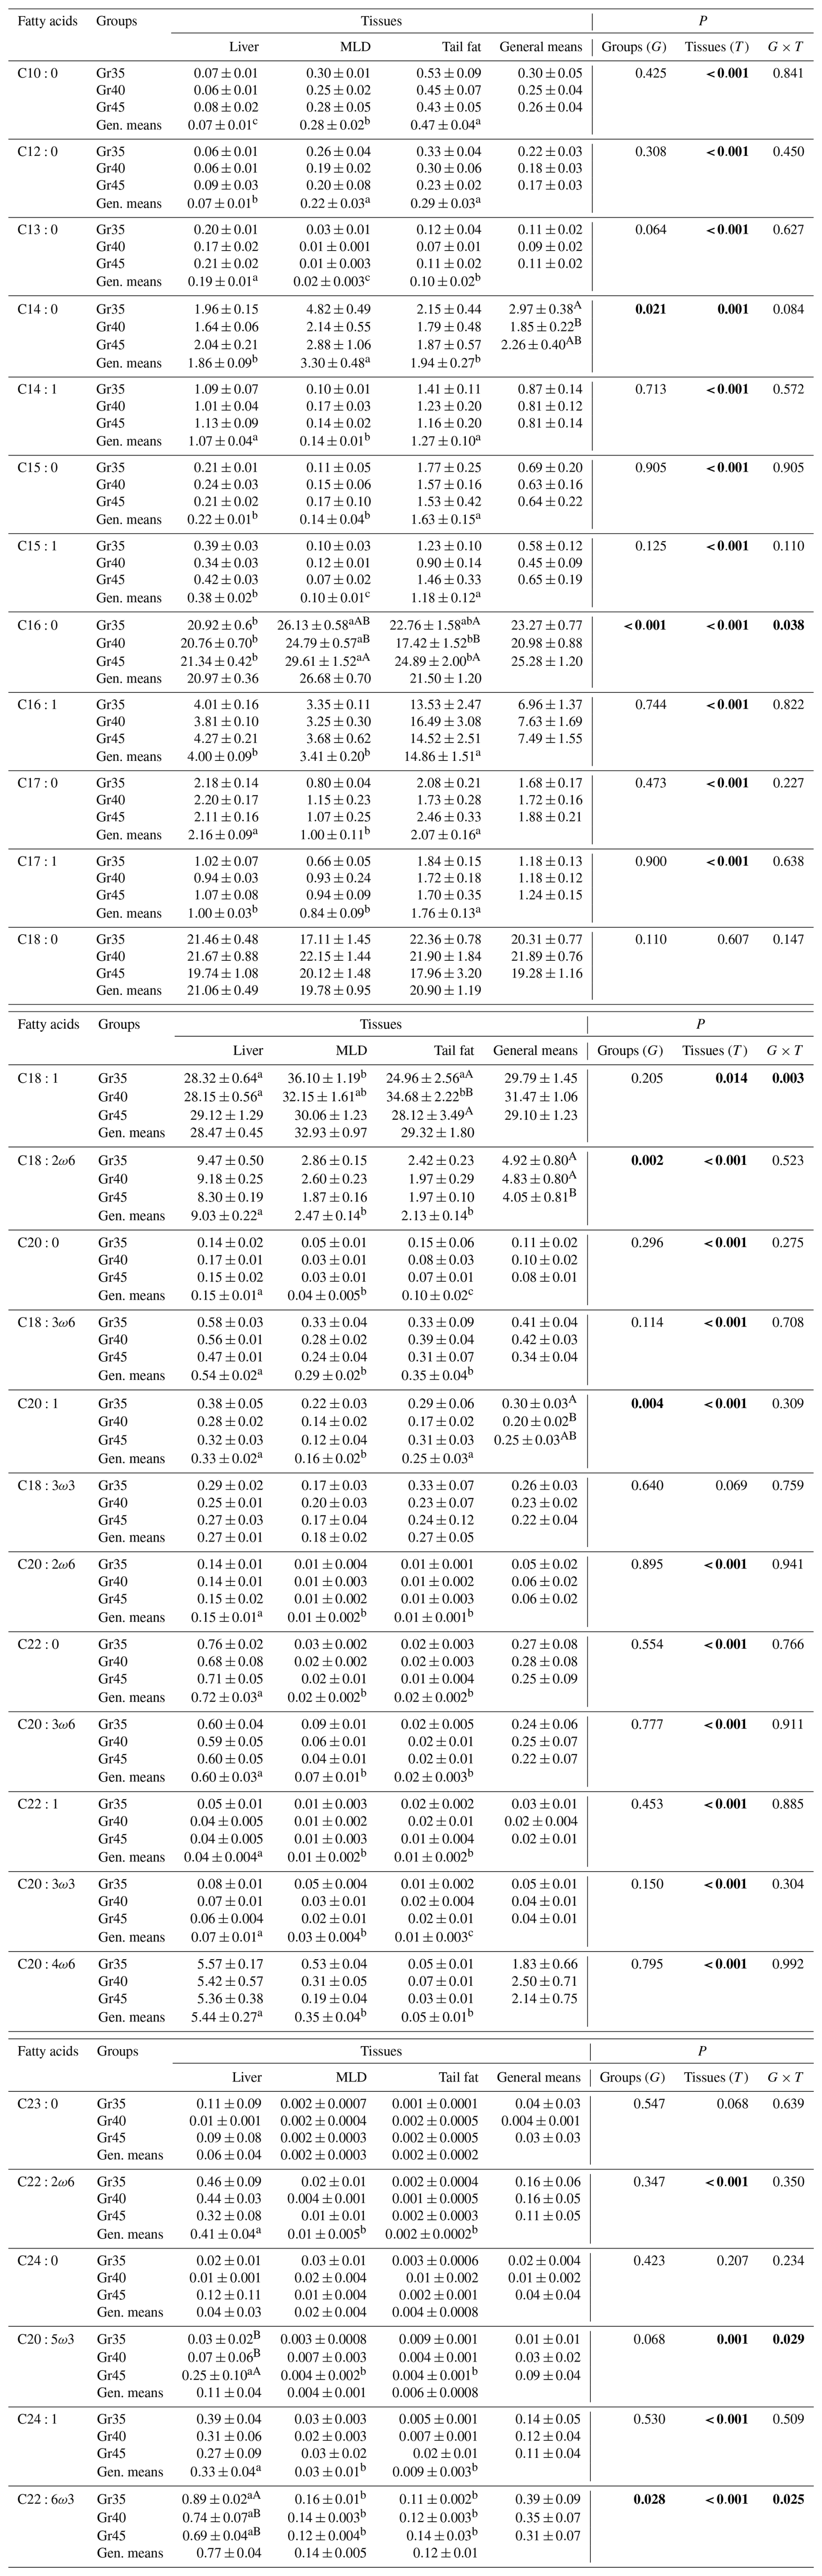
Table 4 presents the mean values for fatty acid compositions for the different tissues across the three groups. Fatty acid composition varied significantly by tissue type (liver, MLD, and tail fat) (P<0.001, P<0.01, and P<0.05, respectively), with the exception of C18:0, C18:3ω3, C23:0, and C24:0. Slaughtering weight had a significant effect on the ratio of C14:0 (P<0.05), C16:0 (P<0.001), C18:2ω6 (P<0.01), C20:1 (P<0.01), and C22:6ω3 (P<0.05) but not on the other fatty acids. The ratio of total unsaturated fatty acids varied significantly for all three tissue types across the three slaughter weight groups in liver at 51.91 %±0.64 %, 52.34 %±1.46 %, and 53.12 %±1.47 %, respectively; in MLD at 50.34 %±1.31 %, 49.08 %±1.29 %, and 45.61 %±1.30 %, respectively; and in tail fat at 47.73 %±1.73 %, 54.67 %±1.57 %, and 50.42 %±4.29 %, respectively. Table 5 presents the sum and index values for the meat quality characteristics across the three groups. While the effect of tissue type was found to be significant for all characteristics at various levels of statistical significance (P<0.05, P<0.01, and P<0.001), the group × tissue interaction showed significant differences for only the NV and TI values (P=0.001 and P=0.035, respectively).
Table 4Means of fatty acid compositions in experimental groups and different tissues (%) (X±Sx). Bold font indicates statistical significance.
Means with different letters in rows differ significantly (P<0.05).
A,B Means with different letters in columns differ significantly (P<0.05).
Table 5Sums and ratios based on fatty acid in experimental groups and different tissues (%) (X±Sx). Bold font indicates statistical significance.
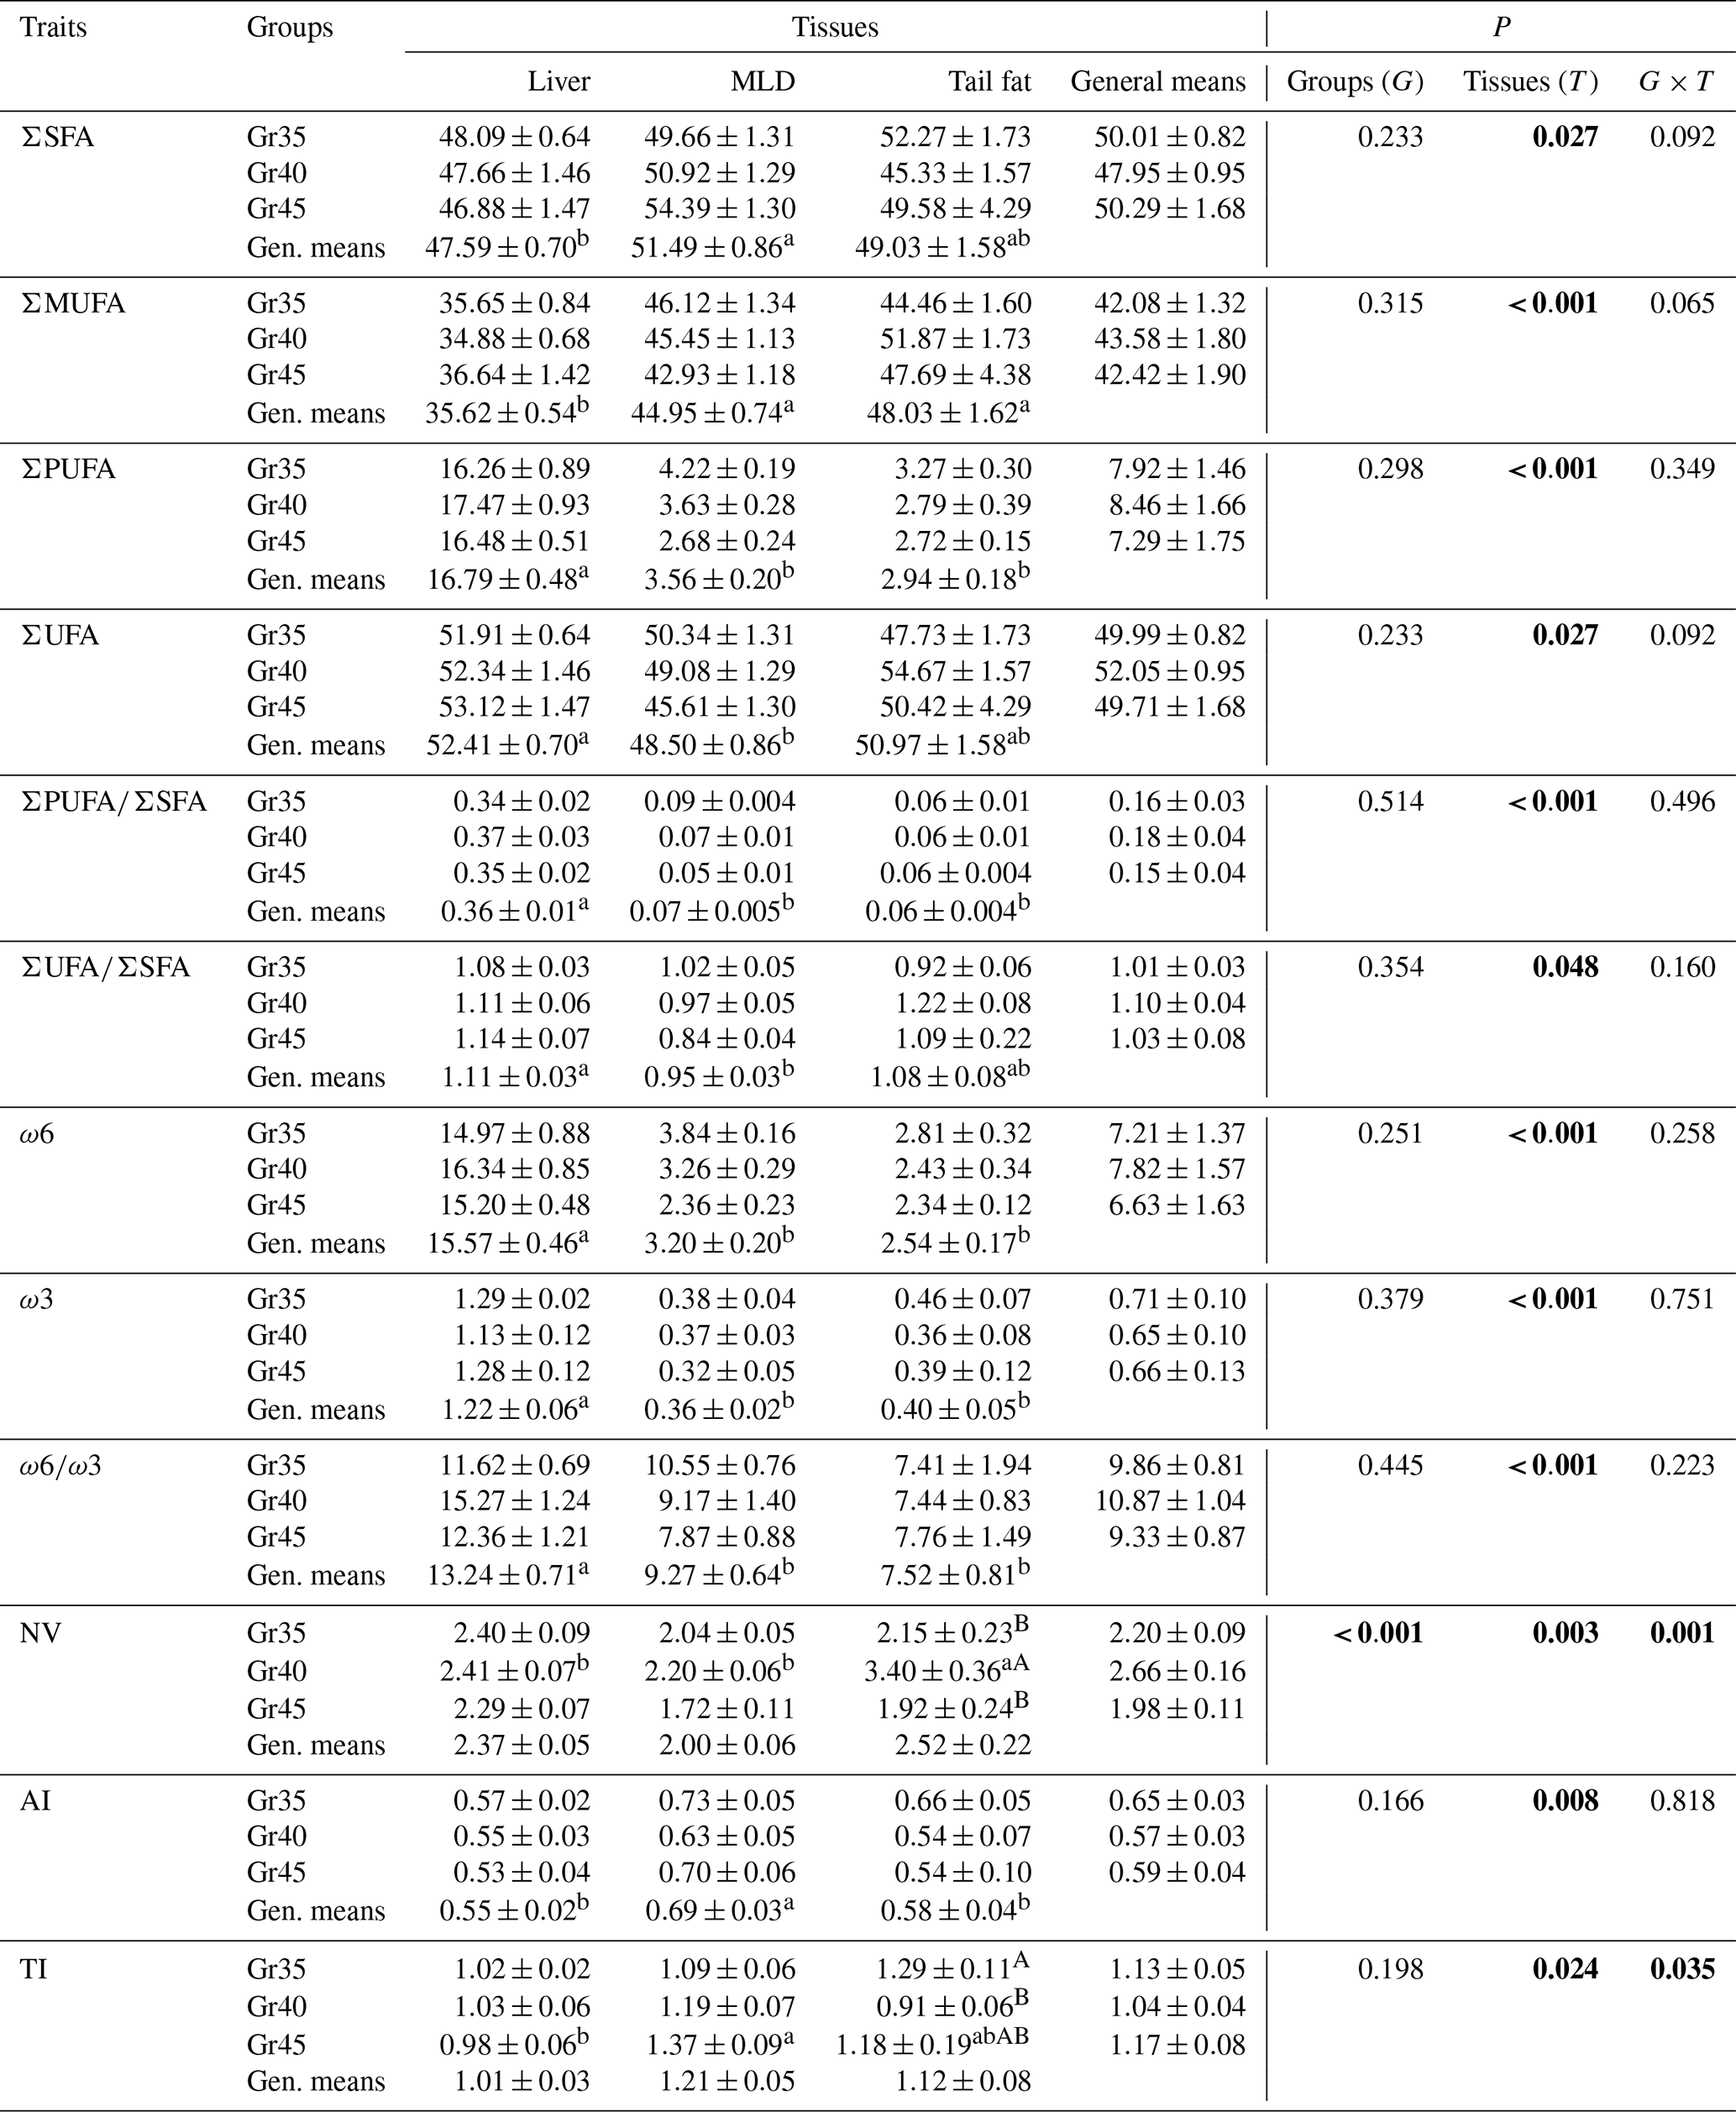
a,b Means with different letters in rows differ significantly (P<0.05).
A,B Means with different letters in columns differ significantly (P<0.05).
NV .
AI UFA.
TI .
3.2 Gene expression
The RNA isolates from liver (; concentration 713.18±19.55 ng µL−1), MLD muscle (; concentration 555.88±33.29 ng µL−1), and gluteal fat (; concentration 555.46±37.32 ng µL−1) were sufficiently pure and concentrated for cDNA synthesis and gene expression analysis.
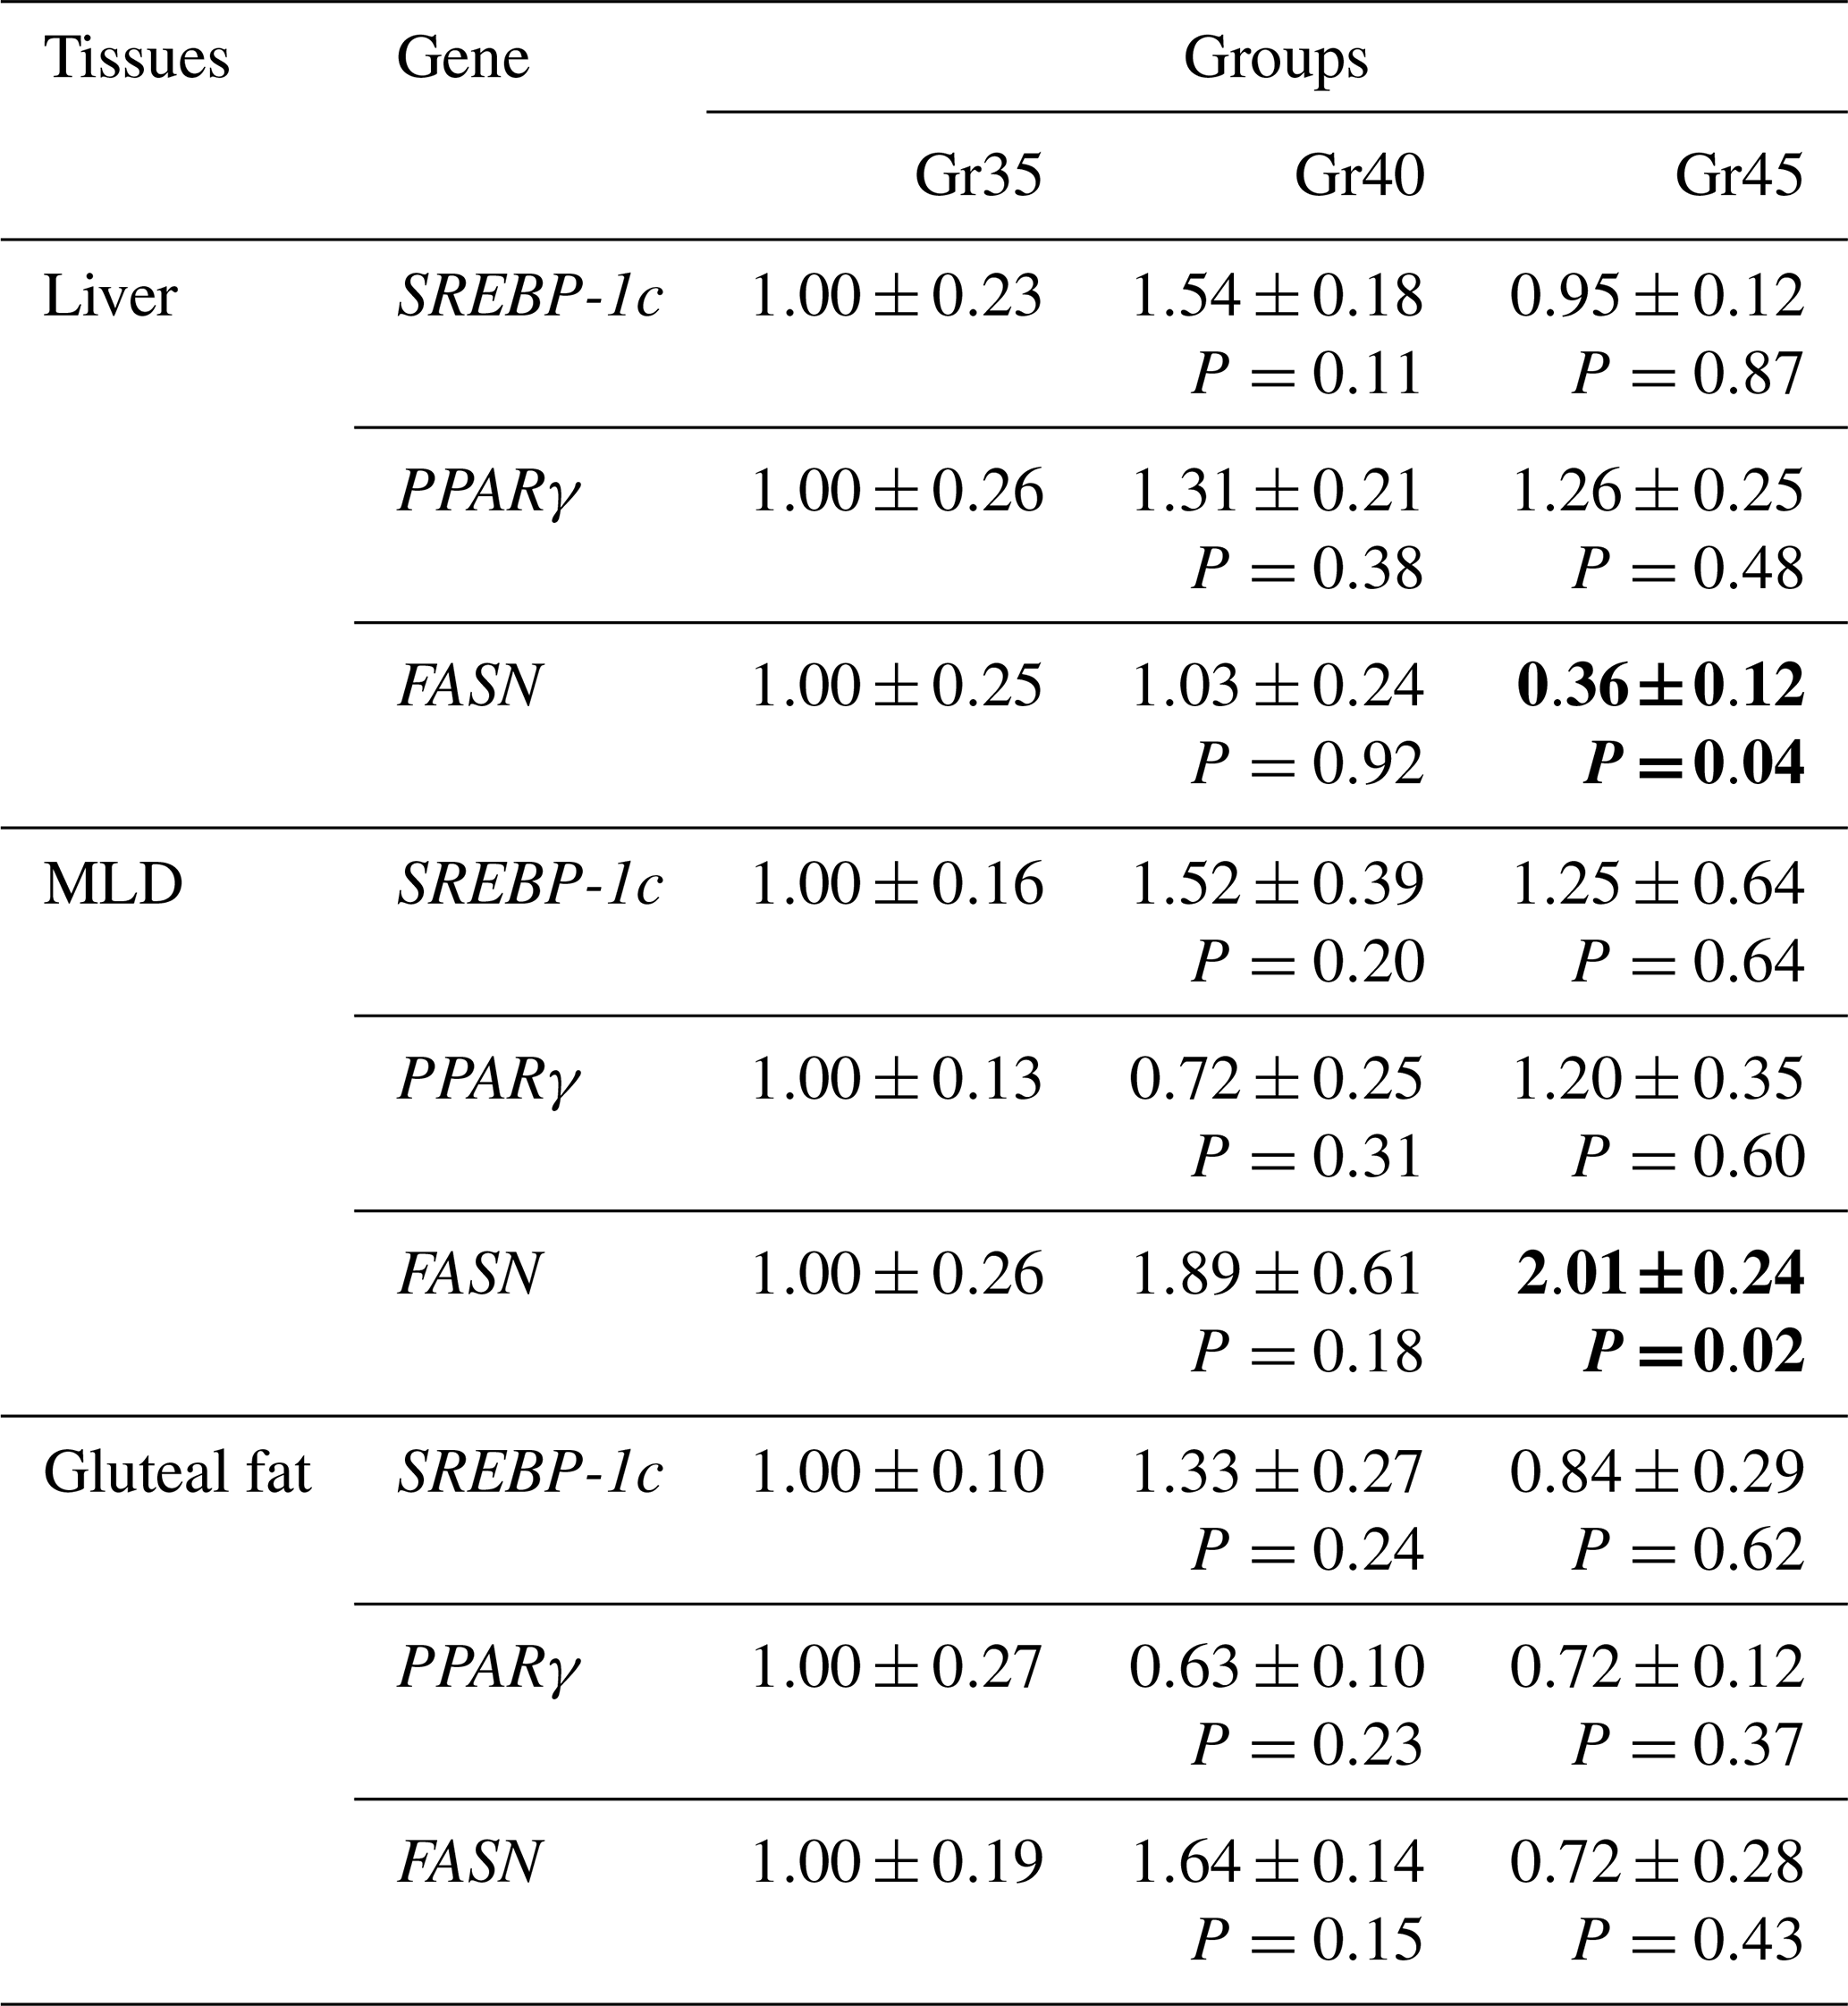
Table 6 presents the expression values of the target genes in liver and MLD muscle tissue for each slaughter weight group (Gr35, Gr40, and Gr45). In liver tissue, SREBP-1c and PPARγ gene expression did not differ significantly across groups. For FASN, no statistically significant increase in gene expression was observed in any of the three tissues (liver, MLD, and gluteal fat) in the Gr40 group; however, for Gr45, FASN expression in the liver was statistically significantly downregulated compared to the Gr35 group (P=0.04). In MLD muscle tissue, while SREBP-1c and PPARγ gene expression did not show a statistically significant difference between groups, a statistically significant difference was observed in FASN expression (P<0.02).
Table 6Target gene expression of experimental groups (X±Sx). Bold font indicates statistical significance.
4.1 Meat quality characteristics
One of the most important factors affecting the taste, tenderness, and juiciness of meat is pH, which should ideally range between 5.50 and 5.80 in the 24 h after slaughtering to yield high-quality meat (Mercan et al., 2022). Meat pH values decrease after slaughter, given appropriate storage conditions, which ensures that the meat becomes more tender and juicy, thereby improving its quality.
For the Lalahan genotype lambs used in the present study, the MLD pH values in the Gr35, Gr40, and Gr45 groups after 15 min (6.44, 6.41, and 6.39, respectively), 1 h (6.24, 6.22, and 6.21, respectively), and 24 h (5.38, 5.50, and 5.45, respectively) conform to normally accepted values for these measurement times (Ferguson and Warner, 2008; Mercan et al., 2022; Yakan and Ünal, 2010). That is, the pH values measured in the MLD and MSM muscles at different slaughtering weights decreased as the time after slaughtering increased. The low pH values in all three groups 24 h after slaughtering were similar across the three groups for both MLD (1.06, 0.91, and 0.94, respectively) and the MSM (1.16, 1.01, and 0.97, respectively).
In the present study, the fall in pH over time was smaller as the animals' slaughter weight increased. However, previous findings vary regarding the effect of slaughter weight on pH. As in the present study, several studies reported smaller post-slaughter falls in meat pH in lambs of various breeds with higher slaughter weight (Cañeque et al., 2005; Dıaz et al., 2002), whereas other studies of several Spanish breeds and Merino sheep reported the opposite (Martínez-Cerezo et al., 2005; Tejeda et al., 2008).
To test the effect of slaughter weight on meat color in MLD and MSM muscles, three color coordinates (L∗, a∗, b∗) were measured at three times after slaughter (15 min and 60 and 24 h). The only significant effect of slaughter weight on these coordinates was for a∗ (redness) (P<0.01 for MLD; P<0.001 for MSM), which increased with slaughter weight, whereas L∗ (brightness) and b∗ (yellowness) did not vary significantly. Regarding the effect of time on meat color, L∗, a∗, and b∗ all increased with time after slaughter. The increase in redness observed in the present study is consistent with previous reports showing that myoglobin concentration increases with animal age and physiological maturity. In a large commercial study involving more than 8000 lambs, Calnan et al. (2016) demonstrated that muscle characteristics associated with animal maturity, particularly myoglobin concentration, are major determinants of fresh lamb color. Although ultimate pH exerted an important influence on redness, increasing animal maturity was also associated with changes in muscle pigment characteristics that contribute to darker and redder meat. A review by Prache et al. (2022) further emphasized that meat color is affected by several intrinsic factors, including animal age, muscle fiber type, and myoglobin concentration. Light suckling lambs typically possess low myoglobin concentrations and therefore produce paler meat, whereas increasing biological age results in progressive accumulation of myoglobin and enhanced redness, particularly during the early stages of postnatal growth.
Water release from meat after slaughtering is increased by the contractions in muscle cells and mobilization of water in extracellular cavities due to proteolysis. In the present study, slaughtering weight had no significant impact on water-holding capacity after 24, 48, or 72 h, although percentages increased with time at 24 h (11.53 %–12.93 %), 48 h (13.47 %–13.77 %), and 72 h (13.80 %–14.27 %). These findings are similar to those reported by Yakan and Ünal (2010) for Bafra lambs. The water-holding capacity of MLD muscle at 24 h in the present study was similar to that (12.21 %) reported for lambs slaughtered at 42 kg (Ekiz et al., 2009) but higher than the percentages reported for MLD muscle in Akkaraman, Bafra, and Bafra × Akkaraman F1 lambs slaughtered at 34 and 42 kg (Yaranoğlu and Özbeyaz, 2019).
Cooking loss in meat can be influenced by cooking method, temperature, length, and muscle type. In particular, higher temperatures and longer cooking times increase cooking loss due to denaturation of tightening muscle fibers and a reduction in intercellular gaps. Approximately 70 %–80 % of cooking loss is caused by fat removal during cooking (Santos et al., 2007; Bonvillani et al., 2010). In the present study, slaughtering weight had no significant impact on 24 or 48 h cooking losses. There was also no significant difference in cooking loss if the meat was cooked 24 or 48 h after (26.48 %–28.55 % and 26.22 %–28.87 %, respectively). Similar findings were reported for Bafra (Yakan Ünal, 2010b), Akkaraman, Bafra, and Bafra × Akkaraman F1 lambs (Yaranoglu and Özbeyaz, 2019).
Fatty acid composition varies in different tissues of the body depending on factors such as breed or genotype, nutrition, slaughtering weight, and age (Erol and Ünal, 2021; Yakan et al., 2024). The present study examined fatty acid composition in liver, MLD, and tail fat tissues. MLD fatty acid composition has been widely studied. In our study, we also studied MLD composition in liver and tail fat tissue. However, no study has investigated fatty acid profiles in liver in Turkish indigenous sheep breeds, and there is only limited research on tail fat (Ateş et al., 2025; Tüfekci et al., 2021).
In the present study, the most prevalent fatty acid across all three slaughter weight groups and tissues was oleic acid (C18:1), followed by palmitic acid (C16:0) and stearic acid (C18:0). Slaughter weight had a significant effect on the prevalence of C14:0, C16-0, C18:2ω6, C20:1, and C22:6ω3. In all tissues studied, a higher slaughter weight was associated with higher palmitic acid (C16:0) percentages, particularly in the Gr45 group, but lower C18:2ω6 and C22:6ω3 percentages. Tissues with more than 1 % total fatty acids had the highest levels of C14:0, C18:0, and C18:2ω6 in liver tissue, the highest levels of C14:0, C16:0, and C18:1 in MLD tissue, and the highest levels of C14:1, C15C:0, C15:1, C16:1, and C17:1 in tail fat.
Increasing slaughter weight did not significantly affect the ratio of total saturated fatty acids (SFAs), total single unsaturated fatty acids (PUFAs), or total polyunsaturated fatty acids (PUFAs). SFA and unsaturated fatty acid (UFA) ratios were similar across Gr35, Gr40, and Gr45 (1.01, 1.10, and 1.03, respectively). While this is a positive finding in terms of nutrition, the ratios in all three slaughter weight groups were lower than 0.4 (0.16, 0.18, and 0.15, respectively), which is the recommended minimal ratio (Jimenez-Colmenero et al., 2017), indicating a nutritional disadvantage in these animals. However, previous findings for many native sheep genotypes have also reported ratios of 0.1–0.2 (Yakan and Ünal, 2010; Yaranoglu and Özbeyaz, 2019).
SFA, MUFA, and PUFA levels varied significantly by tissue type (liver, tail fat, and MLD). SFAs the lowest levels (47.59 %, 49.03 %, and 51.49 %, respectively), followed by UFAs (52.41 %, 50.97 %, and 48.50 %, respectively). For , the liver sample value (0.36) was close to the recommended level (0.4), whereas the MLD and tail fat values were low (0.07 and 0.06, respectively). The UFA SFA ratios were similar across the three tissue types (1.11, 0.95, and 1.08, respectively).
In human nutrition, fatty acids have been assessed using various criteria, including , nutritive value (NV), atherogenic index (AI), and thrombogenic index (TI) (HMSO, 1994). In the present study, the ratio exceeded the recommended value in all three slaughter weight groups (9.86, 10.87, and 9.33, respectively). Similarly, the ratios exceeded the recommended value in liver, MLD, and tail fat (13.24, 9.27, and 7.52, respectively).
Nutritional value (NV) is calculated from the ratio of the three most commonly found fatty acids (). Of these, palmatic acid (C16:0) increases blood cholesterol levels, whereas oleic acid (C18:1) reduces it. Stearic acid (C18:0) is a saturated fat but does not affect cholesterol levels. C18:1 is also obtained from C18:0 during metabolism (Banskalieva et al., 2000). NV and the NV ratio varied significantly across the three slaughter weight groups, being highest in Gr40 (2.66), followed by Gr35 (2.20) and Gr45 (1.98). NV also differed significantly across tissue types, with the highest level in liver samples (2.37), followed by tail fat (2.52) and MLD (2.00).
While AI is used to assess atherosclerosis risk, TI is used for thrombosis risk. Both should be less than 1 (Ulbricht and Southgate, 1991). In the present study, slaughter weight had no significant effect on AI or TI values and so was insignificant. AI values were below 1 in all three groups (0.65, 0.57, and 0.59, respectively), while TI values were close to 1 (1.13, 1.04, and 1.17, respectively), which are positive findings in terms of nutrition. AI and TI ratios varied significantly by tissue type. AI values in liver, MLD, and tail fat were below 1 (0.55, 0.69, and 0.58, respectively), while TI values were close to 1 (1.01, 1.21, and 1.12, respectively).
4.2 Gene expression
Energy metabolism is controlled by complex molecular mechanisms that involve a large number of genes. The primary organ for anabolic and catabolic metabolism is the liver (Deng et al., 2018). SREBP-1c is a key transcription factor in carbohydrate and lipid metabolism (Fernández-Alvarez et al., 2011), specifically in de novo lipogenesis in liver tissue. In the present study, SREBP-1c mRNA levels in the liver samples did not vary significantly across groups, indicating that its activity was similar regardless of slaughter weight.
As with SREBP-1c, the gene expression level of PPARγ, another gene studied for its lipogenesis-associated activity, did not change significantly across slaughtering weights. In ruminants, PPARγ activity is important for glucose and lipid absorption and transportation (Brooks et al., 2015; Lehrke and Lazar, 2005), while PPARγ regulates the activity of many genes associated with lipogenesis, fatty acid absorption, transportation, extension, and hydrolysis (Deng et al., 2018). The similar levels of these transcription factors across the three weight groups may be due to the balance factor in lipogenesis–lipolysis regulation in the liver tissue at different slaughter weights (Yakan et al., 2018).
The FASN is responsible for the synthesis of short-, medium-, and long-chain fatty acids, and this gene, which affects saturated fatty acid levels, plays a role in the formation of meat quality (Izadi et al., 2016; Yakan et al., 2021). In the present study, FASN expression was higher for Gr40 tissues than for Gr35 and was upregulated 2-fold in Gr45 animals. Deng et al. (2018) reported that C20:5ω3 fatty acid levels in the liver increase as the slaughter weight increases. Upregulation of FASN, which is closely associated with fatty acid metabolism, indicates that there are significant changes in fatty acid metabolism in the liver with slaughter weight. Although the animals experienced similar environmental conditions, particularly diet, these differences across slaughter weight groups in gene expression and fatty acid profiles may be associated with differences in weight gain and growth.
SREBP-1c and PPARγ gene expression levels in muscle and liver tissue did not differ significantly across weight groups. However, FASN gene expression levels in liver were downregulated approximately 3-fold in the Gr45 group. It is known that anabolic-active genes vary significantly depending on growth factors in the body. Reduced FASN gene expression in muscle tissue has been associated with higher growth, and so reduced expression of this gene may be linked to slower growth in the Gr45 animals. Furthermore, the relationship between FASN gene activity and fatty acid composition is important (Izadi et al., 2016). Our findings showed that, while muscle tissue fatty acid profile did not vary significantly across groups, there were significant differences in the ratio of saturated and unsaturated fatty acids.
The present study provides new information regarding the effects of slaughter weight on meat quality characteristics, fatty acid composition, and the expression of lipid-metabolism-related genes in Lalahan lambs. The results indicate that slaughter weight had limited effects on most meat quality traits but significantly influenced selected fatty acids and FASN expression. These findings contribute to a better understanding of lipid metabolism during growth in sheep and may support optimization of slaughter strategies in intensive lamb production systems. Nevertheless, direct comparisons with other breeds should be confirmed through studies conducted under identical experimental conditions. Given the conditions of the Central Anatolian Region, the Lalahan breed offers potential for high-quality meat production. A slaughter weight of 40 kg can be recommended as appropriate.
All data can be obtained from the corresponding author upon reasonable request.
RA: data curation, formal analysis, methodology, investigation. NÜ: conceptualization, methodology, investigation, project administration, writing (review and editing). AY: conceptualization, methodology, writing (original draft).
The contact author has declared that none of the authors has any competing interests.
This study was approved by the Local Ethics Committee for Animal Experiments of the Directorate of the International Center for Livestock Research and Education by Decision No. 173 dated 31 December 2020.
Publisher's note: Copernicus Publications remains neutral with regard to jurisdictional claims made in the text, published maps, institutional affiliations, or any other geographical representation in this paper. The authors bear the ultimate responsibility for providing appropriate place names. Views expressed in the text are those of the authors and do not necessarily reflect the views of the publisher.
The authors would like to thank TUBITAK (grant no. 120R006) for the financial support. This article is summarized from a part of the PhD thesis of the first named author.
This research has been supported by the Türkiye Bilimsel ve Teknolojik Araştırma Kurumu (grant no. 120R006).
This paper was edited by Steffen Maak and reviewed by Ömer Faruk Güngör and one anonymous referee.
Akçapınar, H., Atay, O., Koçak, S., and Aydogan, M.: Akkaraman, Sakız x Akkaraman ve Kıvırcık x Akkaraman melezleri (F1, G1) ile Kıvırcık ve Bafra koyunlarda canlıağırlık ve yapağıözellikleri, Lalahan Hayv. Araşt. Enst. Derg., 44, 13–22, 2004.
Ateş, C. T., Kaya, U., Karaaslan, İ., Özkan, H., and Yakan, A.: The Effect of Dietary Propylene Glycol on the Fatty Acid Composition of Three Fat Depots in Male Akkaraman Lambs, Vet. Med. Sci., 11, e70201, https://doi.org/10.1002/vms3.70201, 2025.
Banskalieva, V., Sahlu, T., and Goetsch, A. L.: Fatty acid composition of goat muscles and fat depots: a review, Small Ruminant Res., 37, 255–268, https://doi.org/10.1016/s0921-4488(00)00128-0, 2000.
Barton-Gade, P., Demeyer, D., Honikel, K., Joseph, R., Puolanne, E., Severini, M., Smulders, F., and Tornberg, E.: Final version of reference methods for holding capacity in meat and meat products recommended by an OECD working group and presented in the 39th ICoMST in 1993, Proc. 40th ICoMST, Den Haag, the Netherlands, 28 August–2 September, Session V, O5, 1994.
Bonvillani A., Peña F., Domenech V., Polvillo O., Garcia P. T., and Casal J. J..: Carcass characteristics of Crillo Cordobes kid goats under an extensive management system: Effects of gender and liweweight at slaughter, Meat Sci., 86, 651–659, https://doi.org/10.1016/j.meatsci.2010.05.018, 2010.
Brooks, K. B., Burns, G. W., and Spencer, T. E.: Peroxisome proliferator-activated receptor gamma (PPARγ) regulates conceptus elongation in sheep, Biol. Reprod., 92, 49, https://doi.org/10.1095/biolreprod.114.123877, 2015.
Calnan, H., Jacob, R. H., Pethick, D. W., and Gardner, G. E.: Production factors influence fresh lamb longissimus colour more than muscle traits such as myoglobin concentration and pH, Meat Sci., 119, 41–50, https://doi.org/10.1016/j.meatsci.2016.04.009, 2016.
Cañeque, V., Díaz, M. T., Álvarez, I., Lauzurica, S., Pérez, C., and De la Fuente, J.: The influences of carcass weight and depot on the fatty acid composition of fats of suckling Manchego lambs, Meat Sci., 70, 373–379, https://doi.org/10.1016/j.meatsci.2005.02.003, 2005.
Dang, K. M. T., Wang, Z., Tian, W., Nie, H., Guo, Y., Wang, F., and Fan, Y.: Effects of perilla frutescens seed supplemented diet on fatty acid composition and lipogenic gene expression in muscle and liver of Hu lambs, Livest. Sci., 211, 21–29, https://doi.org/10.1016/j.livsci.2018.03.001, 2016.
Díaz, M. T., Velasco, S., Cañeque, V., Lauzurica, S., de Huidobro, F. R., Pérez, C., González, J., and Manzanares, C.: Use of concentrate or pasture for fattening lambs and its effect on carcass and meat quality, Small Ruminant Res., 43, 257–268, https://doi.org/10.1016/S0921-4488(02)00016-0, 2002.
Ekiz, B., Yılmaz, A., Özcan, M., Kaptan, C., Hanoğlu, H., Erdoğan, İ., and Yalçıntan, H.: Carcass measurements and meat quality of Turkish Merino, Ramlıç, Kıvırcık, Chios and İmroz lambs raised under an intensive production system, Meat Sci., 82, 64–70, https://doi.org/10.1016/j.meatsci.2008.12.001, 2009.
Erol, H.: Lalahan koyunu, TİGEM Yayını, Ankara, 2013.
Erol, H. and Ünal, N.: Meat production traits of Angora goat 1: fattening, slaughter, and carcass characteristics of intact and castrated kids, Trop. Anim. Health Pro., 53, 142, https://doi.org/10.1007/s11250-021-02586-6, 2021.
Erol, H., Akçapınar, H., Özbeyaz, C., and Özdemir, P.: Lalahan koyununda (Kıvırcık x Akkaraman G1) döl verimi ve bazımorfolojik özelliklerin incelenmesi, Lalahan Hay. Araş. Ens. Derg., 57, 69–76, 2017.
Ferguson, D. and Warner, R. D.: Have we underestimated the impact of pre-slaughter stress on meat quality in ruminants?, Meat Sci., 80, 12–19, https://doi.org/10.1016/j.meatsci.2008.05.004, 2008.
Fernández-Alvarez, A., Alvarez, M. S., Gonzalez, R., Cucarella, C., Muntané, J., and Casado, M.: Human SREBP1c expression in liver is directly regulated by peroxisome proliferator-activated receptor α (PPARα), J. Biol. Chem., 286, 21466–21477, https://doi.org/10.1074/jbc.M110.209973, 2011.
HMSO: Nutritional aspects of cardiovascular disease, Report on Health and Social Subjects No. 46, Department of Health, London, 1994.
Honikel, K. O.: Reference methods for the assessment of physical characteristics of meat, Meat Sci., 49, 447–457, https://doi.org/10.1016/S0309-1740(98)00034-5, 1998.
Izadi, M. S., Naserian, A. A., Nasiri, M. R., Heravi, R. M., and Valizadeh, R.: Evaluation of SCD and FASN gene expression in Baluchi, Iran-Black, and Arman sheep, Rep. Biochem. Mol. Biol., 5, 33, 2016.
Jimenez-Colmenero, F., Reig, M., and Toldrá, F.: New approaches for the development of functional meat products, in: Advanced Technologies for Meat Processing, 2nd edn., CRC Press, USA, Chapter 11, ISBN 978-1498754606, 2017.
Lehrke, M. and Lazar, M. A.: The many faces of PPARγ, Cell, 123, 993–999, https://doi.org/10.1016/j.cell.2005.11.026, 2005.
Livak, K. J. and Schmittgen, T. D.: Analysis of relative gene expression data using real-time quantitative PCR and the 2−ΔΔCT method, Methods, 25, 402–408, https://doi.org/10.1006/meth.2001.1262, 2001.
Martínez-Cerezo, S., Sañudo, C., Panea, B., Medel, I., Delfa, R., Sierra, I., Beltrán, J., Cepero, R., and Olleta, J.: Breed, slaughter weight and ageing time effects on physico-chemical characteristics of lamb meat, Meat Sci., 69, 325–333, https://doi.org/10.1016/j.meatsci.2004.08.002, 2005.
Mercan, L., Cam, M. A., Olfaz, M., Kirikci, K., Tufekci, H., and Kilic, U.: Fatty acid profile and sensory properties of lamb meat from males of five indigenous breeds, Arch. Anim. Breed., 65, 341–352, https://doi.org/10.5194/aab-65-341-2022, 2022.
Santos, V. A. C., Silva, A. O., Cardoso, J. V. F., Silvestre, A. J. D., Silva, S. R., Martins, C., and Azevedo, J. M. T.: Genotype and sex effects on carcass and meat quality of suckling kids protected by the PGI Cabrito de Barroso, Meat Sci., 75, 725–736, https://doi.org/10.1016/j.meatsci.2006.10.003, 2007.
Prache, S., Schreurs, N., and Guillier, L.: Factors affecting sheep carcass and meat quality attributes, Animal, 16, 100330, https://doi.org/10.1016/j.animal.2021.100330, 2022.
Rio, D. C., Ares, M., Hannon, G. J., and Nilsen, T. W.: Purification of RNA using TRIzol (TRI reagent), Cold Spring Harb. Protoc., 6, 5439, https://doi.org/10.1101/pdb.prot5439, 2010.
Tejeda, J. F., Peña, R. E., and Andrés, A. I.: Effect of live weight and sex on physico-chemical and sensorial characteristics of Merino lamb meat, Meat Sci., 80, 1061–1067, https://doi.org/10.1016/j.meatsci.2008.04.026, 2008.
Tüfekci, H., Kırıkçı, K., Mehmet, C., Olfaz, M., Kılıç, Ü., and Mercan, L.: Determination of tail fat fatty acids profile in some local sheep breeds of Black Sea Region, Anadolu Tarım Bilim. Derg., 36, 221–226, https://doi.org/10.7161/omuanajas.839239, 2021.
Ulbricht, T. and Southgate, D.: Coronary heart disease: seven dietary factors, Lancet, 338, 985–992, https://doi.org/10.1016/0140-6736(91)91846-M, 1991.
Unal, N., Akcapinar, H., Atasoy, F., and Aytac, M.: Some reproductive and growth traits of crossbred genotypes produced by crossing local sheep breeds of Kivircik x White Karaman and Chios x White Karaman in steppe conditions, Arch. Anim. Breed., 49, 55–63, https://doi.org/10.5194/aab-49-55-2006, 2006.
Yakan, A. and Ünal, N.: Meat production traits of a new sheep breed called Bafra in Turkey 2: Meat quality characteristics of lambs, Trop. Anim. Health Pro., 42, 743–750, https://doi.org/10.1007/s11250-009-9482-9, 2010.
Yakan, A., Özkan, H., Şakar, A. E., Ünal, N., and Özbeyaz, C.: Gene expression levels in some candidate genes for mastitis resistance, milk yield, and milk quality of goats reared under different feeding systems, Turk. J. Vet. Anim. Sci., 42, 18–28, https://doi.org/10.3906/vet-1704-7, 2018.
Yakan, A., Özkan, H., Çamdeviren, B., Kaya, U., Karaaslan, İ., and Dalkıran, S.: Expression patterns of major genes in fatty acid synthesis, inflammation, and oxidative stress pathways from colostrum to milk in Damascus goats, Sci. Rep.-UK, 11, 9448, https://doi.org/10.1038/s41598-021-88976-0, 2021.
Yakan, A., Özkan, H., Kaya, U., Keçeli, H. H., Karaaslan, I., Dalkiran, S., and Özbeyaz, C.: The effects of the feeding duration of propylene glycol on major meat quality parameters and substantial proteins in the muscle of Akkaraman lambs, Meat Sci., 217, 109615, https://doi.org/10.1016/j.meatsci.2024.109615, 2024.
Yaranoglu, B. and Özbeyaz, C.: Quality characteristics and fatty acid profiles of Bafra, Akkaraman, and Bafra × Akkaraman F1 lamb meat, Turk. J. Vet. Anim. Sci., 43, 380–390, https://doi.org/10.3906/vet-1812-73, 2019.