
the Creative Commons Attribution 4.0 License.
the Creative Commons Attribution 4.0 License.
 | 02 Jun 2026
Genetic variability and associations of Trakehner and other horse populations in Lithuania
Alma Račkauskaitė
Rūta Šveistienė
Violeta Razmaitė
Virginija Jatkauskienė
Šarūnė Marašinskienė
To obtain genetic parameters relevant for the management of animal genetic resources, this study provides a comparative characterization of the Trakehner (TRAK) horse population in relation to four other horse populations maintained in Lithuania – Arabian (ARAB), Baltic Warmblood (BW), Lithuanian Warmblood (LW), and Zemaitukai (ZEM). These populations represent diverse histories, selection goals, and breeding practices. Pedigree data (n= 22 666) and parentage verification genetic data based on blood group markers (n= 1293) were used to evaluate genetic diversity, population structure, and inter-population relationships. Despite a 25 % population decline in recent years, the TRAK population maintained moderate inbreeding (F= 0.037) and a balanced genetic structure. The effective population size (Ne) was lower than in BW and LW but higher than in the endangered ZEM population. TRAK retained a high number of alleles (Na= 3.83), with observed heterozygosity (Ho= 0.460) slightly lower than that observed in open sport horse populations. Comparison of all individuals and the Lithuanian reference populations revealed stable or increased heterozygosity in currently breeding individuals, particularly within TRAK. Genetic distances and assignment tests confirmed close relationships among TRAK, BW, and LW, reflecting shared ancestry. In contrast, ARAB and ZEM populations remained genetically distinct. PCA and heatmap analyses further supported the separation between closed and open populations in the current breeding context. These findings highlight that population structure, historical gene flow, and management practices jointly shape genetic variability. The results can be used to optimize mating plans by balancing sire and dam contributions, monitor inbreeding and effective population size trends, manage gene flow between related populations (TRAK, BW, LW), and develop targeted conservation strategies for genetically distinct breeds such as ZEM and ARAB.
- Article
(2638 KB) - Full-text XML
-
Supplement
(496 KB) - BibTeX
- EndNote


Sport horse breeding is focused on the improvement of the genetic ability of warmblood riding horses for performance in competitions. In open subpopulations, an extensive exchange of the breeding stock between breeding organizations has been going on for decades. Significant improvements in reproduction techniques (e.g. chilled and frozen semen) have further facilitated the simultaneous use of breeding stallions in multiple countries and a large exchange of genetic material as a consequence (Koenen et al., 2004). The liberalization of European animal breeding legislation and an increasing diversity of equestrian sports have led to a constant rise in the number of horse breeds and breed registries. In addition, there is a trend towards an international expansion of the bigger established sport horse breeds (Aurich and Aurich, 2006). In this way, the importation of foreign genetic material (from foreign sport horse breeds) is present in open populations and gives the breeders the opportunity to choose foreign stallions that best contribute to the improvement of their horses' performance, as regards their physical, physiological, and/or genealogical characteristics (Bartolomé et al., 2011).
Still, there are some sufficiently closed studbooks which aim to preserve genetic resources (Zechner et al., 2002; Pjontek et al., 2012; Cosenza et al., 2019). In closed populations, genetic progress is slower, and it is difficult to obtain high-performance offspring while maintaining the genetic structure and diversity within the breed. Considering sport horse breeds, the Trakehner (TRAK) studbook represents a predominantly closed breeding system based on purebreeding (Trakehner Verband, 2025), whereas most contemporary sport horse breeding programmes operate as open studbooks, facilitating continuous genetic exchange across populations (Doyle et al., 2022). The TRAK breed is one of the oldest riding horse breeds and has long been acknowledged as an original breed, even internationally. Genetically, the breed can be traced back directly to the foundation of the Main Stud in Trakehnen (East Prussia) by a royal decree of the Prussian King in 1732. TRAK are a riding horse breed bred in accordance with the principles of pure breeding, with a high genetic proportion of English and Arab thoroughbred, Shagya, and Anglo-Arab, in keeping with the selection criteria established for the breed (Trakehner Verband, 2022). In other sport horse breeding programmes, TRAK stallions are commonly used for crossbreeding mares (Schröder et al., 2010; Roos et al., 2015; Oldenburger Pferdezuchtverband, 2022). In Lithuania TRAK were used for cavalry and sport (Krikščiūnas and Skaisgiris, 1939). Nowadays, according to the data of the Lithuanian Farm Animal Register, the total population of TRAK in Lithuania decreased by 25 % from 2014 to 2021.
Historical records indicate that the foundation of the Trakehnen Stud involved horses from studs located in Lithuania Minor (East Prussia), such as the Sereitlaukis estate (Račkauskaitė et al., 2021). Therefore, it could be assumed that local Lithuanian horses, including the Zemaitukai (ZEM), could have contributed to the early formation of the TRAK breed. ZEM horses have been known since the 6th–7th centuries (Gleß, 1989). Until the middle of the 19th century, the breed was dominant in the country. However, more intensive agricultural development has led to crossbreeding and dangerous declines of the population. After World War II in the first Lithuanian state studbook (1948), barely 17 purebred ZEM were entered; in 1994, only 30 horses were left (Macijauskienė et al., 2009). To restore the population, the studbook was opened, and three stallions of historically related breeds (Lithuanian large type Zemaitukai, Estonian native, and Arab) were used for a very low number of mares (Macijauskienė, 2009). The population of ZEM horses has increased, but the breed is still classified as endangered.
The Arabian (ARAB) horse is another breed of closed populations and one of the world's oldest breeds of any domesticated animals (Cosgrove et al., 2020), but the history of the breed's modern populations, described in pedigree records, is no longer than 200 years (Głażewska, 2010). The first European studs in Poland, Germany, and Hungary were established in the early nineteenth century. In Lithuania, ARAB were already used for breeding in 1937 (Krikščiūnas and Skaisgiris, 1939). Lithuania became a member of the World Arab Horse Organization (WAHO) in 1994. In 2007, 65 ARAB horses were already kept in the breeding nucleus of the national stud (Barisevičius et al., 2007). The breed is listed as transboundary (FAO, 2022).
In 1999, the development of a promising horse population suitable for all classical equestrian disciplines was initiated in Lithuania. This population was maintained as an open breeding structure, allowing local sport horse mares and stallions from various foreign breeds to be included. By 2007, six genetically dominant breed groups were identified within the population based on genotype composition: Hanoverian, TRAK, Holsteiner, Thoroughbred, Budyonny, ARAB, and others (Šveistienė, 2007). According to the World Breeding Federation for Sport Horses (WBFSH), 10 domestic and 30 foreign-approved stallions were used in the breeding programme of the Lithuanian Riding Horse in 2020 (WBFSH, 2021). In 2024, the breed was officially renamed to Lithuanian Warmblood horse (LW) to reflect its composition and alignment with international sport horse classification.
In 2000, the development of the second riding horse population was launched, and the studbook of the Baltic Hanoverian horse was established. The foundation of the Baltic Hanoverian population was a cross between Hanoverian and other sport horses. Hanoverians, TRAK, and Thoroughbreds were the main breeds of light-riding horses between World Wars I and II in Lithuania (Krikščiūnas and Skaisgiris, 1939). The national stud in Zagare became the basis for Hanoverian horse breeding for several decades. In 2022, the name of the studbook was changed to Baltic Warmblood (BW), and currently many other international breeds are used. The studbook registry of the breed is administered in accordance with the rules of WBFSH.
Characterization of animal genetic resources is essential for informed decision-making in conservation and breeding programmes (FAO, 2007; Kierkegaard et al., 2020). In horse populations, pedigree data remain a valuable tool for assessing genetic structure and variability, particularly when molecular information is limited or unavailable. Pedigree-based approaches have been widely applied to analyse genetic diversity, track founder contributions, and assess inbreeding trends, thereby providing insight into the effects of selection, breed formation, and population openness (Duru, 2017; Klein et al., 2022; Próchniak et al., 2024). In Lithuania, pedigree analyses were complemented by immunogenetic tools, including blood group and protein polymorphism typing, which were introduced in 1985 and applied in breeding control and the characterization of local breeds (Krikščiūnas, 1990). Although these methods are no longer routinely used in many countries, the standardized and long-term dataset they produced allows for the evaluation of genetic relationships and intra- and inter-population diversity. Moreover, these data may serve as a valuable reference for future molecular studies, especially in native and regional horse populations where genomic data remain limited.
Genetic variability under tightly controlled breeding in a declining population is essential. This study aimed to characterize the genetic variability of the TRAK population and its relationships with other horse populations in Lithuania by applying pedigree and parentage verification data. The results provide important insights into the effects of breed formation history and breeding practices on genetic structure, supporting informed decisions in the conservation and sustainable use of equine genetic resources.
2.1 Pedigree data analysis
The pedigree dataset included 22 666 horses from the Lithuanian populations of ARAB, BW, LW, TRAK, and ZEM, with records provided by the Agricultural Data Center. Table 1 presents an overview of the populations analysed. The reference population comprised horses registered in the respective studbooks and of breeding age (3–20 years). Horses outside this age range, as well as geldings, were excluded from the reference population.
Table 1Overview of studbook-based horse populations included in the pedigree analysis.
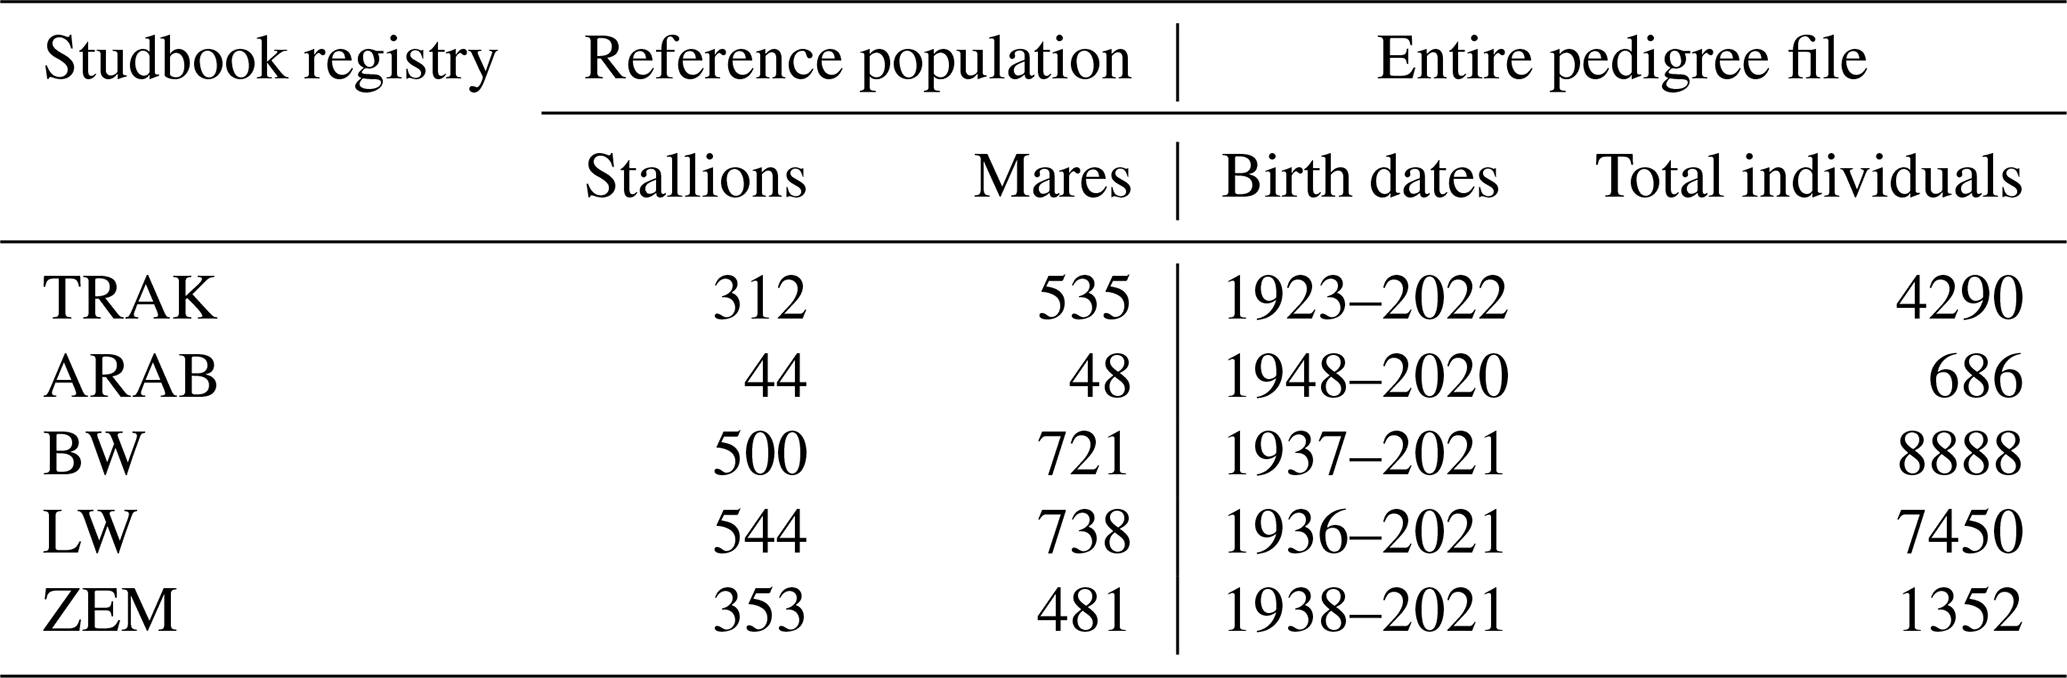
TRAK, Trakehner; ARAB, Arabian; BW, Baltic Warmblood; LW, Lithuanian Warmblood; and ZEM, Zemaitukai.
The number of founders in each horse population was estimated by summing individuals with unknown parentage, those with only maternal information, and those with only paternal information. The calculation considered the completeness of genealogical records and was based solely on pedigree data from the respective studbooks. This constraint limited the precision of founder estimates. Newly imported horses registered in the studbooks typically have pedigree information extending back only four generations, unless their ancestors were already recorded in the national studbooks.
Subsequent pedigree analysis parameters were calculated using the POPREP software system (Groeneveld et al., 2009).
Pedigree completeness quantifies the proportion of known ancestors across generations and provides a statistical measure of data quality. This parameter is essential, as estimates of inbreeding and effective population size depend heavily on the depth and completeness of pedigree information. In this study, pedigree completeness was calculated using the following formula:
where d is the number of generations considered, k represents the paternal or maternal line of the individual I, and ai is the proportion of known ancestors in the generation i (MacCluer et al., 1983).
The number of breeding males and females was determined for a given time period, as this directly influences the genetic structure of the subsequent generation.
The rate of inbreeding per generation (ΔF) was calculated using
where Ft and Ft−1 are the average inbreeding of offspring and their parents, respectively (Falconer and Mackay, 1996).
Several methods have been proposed to compute the effective population size (Ne). Ne via reproductive animals (Falconer and Mackay, 1996) was estimated based on the numbers of breeding animals using
where Nm and Nf are the number of male and female parents, respectively.
Ne via ΔF was calculated using
To assess breeding intensity and genetic progress, the generation interval was calculated. It was defined as the average age of parents at the birth of their offspring that were retained for breeding. Generation intervals were estimated for four parental pathways: sire to sire, sire to dam, dam to sire, and dam to dam. The overall generation interval was used for comparison among horse populations.
2.2 Genetic data analysis
2.2.1 Dataset
Genetic data from routine parentage verification tests, based on blood typing, were used in this study. A total of 1293 horses were included in the analysis. The analysis was conducted for two datasets: all genetically tested horses, to assess the overall genetic diversity, and the reference populations, consisting of living animals still eligible for breeding and contributing to the next generation (Table 2).
Table 2Composition of horse populations analysed by genetic parentage verification.
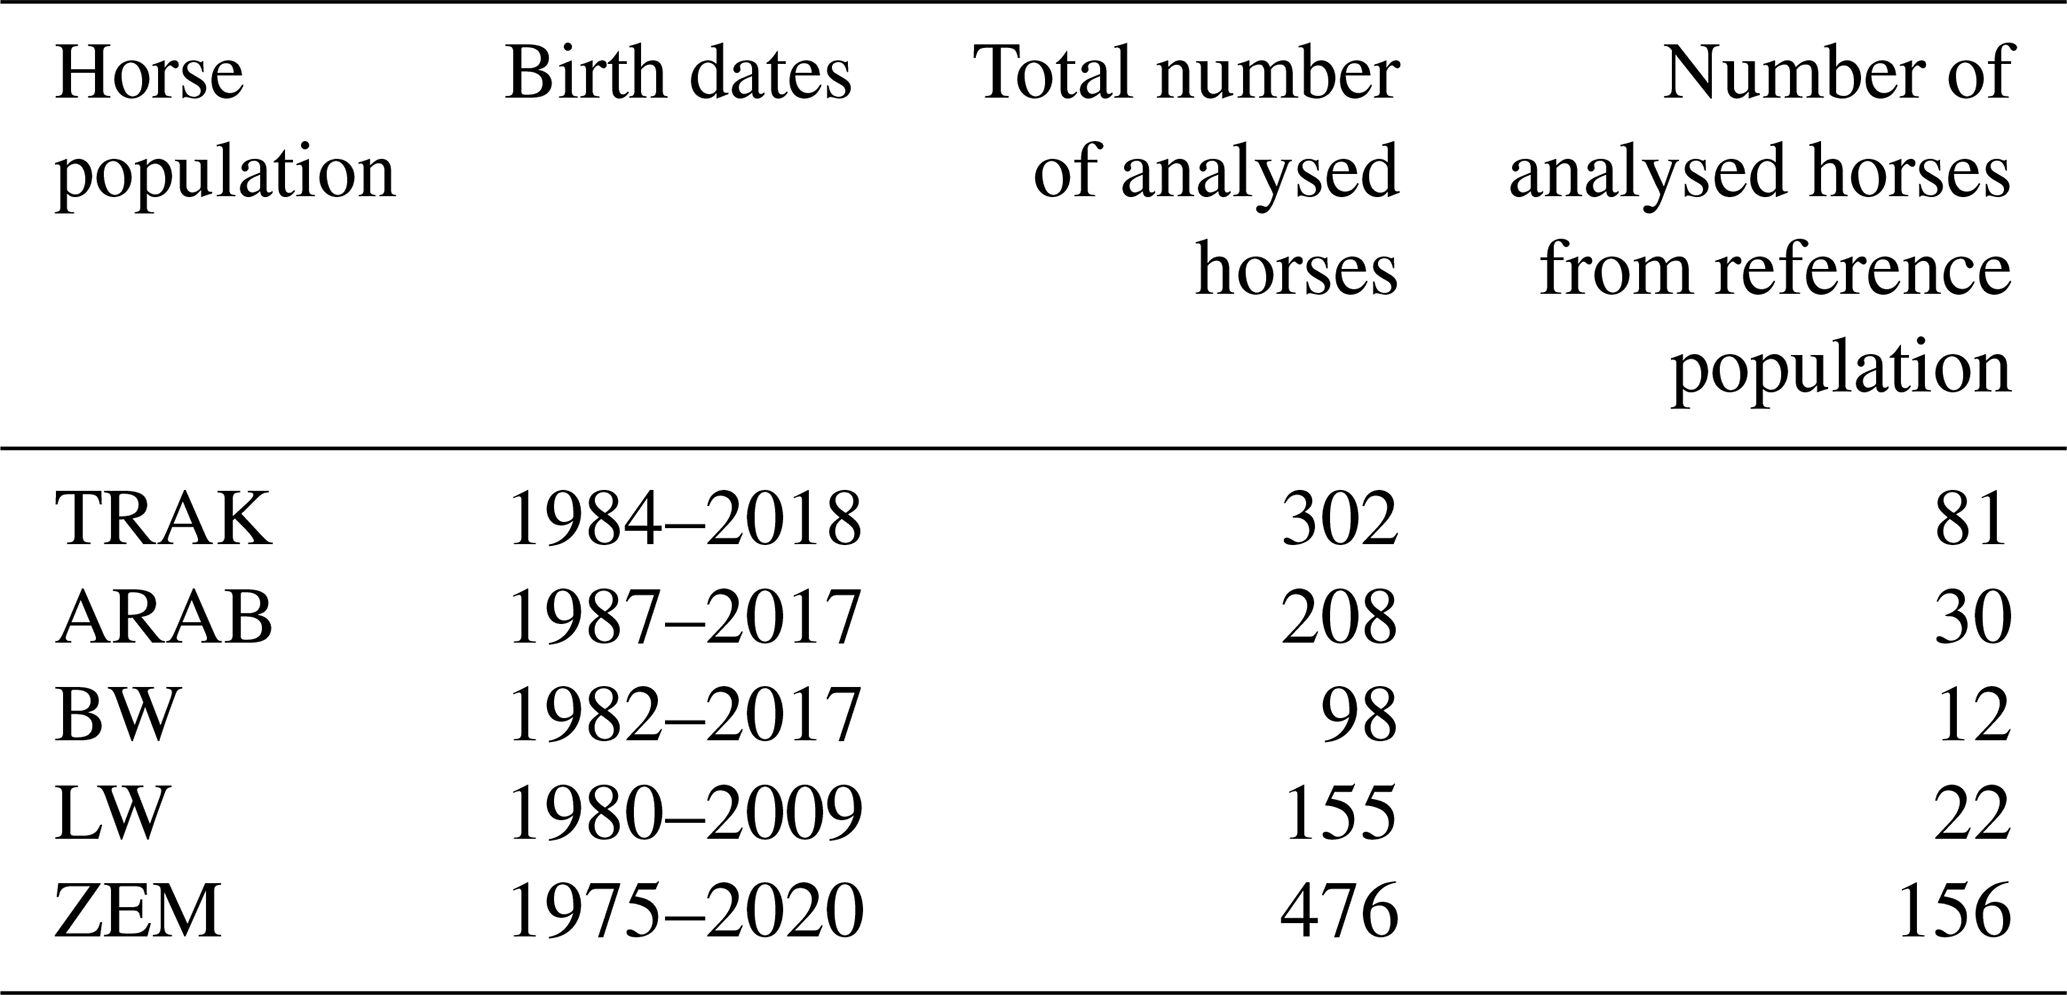
TRAK, Trakehner; ARAB, Arabian; BW, Baltic Warmblood; LW, Lithuanian Warmblood; and ZEM, Zemaitukai.
Horses were individually selected and grouped; for each animal, pedigree information (up to four generations) was reviewed to assess breed composition of the tested individuals and their parents. Efforts were made to select individuals as unrelated as possible, considering both maternal and paternal lineage. However, due to the small size of some subpopulations, it was not always possible to avoid close relationships. In a few cases, the same horse appeared in more than one population due to its use across multiple breeding programmes.
Blood typing was carried out at the Laboratory for Genetic Studies of the Animal Science Institute of Lithuanian University of Health Sciences. The samples for analysis were delivered by various horse breeders of Lithuania. Agglutination and haemolysis reactions were carried out by the requirements of the International Society for Animal Genetics (ISAG). Blood groups were identified using seven genetic systems: EAA, EAC, EAD, EAK, EAP, EAQ, and EAU. The following alleles were tested: Aa, Aabd, Aad, Ab, Abc, , Dadl, Dbcm, Dcfgm, Dcfm, Dcgm, Ddfk, Ddghm, Ddk, Ddkl, Ddl, Ka, Pb, Qa, Qabc, Qac, Qb, Qc, and Ua. Five blood protein genetic systems were identified: albumin (Al), vitamin-D-binding protein (Gc), serum esterase (Es), postalbumin (Xk), and transferrin (Tf). The following alleles were analysed: Al system (A, B), Gc (F, S), Es (F, I, S, X), Xk (F, K, S), and Tf (D, F, H, O, R) (Juras et al., 2003).
2.2.2 Genetic diversity parameters
Genetic diversity measures were calculated using GENALEX v6.501 (Peakall and Smouse, 2012). For each locus, the number of alleles (Na), the effective number of alleles (Ae), and observed (Ho) and expected heterozygosity (He) were determined. Deviations from the Hardy–Weinberg equilibrium (HWE) were tested using χ-squared test P values.
Across horse populations, allele frequencies and average values of genetic diversity parameters were computed, including mean Na, Ae, Ho, and He, across all loci. Additionally, tests for deviations from HWE were performed for each population. An analysis of molecular variance (AMOVA) among horse populations was also conducted to evaluate genetic differentiation.
2.2.3 Relationships of horse populations
Genetic relationships among horse populations were evaluated using multiple complementary approaches. The pairwise genetic differences among horse populations were evaluated based on Nei's standard genetic distance (D), and pairwise values of the fixation index (Fst) were determined using FSTAT v2.9.3 (Goudet, 2001).
To explore the assignment of individuals to populations, a likelihood-based population assignment test was conducted in GENALEX following the method of Paetkau et al. (2004). This test uses allele frequencies across loci to estimate the probability of an individual belonging to a given population, thereby identifying the population with the highest likelihood of origin. Such methods can also provide insights into gene flow between subpopulations (Remais et al., 2011). Results of the assignment test were visualized using the Circos software (Krzywinski et al., 2009), which displays connections via circular ideograms.
To further examine population structure, principal component analysis (PCA) was performed using a symmetric correlation matrix of allele frequencies. The PCA plot was generated using Minitab version 15 (Minitab, LLC, State College, PA, USA).
Additionally, a heatmap with hierarchical clustering was generated to visualize genetic similarities and changes over time. Both alleles (rows) and horse populations (columns) were clustered using Euclidean distance and the average linkage method. The analysis included both reference populations (currently breeding animals) and full population datasets (historical gene pool) to assess temporal shifts in genetic composition. The heatmap was produced using ClustVis (Metsalu and Vilo, 2015).
3.1 Population structure by genealogical data
In 2020, pedigree completeness six generations deep was the highest in the closed ZEM population (96.9 %), followed by TRAK (82.0 %) and ARAB (72.4 %) (Table 3). In contrast, open population BW and LW exhibited lower completeness (39.9 % and 54.5 %, respectively), reflecting the frequent use of imported animals with limited pedigree depth. The number of founders was the smallest in ARAB (8) and ZEM (23), while BW and LW had markedly more (431 and 592), consistent with their open breeding structure.
Table 3Pedigree completeness and founders in analysed horse populations.
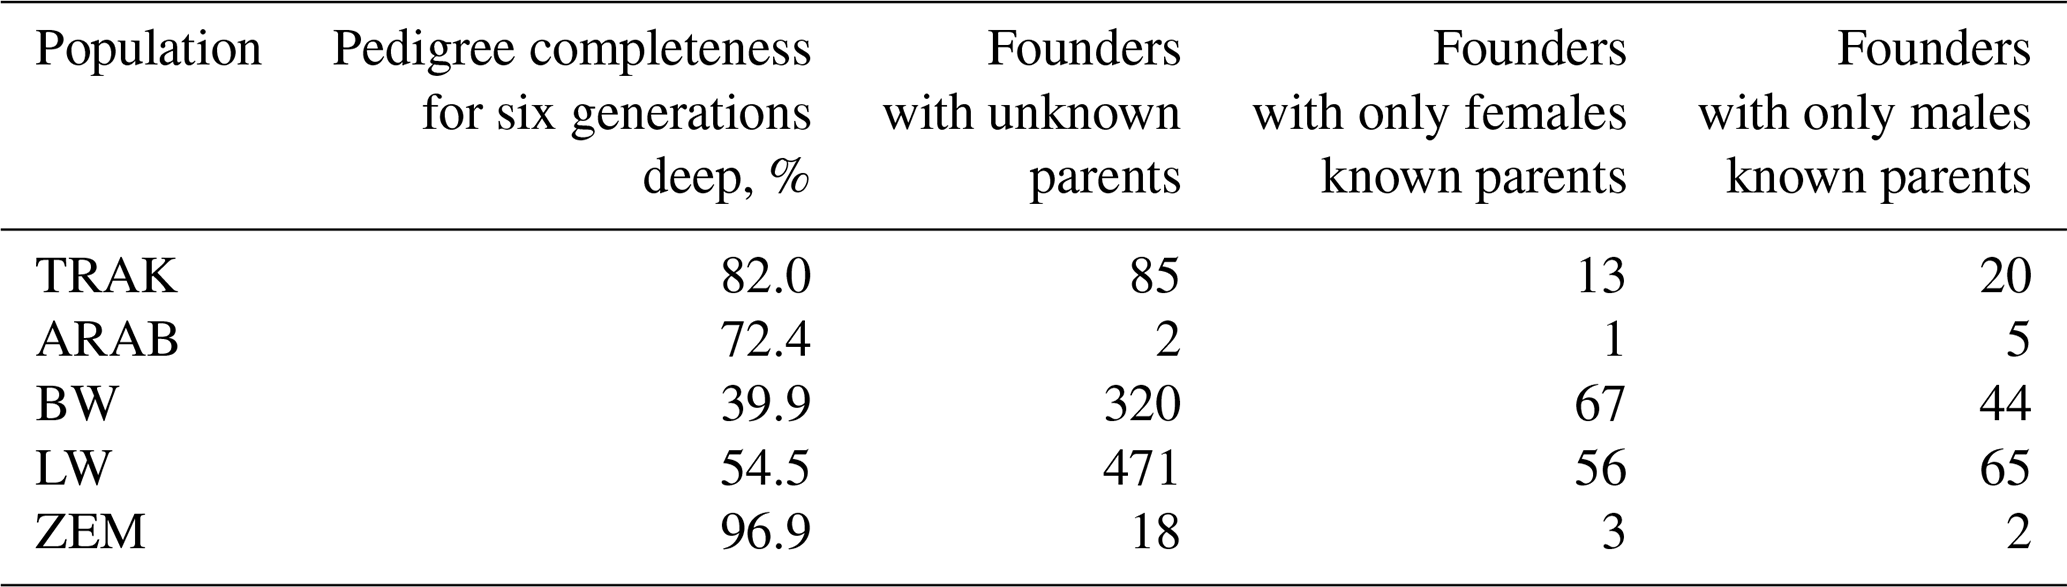
TRAK, Trakehner; ARAB, Arabian; BW, Baltic Warmblood; LW, Lithuanian Warmblood; and ZEM, Zemaitukai.
Table 4 summarizes the parameters characterizing breeding intensity and population structure. Despite a declining trend, the TRAK population had 78 reproductive mares and 21 stallions, resulting in an effective population size (Ne) of 211. Compared to open populations BW and LW, which showed higher Ne values via breeding animals (851 and 758, respectively), TRAK had a more balanced and closed structure. However, BW and LW also exhibited a large drop in Ne when calculated via inbreeding rate (311 and 216), reflecting hidden relatedness and unequal parental contributions.
Table 4Breeding animal usage, genetic diversity indicators, and generation intervals characterizing the structure and sustainability of horse populations.
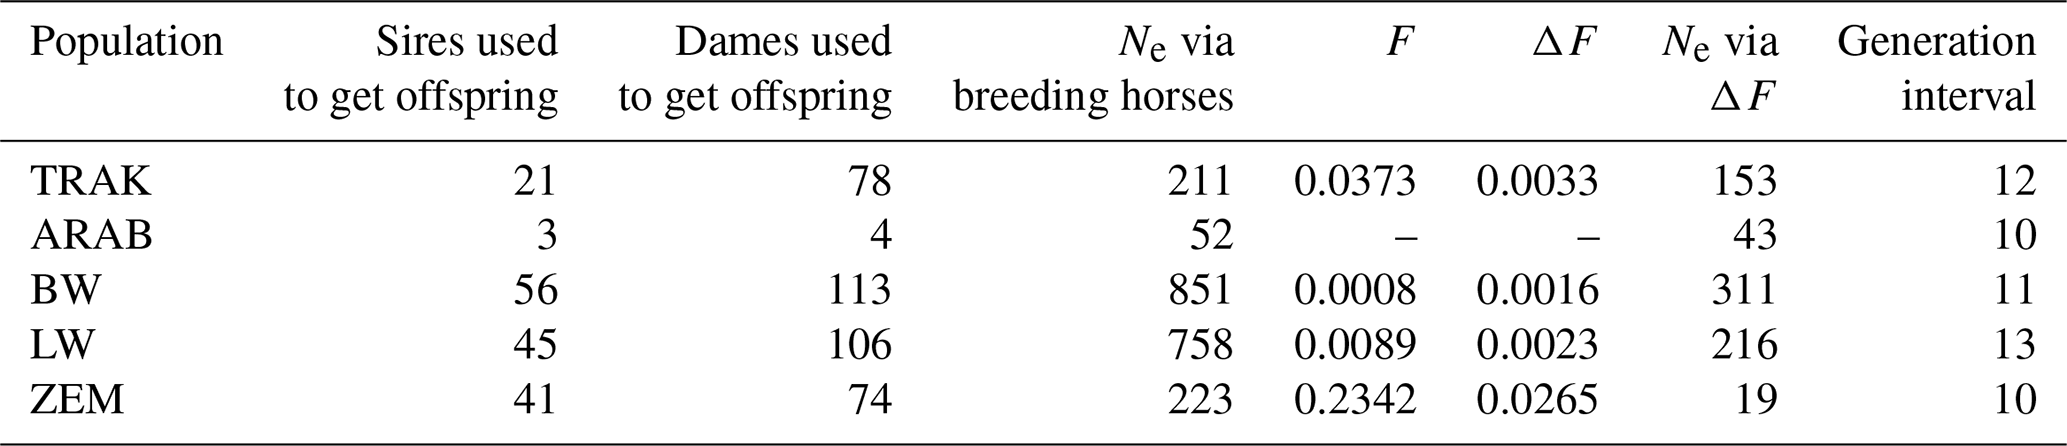
TRAK, Trakehner; ARAB, Arabian; BW, Baltic Warmblood; LW, Lithuanian Warmblood; ZEM, Zemaitukai; F, rate of inbreeding; ΔF, rate of inbreeding per generation; and Ne, effective population size.
In contrast, the endangered ZEM breed showed a dramatic discrepancy between Ne via breeding animals (223) and via inbreeding rate (19), reflecting high inbreeding pressure (F= 0.234; ΔF= 0.0265). The TRAK population demonstrated moderate inbreeding (F= 0.0373; ΔF= 0.0033), indicating controlled mating strategies.
The mean generation interval in TRAK was 12 years – comparable to LW (13) and BW (11) – but 2 years longer than in ARAB and ZEM populations (10 years each). A longer generation interval, typical in sport horse breeding, contributes to slower genetic turnover but may help stabilize diversity in closed populations like TRAK.
3.2 Genetic diversity
3.2.1 Total genetic diversity of horse blood systems
In total, 49 alleles were detected at 12 blood group loci across all studied horses (Table 5). The most polymorphic locus was EAD, with 12 alleles and an Ae value of 7.364 and the highest He value of 0.864. Across all horses, the average Ho was 0.475 and He was 0.395, indicating a moderate level of diversity. The χ-squared test for Hardy–Weinberg equilibrium (HWE) showed statistically significant results on eight loci.
Table 5Summary statistics of diversity indices per blood group locus in all/reference horses.
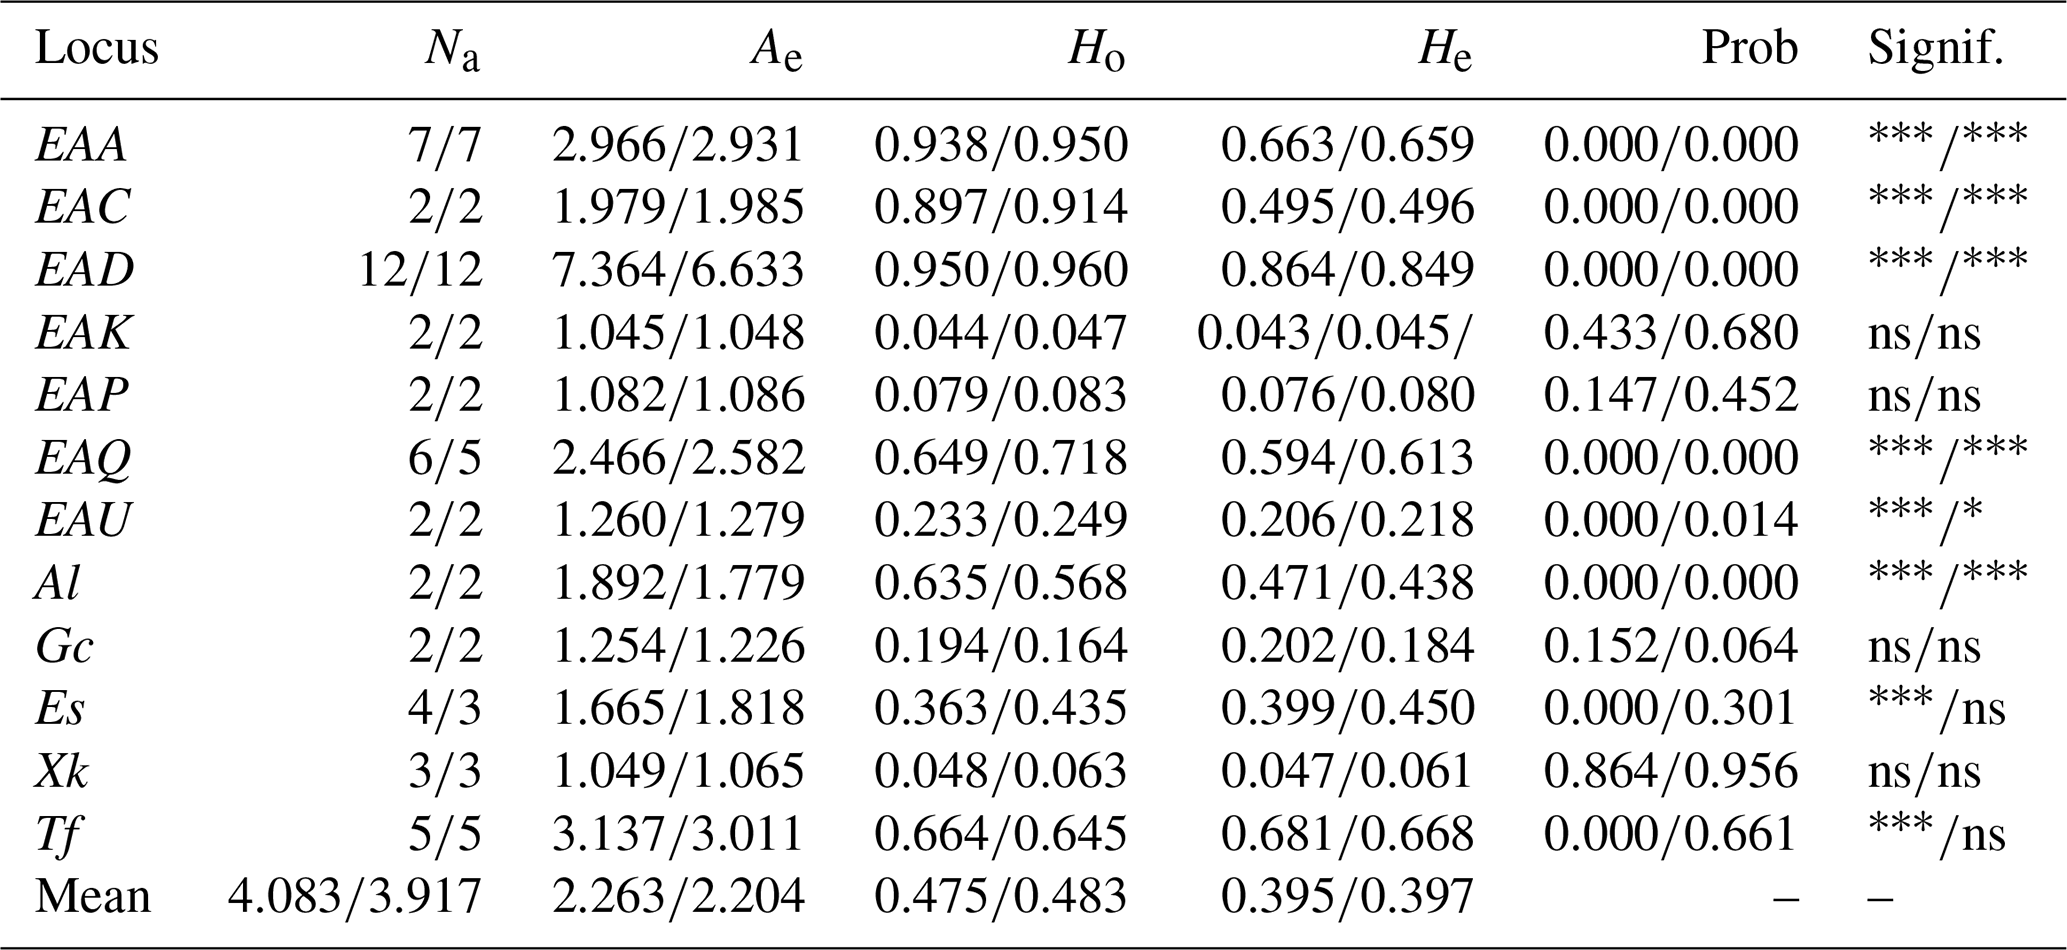
TRAK, Trakehner; ARAB, Arabian; BW, Baltic Warmblood; LW, Lithuanian Warmblood; ZEM, Zemaitukai; Na, number of alleles; Ae, number of effective alleles; Ho, observed heterozygosity; He, expected heterozygosity; Prob, probability; Signif., significance for HWE; and ns, not significant. * P < 0.05, P ,< 0.001.
Similar results were observed in the reference population of horses eligible for breeding. Despite a smaller sample size, the reference group showed a slightly higher average Ho (0.483) and He (0.397), indicating that genetic diversity is being maintained among actively breeding individuals. Comparable values of Na and Ae between the groups support this observation.
3.2.2 Genetic diversity in different horse populations
Allele frequencies and the significance for HWE are presented in Supplement Table S1. The number of alleles identified per population ranged from 44 to 47. The highest allelic diversity was observed in the ZEM population (47 alleles), followed by TRAK and ARAB (both with 46). Although the ARAB population showed a relatively high total allele count, it also exhibited the highest proportion of rare alleles (frequency < 0.1) and the absence of several alleles found in other populations. The BW and LW populations had the lowest numbers of alleles, with 45 and 44, respectively.
Some alleles, such as EAQb, were characteristic of Lithuanian riding horse populations and occurred at a very low frequency in ZEM horses. In the TRAK population, the most frequent alleles were EADdghm (0.388), EAQc (0.357), and EsF (0.334). In the ARAB population, the allele TfO was the most frequent (0.327).
Table 6 presents the mean values of genetic diversity parameters across all analysed horses and reference populations in the analysed loci. The TRAK population showed a mean number of alleles per locus (Na) of 3.833 across all animals and 3.417 in the reference population. The effective number of alleles (Ae) increased slightly from 2.218 to 2.271 in the reference population, suggesting the maintenance or even slight improvement of allelic richness in the current breeding cohort. However, observed heterozygosity (Ho) rose from 0.460 to 0.488, while expected heterozygosity (He) increased from 0.375 to 0.392, indicating that recent breeding efforts may be successfully preserving heterozygosity despite closed studbook practices.
Table 6Genetic diversity parameters within five horse populations (all horses/reference horses).
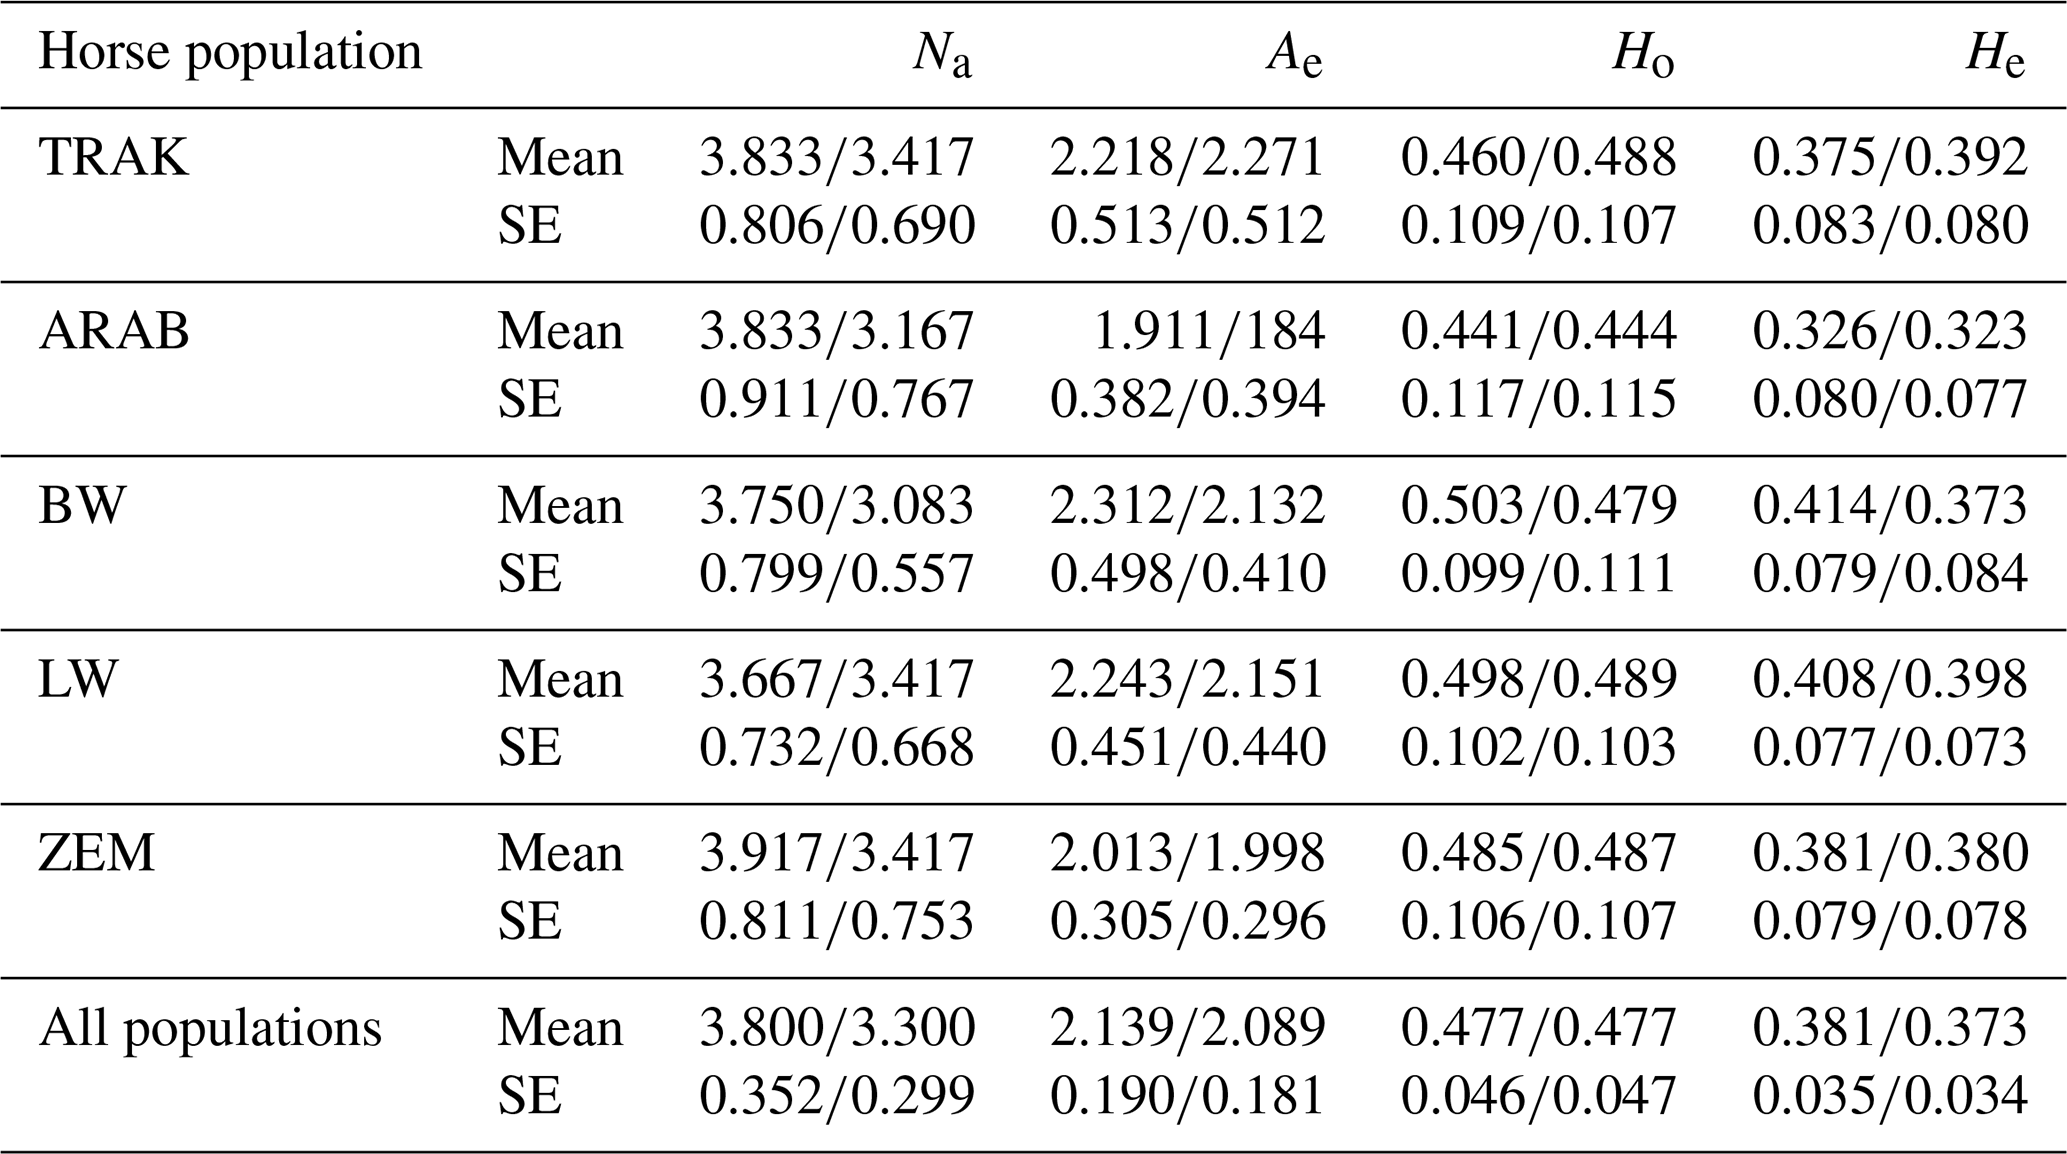
TRAK, Trakehner; ARAB, Arabian; BW, Baltic Warmblood; LW, Lithuanian Warmblood; ZEM, Zemaitukai; Na, number of alleles; Ae, number of effective alleles; Ho, observed heterozygosity; He, expected heterozygosity; and SE, standard error.
Open populations BW and LW showed the highest Ho and He in both total and reference populations, reflecting high heterogeneity due to crossbreeding. For instance, BW had Ho values of 0.503 (all horses) and 0.479 (reference) and Ae values of 2.312 and 2.132, respectively. This slight decrease in the reference population suggests a stabilization trend in the actively used gene pool.
In contrast, the ARAB population exhibited the lowest genetic variability, with Ho values of 0.441 in the total population and 0.444 in the reference population, indicating minimal difference and confirming its narrow genetic base. The ZEM breed maintained high Na and Ho in both groups, yet a slight decrease in Ae (from 2.013 to 1.998) suggests a potential loss of rare alleles in the breeding population.
3.2.3 Relationships of horse populations
Pairwise comparisons of Nei's genetic distance and Fst values, calculated separately for the full dataset and reference populations (Table 7), revealed consistent patterns of genetic relationships. TRAK horses were most closely related to BW and LW, with Nei's genetic distance values of 0.008 and 0.009 (full population) and 0.008 and 0.010 (reference population), respectively. These results reflect historical and ongoing gene flow from TRAK into these open sport horse populations. In contrast, ZEM showed the greatest differentiation from TRAK, with a Nei genetic distance value of 0.045 in both datasets, and was also genetically distinct from all other breeds, consistently exhibiting the highest Fst values across comparisons.
Table 7Pairwise population matrix of Nei's genetic distance below the diagonal and fixation index (Fst) values above the diagonal (all horses/reference horses).

TRAK, Trakehner; ARAB, Arabian; BW, Baltic Warmblood; LW, Lithuanian Warmblood; and ZEM, Zemaitukai.
The Fst value between TRAK and ARAB increased from 0.015 in the full dataset to 0.021 in the reference population, while similar increases were observed in other breed pairs. This pattern suggests increasing genetic structuring or divergence within the currently breeding animals, indicating that recent breeding practices may be reinforcing population boundaries or limiting gene exchange.
The population assignment test (Fig. 1) is based on 12 loci. The test calculates the genotype probability of random assignment to each of the populations tested. Two axes are represented in the graph out of the resulting multidimensional plot of probabilities (one axis for each population). The plot gives an overall graphic representation of similarities/dissimilarities among genotypes within and among populations.
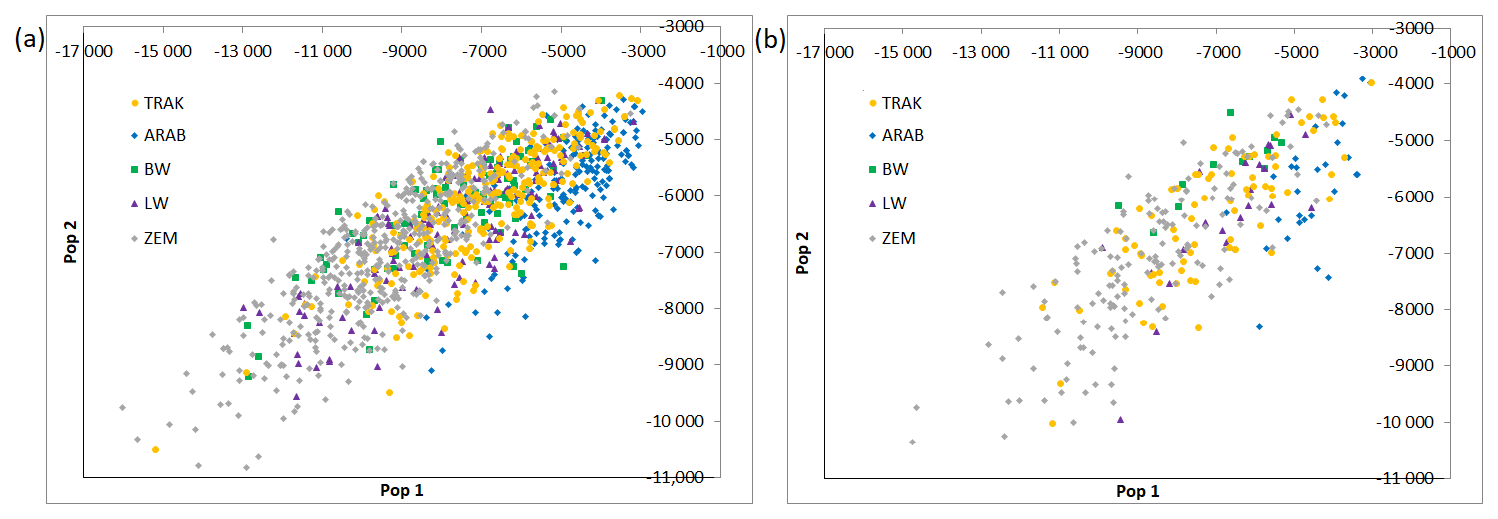
Figure 1Multidimensional scaling of population assignment probabilities (a – all horses, b – reference horses).
ARAB and ZEM populations formed clear, isolated groups in both datasets, confirming strong genetic integrity and minimal gene flow. In contrast, TRAK, BW, and LW horses showed partial overlap, especially in the all-horse dataset, highlighting shared ancestry or historical crossbreeding.
In the reference population, individual assignments became slightly more distinct, suggesting increasing differentiation among breeding groups. TRAK horses shifted toward a more centralized cluster, indicating internal consistency within the actively bred subpopulation.
The Circos plot (Fig. 2) revealed the proportion of individuals assigned to their own or other populations, offering insights into genetic identity and admixture.
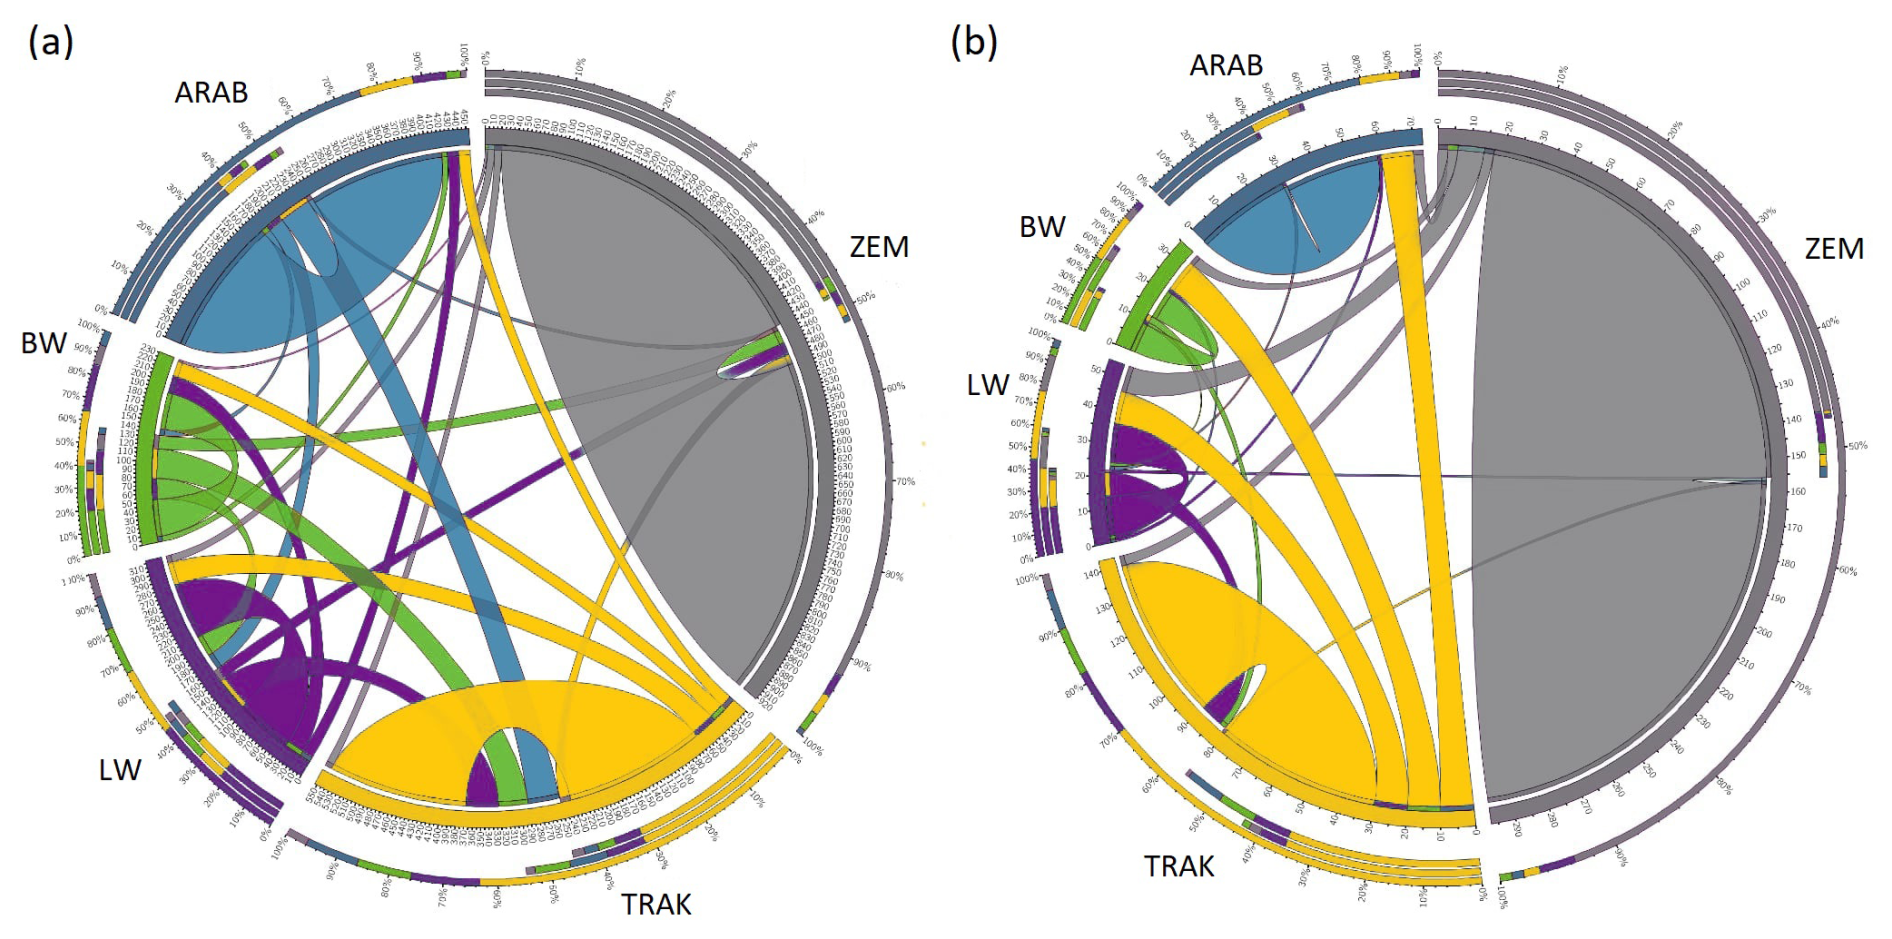
Figure 2Population purity and admixture proportions revealed by Circos visualization (a – all horses, b – reference horses).
In the full dataset, 57.9 % of TRAK horses were correctly assigned to their own population, while 42.1 % were assigned to others – primarily LW (13.6 %) and ARAB (13.2 %). This admixture signal reflects the historical influence of TRAK on sport horse populations and its inclusion of Arab ancestry. In contrast, ZEM and ARAB populations showed strong assignment to their own groups (89 % and 83 %, respectively), indicating low external introgression.
In the reference population, assignment to the breed's own group increased slightly for all breeds. For TRAK, 62.1 % of individuals were assigned to the TRAK group, suggesting that currently used breeding animals are more genetically homogeneous than the historical population.
The PCA of the blood group and protein marker data resulted in two principal components, explaining 36.2 % and 22.3 % of the total variation, respectively (Fig. 3). Four components had eigenvalues > 1, accounting for 100 % of total variation. All correlations between variables and principal components were low, indicating no dominant individual markers.
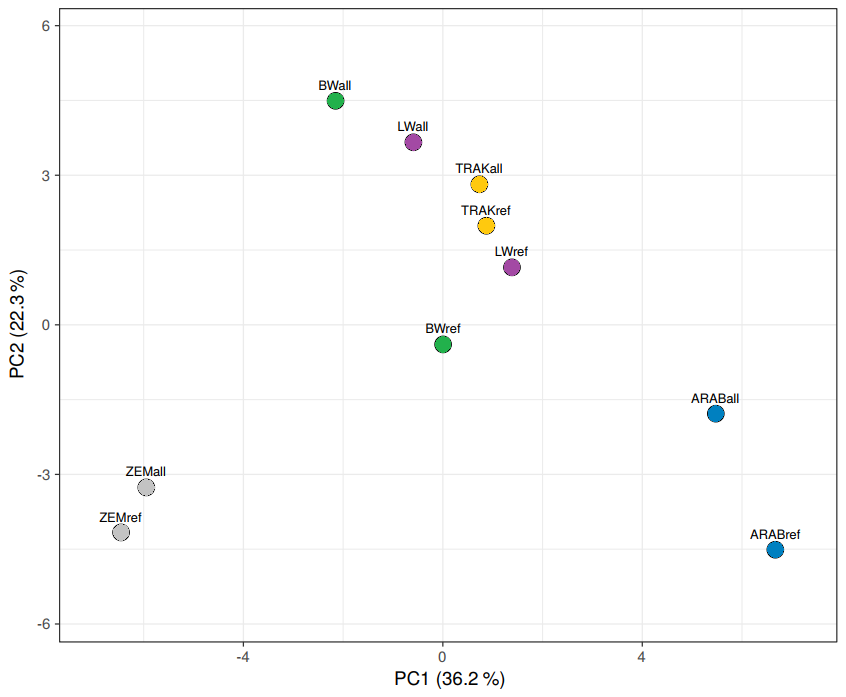
Figure 3PCA of population-level genetic variation. “ref” – reference population (breeding horses); “all” – all analysed horses (total gene pool).
Visualization of the genetic relationships among populations revealed clear group-specific clustering. TRAK, BW, and LW populations occupied overlapping space, with TRAK more centrally located and compact in the reference dataset. This supports their shared ancestry and highlights gene flow while also suggesting increasing genetic structuring among currently breeding animals.
In contrast, ZEM and ARAB populations formed distinct, non-overlapping clusters, consistent with their closed or isolated breeding histories. The comparison of full and reference datasets confirmed that reference groups are more genetically defined, reflecting recent selection and restricted gene exchange.
The heatmap (Fig. 4) reveals pronounced genetic shifts in the reference populations (“ref”) compared to the broader gene pools (“all”) within the same breeds. In several cases, reference groups clustered separately from the full set of analysed individuals of their respective populations, indicating recent changes in allele composition, likely driven by selection, drift, or targeted breeding strategies. This pattern is particularly evident in the BW and LW populations, suggesting divergence between historical diversity and the genetic structure of current breeding animals.
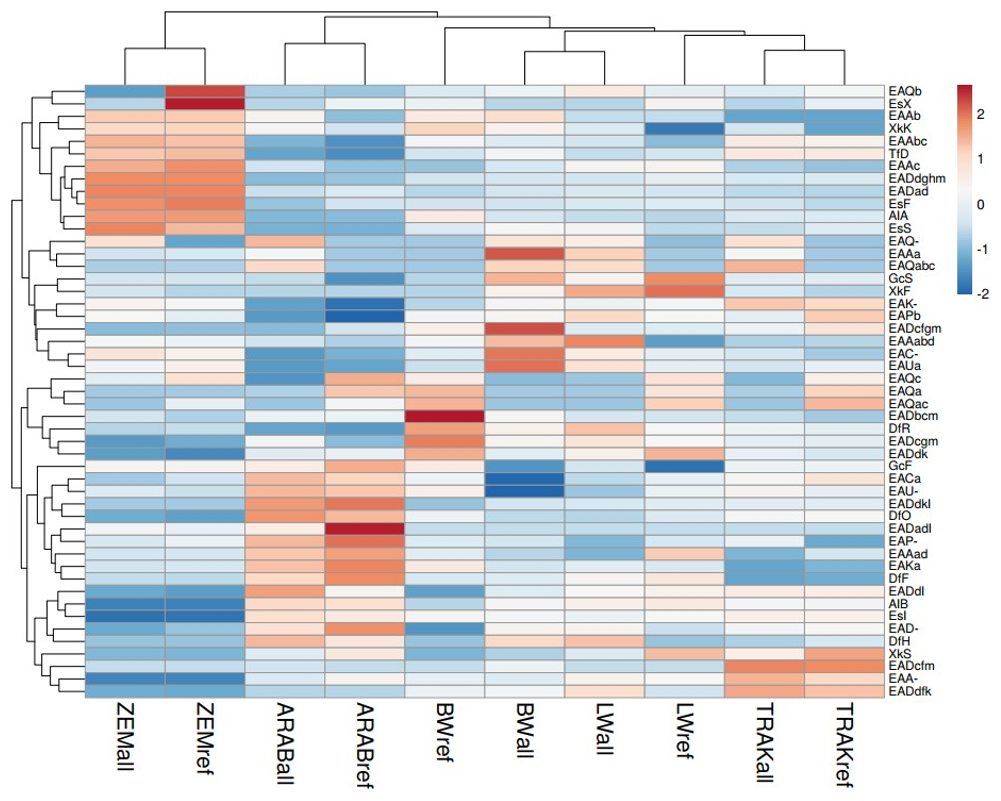
Figure 4Heatmap of allele frequencies in horse populations. Rows represent alleles, and columns represent population subsets. Both were clustered using Euclidean distance and average linkage. Red indicates higher-than-average values and blue lower. “ref” – reference population (breeding horses); “all” – all analysed horses (total gene pool).
The TRAK reference and overall populations clustered closely with BW and LW subsets, reflecting their historical and ongoing contribution to the development of warmblood sport horse populations. This genetic proximity highlights shared ancestry and gene flow across these groups.
A clear separation was observed between the ZEM horses and the sport-type populations (TRAK, BW, LW), forming a distinct cluster. This confirms the unique genetic structure of this endangered native breed and is consistent with its limited gene flow from other populations. ARAB horses also formed a separate cluster, reinforcing their status as a genetically distinct, closed population.
Clustering of alleles further emphasized the variants enriched or diminished in the reference groups, pointing to alleles potentially under selection pressure or lost through genetic drift.
Overall, this heatmap visualization illustrates population restructuring under contrasting breeding systems, providing a complementary perspective to classical diversity metrics and genetic distance analyses.
One of the fundamental aims in conservation genetics is to preserve genetic variability within populations, as it is generally assumed to be positively correlated with population viability. In the management of livestock populations, this entails minimizing the loss of genetic variation due to inbreeding and genetic drift while also preventing undesired gene flow between different breeds (Thirstrup et al., 2008; Frankham, 2010). For breeds maintained as small, closed populations, such as TRAK and ZEM, within-population diversity conservation is particularly relevant.
Our results revealed that estimates of Ne depend heavily on the method used and the population characteristics. In TRAK, Ne calculated via the number of reproducing animals was even lower than in the restored ZEM breed. However, Ne estimated via the rate of inbreeding was dramatically low in ZEM, reflecting strong inbreeding pressure. This outcome is likely due to the high proportion of inbred individuals in the ZEM population and supports earlier findings that Ne estimates are highly sensitive to pedigree completeness, mating patterns, and population structure (Leroy et al., 2013; Klein et al., 2022). Similar patterns have been reported in endangered horse populations analysed using pedigree-based approaches, such as the Hucul and Cleveland Bay breeds, where Ne estimates based on inbreeding rates were substantially lower and revealed stronger inbreeding pressure compared to estimates based on the number of breeding animals (Somogyvári et al., 2018; Dell et al., 2020). This is further supported by studies combining pedigree and genomic approaches, which have shown that pedigree-based estimates may underestimate inbreeding and effective population size, particularly in long-established closed populations affected by bottlenecks and hidden founder contributions (Poyato-Bonilla et al., 2022). Open populations, such as BW and LW, had high Ne values based on breeding animal counts. However, these figures decreased significantly when estimated via ΔF, with reductions of over 60 %, highlighting unbalanced parentage and hidden relatedness. This underlines the importance of using complementary metrics, as emphasized by Martyniuk et al. (2010), to gain an accurate understanding of breed endangerment beyond FAO's basic Ne thresholds.
The relatively high Ne of TRAK (via breeding animals) and moderate inbreeding level (F= 0.0373) suggest that current breeding strategies are effective in maintaining genetic diversity despite a 25 % population decline. Conservation programmes for such populations should prioritize not only the number of reproducers but also balanced parental contributions, minimization of related matings, and elongated generation intervals to slow genetic erosion (Caballero, 2020; Zechner et al., 2002). An illustrative example of the benefits of coordinated breeding is the case of the endangered Cleveland Bay, where structured mate allocation using SPARKS software increased Ne from less than 50 to over 170 in under 2 decades (Dell et al., 2020).
The average generation interval of 12 years in TRAK supports a conservative breeding pattern, being comparable to other Lithuanian sport horse breeds and slightly higher than that of German TRAK (10 years; Teegen et al., 2009). Longer generation intervals are generally associated with slower rates of genetic change and reduced accumulation of inbreeding, which may contribute to maintaining genetic diversity in structured breeding populations (Caballero, 2020). This may help stabilize the genetic structure of the population and reduce generational drift.
The analysis of the genetic data provided additional insights into population differentiation. Similar approaches based on blood group markers have been successfully applied in endangered horse populations, such as the Hucul breed, where immunogenetic analyses revealed considerable allelic diversity and provided a basis for understanding population structure and guiding breeding strategies (Popadiuk, 2019). Importantly, the analysis included all available genotyped horses and a subset representing active breeding animals.
In TRAK, both datasets showed high allelic richness (Na= 3.833 and 3.417, respectively), and observed heterozygosity increased in the reference group (Ho from 0.460 to 0.488). This pattern indicates successful retention – or even improvement – of genetic diversity among active reproducers, despite the constraints of a partly closed studbook. Similar trends were observed in ZEM, where Ho and He also improved compared to earlier reports (Juras and Cothran, 2005), suggesting that the implementation of structured conservation breeding is having a positive effect.
BW and LW populations exhibited the highest heterozygosity across both datasets, in line with their open breeding structure and frequent introduction of imported stallions. However, the slight decline in Ae in reference groups hints at potential erosion of rare alleles under stabilized selection pressure. Petersen et al. (2013) similarly observed that open studbook breeds generally display higher heterozygosity but may undergo narrowing of genetic bases over time due to directional selection.
In contrast, ARAB horses showed consistently low heterozygosity and a narrow genetic base, with minimal differences between full and reference datasets. Although the total number of alleles was similar to other populations, ARAB had the highest proportion of rare alleles and lacked some variants observed in other breeds. These findings align with previous research on genetically uniform, closed populations and highlight the importance of long-term breeding coordination (Zechner et al., 2002).
Nei's genetic distances and Fst values, calculated for both datasets, revealed stable patterns of interpopulation relationships. TRAK showed the closest proximity to BW and LW, reflecting its historical influence on Lithuanian sport horse breeding. Meanwhile, the largest genetic distance was observed between TRAK and ZEM, as expected for historically and functionally distinct populations. The moderate but increasing differentiation between TRAK and ARAB (Fst 0.015 to 0.021) in the reference dataset suggests that structured breeding in recent years is strengthening internal breed cohesion.
The assignment test further confirmed these patterns: 57.9 % of all TRAK horses were correctly assigned to their population, while this figure increased to 62.1 % in the reference group, indicating greater genetic consistency among actively bred individuals. This pattern was even more pronounced in ARAB and ZEM, where 83 % and 89 % of individuals, respectively, were assigned correctly in both datasets, consistent with their closed genetic histories and minimal admixture.
Multivariate analyses (PCA and clustering) supported the relationships described above. In the full dataset, TRAK, BW, and LW overlapped substantially, while in the reference group, population boundaries became more distinct. TRAK formed a more compact and centralized cluster, indicating increasing within-population cohesion. Heatmap analysis placed the reference populations of BW and LW as the closest relatives, with TRAK closely associated within the same cluster – consistent with historical data indicating that TRAK horses formed a significant genetic base for the Lithuanian Warmblood studbook (Šveistienė, 2007). This clustering pattern was particularly evident in the reference groups, supporting the idea that recent breeding practices have maintained historical genetic links.
The maintenance of genetic diversity within TRAK, despite its closed structure, is likely supported by the permitted inclusion of Thoroughbred and Arabian ancestry, as allowed by breeding standards (Nolte et al., 2019). This partly explains the moderate genetic proximity observed between TRAK and ARAB in our study. In contrast, native breeds such as ZEM do not benefit from this kind of gene flow, which places greater responsibility on internal diversity management.
Breeding systems and studbook structures have a profound impact on genetic diversity, influencing both within-breed variability and between-breed differentiation (Curik et al., 2017). Partly closed breeding systems, such as the TRAK studbook, are effective in maintaining breed identity but may contribute to genetic erosion over time (Leroy et al., 2013). Conversely, open systems, like those of LW and BW, enable greater genetic input from diverse sources, yet they pose challenges related to managing inbreeding and maintaining structured selection schemes (Pjontek et al., 2012). These results highlight the importance of regular genetic monitoring and tailored breeding strategies to ensure sustainable population management. The integration of genomic tools is essential for more accurate characterization of genetic architecture, controlling inbreeding and optimizing selection decisions (Yaro et al., 2017). Therefore, combining pedigree information with molecular data can support both conservation and performance goals in national horse breeding programmes.
Despite the limited population size, the Trakehner horse population in Lithuania demonstrated a favourable level of genetic diversity and heterozygosity. The genetic relationships observed between Trakehner and other horse populations (particularly BW and LW) are consistent with historical patterns of breed development and reflect recent gene flow. However, the observed population decline highlights the need for well-planned genetic management to prevent further erosion of genetic variation and to safeguard biodiversity.
This study underscores the importance of continued monitoring and strategic breeding efforts. While traditional selection practices have contributed to the current population structure, they may also pose risks to genetic diversity in the long term. Incorporating genomic selection tools could help to mitigate these effects by maintaining or even enhancing genetic variability. Strategic genetic management, including the use of genomic tools, should be considered an important component in efforts to preserve genetic variation and ensure the long-term sustainability of horse breeds in Lithuania.
Importantly, from 2025, national support has been introduced in Lithuania for genetic testing and parentage verification of breeding horses. This initiative is expected to facilitate the wider application of molecular tools, including microsatellite- and SNP-based analyses, in breeding programmes. The increasing availability of such data will provide a valuable foundation for more precise genetic evaluation, improved pedigree verification, and more effective long-term management of genetic diversity in Lithuanian horse populations.
The pedigree and genetic data used in this study are available from the corresponding author upon reasonable request.
The supplement related to this article is available online at https://doi.org/10.5194/aab-69-323-2026-supplement.
Conceptualization was done by RŠ, AR, and VR. Methodology was done by RŠ and AR. Genetic data analysis was performed by AR, and pedigree data were analysed by ŠM. Genetic data were curated by VJ. Writing and visualization were done by AR under the supervision of RŠ and VR. All authors have read and agreed to the published version of the paper.
The contact author has declared that none of the authors has any competing interests.
This study used archived parentage verification genotypes and pedigree data. No new animal experiments were conducted.
Publisher's note: Copernicus Publications remains neutral with regard to jurisdictional claims made in the text, published maps, institutional affiliations, or any other geographical representation in this paper. The authors bear the ultimate responsibility for providing appropriate place names. Views expressed in the text are those of the authors and do not necessarily reflect the views of the publisher.
The authors sincerely thank the Agricultural Data Centre and the Laboratory for Genetic Studies of the Animal Science Institute of the Lithuanian University of Health Sciences for providing essential data and technical support. We also acknowledge the Lithuanian Ministry of Agriculture for supporting the National Programme for the Conservation of Endangered Farm Animal Breeds.
This paper was edited by Antke-Elsabe Freifrau von Tiele-Winckler and reviewed by two anonymous referees.
Aurich, J. and Aurich, C.: Developments in European horse breeding and consequences for veterinarians in equine reproduction, Reprod. Domest. Anim., 41, 275–279, https://doi.org/10.1111/j.1439-0531.2006.00719.x, 2006.
Barisevičius, J., Isoda, V., Paičius, D., and Valkauskas, D.: Lietuvoje veisiami arkliai ir jų įvertinimai, Vilnius, Lithuania, Agricultural Information and Rural Business Centre, report, 21–22, 2007.
Bartolomé, E., Cervantes, I., Valera, M., and Gutiérrez, J.: Influence of foreign breeds on the genetic structure of the Spanish Sport Horse population, Livest. Sci., 142, 70–79, https://doi.org/10.1016/j.livsci.2011.06.021, 2011.
Caballero, A.: Quantitative genetics, Cambridge University Press, Cambridge, UK, 109–112, https://doi.org/10.1017/9781108630542, 2020.
Cosenza, M., La Rosa, V., Rosati, R., and Chiofalo, V.: Genetic diversity of the Italian thoroughbred horse population, Ital. J. Anim. Sci., 18, 538–545, https://doi.org/10.1080/1828051X.2018.1547128, 2019.
Cosgrove, E., Sadeghi, R., Schlamp, F., Holl, H., Moradi, S.M., Miraei, A., Reza, S., Abdalla, S., Shykind, B., Troedsson, M., Stefaniuk, M., Prabhu, A., Bucca, S., Bugno, M., Wallner, B., Malek, J., Miller, D., Clark, A., Antczak, D., and Brooks, S.: Genome diversity and the origin of the Arab horse, Sci. Rep., 10, 9702, https://doi.org/10.1038/s41598-020-66232-1, 2020.
Curik, I., Ferenčaković, M., and Sölkner, J.: Inbreeding and runs of homozygosity: A possible solution to an old problem, Livest. Sci., 166, 26–34, https://doi.org/10.1016/j.livsci.2014.05.034, 2017.
Dell, A., Ryan, A., and Buckley, M.: The Cleveland Bay horse: progress in its conservation over the last two decades, Rare Breeds International Bulletin, 97, 19–26, 2020.
Doyle, J. L., Carroll, C. J., Corbally, A. F., and Fahey, A. G.: An overview of international genetic evaluations of show jumping in sport horses, Transl. Anim. Sci., 6, txac038, https://doi.org/10.1093/tas/txac038, 2022.
Duru, S.: Pedigree analysis of the Turkish Arab horse population: structure, inbreeding and genetic variability, Animal, 11, 1449–1456, https://doi.org/10.1017/S175173111700009X, 2017.
Falconer, D. S. and Mackay, T. E. C.: Introduction to quantitative genetics, 4th edn., Longman, Harlow, UK, ISBN 0582 24302 5, 1996.
Food and Agriculture Organization of the United Nations (FAO): Global Plan of Action for Animal Genetic Resources and the Interlaken Declaration. Commission on Genetic Resources for Food and Agriculture, Food and Agriculture Organization of the United Nations, Rome, ISBN 978-92-5-105848-0, 2007.
Food and Agriculture Organization of the United Nations (FAO): https://www.fao.org/home/en, last access: 27 April 2022.
Frankham, R.: Challenges and opportunities of genetic approaches to biological conservation, Biol. Conserv., 143, 1919–1927, https://doi.org/10.1016/j.biocon.2010.05.011, 2010.
Głażewska, I.: Speculations on the origin of the Arab horse breed, Livest. Sci., 129, 49–55, https://doi.org/10.1016/j.livsci.2009.12.009, 2010.
Gleß, J. E. F. K.: Kleinpferde, VEB Deutschen Landvirtschaftsverlag, Berlin, ISBN 3331001538, 1989.
Goudet, J.: FSTAT, a program to estimate and test gene diversities and fixation indices (Version 2.9.4.), https://www2.unil.ch/popgen/softwares/fstat.htm (last access: 27 April 2022), 2001.
Groeneveld, E., Westhuizen, B., Maiwashe, N., Voordewind, F., and Ferraz, J.: POPREP: A generic report for population management, Genet. Mol. Res., 8, 1158–1178, https://doi.org/10.4238/vol8-3gmr648, 2009.
Juras, R. and Cothran, E. G.: Genetic diversity of the Zemaitukai horse, Conserv. Genet. Endanger. Horse Breeds, EAAP Sci. Ser., 116, 177–183, https://doi.org/10.3920/978-90-8686-546-8, 2005.
Juras, R., Cothran, E. G., and Klimas, R.: Genetic analysis of three Lithuanian native horse breeds, Acta Agr. Scand. A-An., 53, 180–185, https://doi.org/10.1080/09064700310012971, 2003.
Kierkegaard, L. S., Groeneveld, L. F., Kettunen, A., and Peer Berg, P.: The status and need for characterization of Nordic animal genetic resources, Acta Agr. Scand. A-An., 69, 2–24, https://doi.org/10.1080/09064702.2020.1722216, 2020.
Klein, R., Oláh, J., Mihók, S., and Posta, J.: Pedigree-based description of three traditional Hungarian horse breeds, Animals, 12, 2071, https://doi.org/10.3390/ani12162071, 2022.
Koenen, E. P. C., Aldridge, L. I., and Philipsson, J.: An overview of breeding objectives for warmblood sport horses, Livest. Prod. Sci., 88, 77–84, https://doi.org/10.1016/j.livprodsci.2003.10.011, 2004.
Krikščiūnas, B.: Immunogenetic polymorphism of horses in the Lithuanian SSR and its use in breeding, dissertation, Lithuanian Research Institute of Livestock and Veterinary, Baisogala (Lithuania), 155 pp., 1990.
Krikščiūnas, J. and Skaisgiris, J.: Žemės ūkio ministerijos metraštis XX 1918–1938, 30, 39–49, https://archive.org/details/zum.xx/page/397/mode/2up (last access: 25 March 2025), 1939.
Krzywinski, M., Schein, J., Birol, I., Connors, J., Gascoyne, R., Horsman, D., Jones, S. J., and Marra, M. A.: Circos: An information aesthetic for comparative genomics, Genome Res., 19, 1639–1645, https://doi.org/10.1101/gr.092759.109, 2009.
Leroy, G., Mary-Huard, T., Verrier, E., Danvy, S., Charvolin, E., and Burge, D. C.: Methods to estimate effective population size using pedigree data: Examples in dog, sheep, cattle and horse, Genet. Sel. Evol., 45, 1, https://doi.org/10.1186/1297-9686-45-1, 2013.
MacCluer, J. W., Boyce, A. J., Dyke, B., Weitkamp, L. R., Pfennig, D. W., and Parsons, C. J.: Inbreeding and pedigree structure in Standardbred horses, J. Hered., 74, 394–399, https://doi.org/10.1093/oxfordjournals.jhered.a109824, 1983.
Macijauskienė, V.: Naujų linijų kūrimo proceso įtaka žemaitukų populiacijos genotipui, Gyvulininkystė, 54, 20–31, https://gi.lsmuni.lt/pages/darbai/2009_54/20_31_macijauskiene.pdf (last access: 25 March 2025), 2009.
Macijauskienė, V., Šveistienė, R., and Jatkauskienė, V.: Peculiarities and differences of Zemaitukai and large-type Zemaitukai horse genotypes, Biologija, 55, 57–63, https://doi.org/10.2478/v10054-009-0011-6, 2009.
Martyniuk, E., Pilling, D., and Scherf, B.: Indicators: Do we have effective tools to measure trends in genetic diversity of domesticated animals, Anim. Genet. Resour., 47, 31–43, https://doi.org/10.1017/S2078633610001013, 2010.
Metsalu, T. and Vilo, J.: ClustVis: a web tool for visualizing clustering of multivariate data using Principal Component Analysis and heatmap, Nucleic Acids Res., 43, W566–W570, https://https://doi.org/10.1093/nar/gkv468, 2015.
Nolte, W., Thaller, G., and Kuehn, C.: Selection signatures in four German warmblood horse breeds: Tracing breeding history in the modern sport horse, PLoS One, 14, e0215913, https://doi.org/10.1371/journal.pone.0215913, 2019.
Oldenburger Pferdezuchtverband: Breeding Programme for Oldenburg Horses, https://oldenburger-pferde.com/upload/organisation/Zuchtprogramm_des_Oldenburger_Pferdes-2018_ENG_final.pdf (last access: 20 March 2022), 27 April 2022.
Paetkau, D., Slade, R., Burden, M., and Estoup, A.: Genetic assignment methods for the direct, real-time estimation of migration rate: a simulation-based exploration of accuracy and power, Mol. Ecol., 13, 55–65, https://doi.org/10.1046/j.1365-294X.2004.02008.x, 2004.
Peakall, R. and Smouse, P. E.: GenAlEx 6.5: Genetic analysis in Excel. Population genetic software for teaching and research – an update, Bioinformatics, 28, 2537–2539, https://doi.org/10.1093/bioinformatics/bts460, 2012.
Petersen, J. L., Mickelson, J. R., Cothran, E. G., Andersson, L. S., Axelsson, J., Bailey, E., Bannasch, D., Binns, M. M., Borges, A. S., Brama P., da Câmara Machado, A., Distl, O., Felicetti, M., Fox-Clipsham, L., Graves, K. T., Guérin, G., Haase, B., Hasegawa, T., Hemmann, K., Hill, E. W., Leeb, T., Lindgren, G., Lohi, H., Lopes, M.S., McGivney, B. A., Mikko, S., Orr, N., Penedo, M. C., Piercy, R. J , Raekallio, M., Rieder, S., Røed, K. H., Silvestrelli, M., Swinburne, J., Tozaki, T., Vaudin, M., M Wade, C., and McCue, M. E.: Genetic diversity in the modern horse illustrated from genome-wide SNP data, PLoS ONE, 8, e54997, https://doi.org/10.1371/journal.pone.0054997, 2013.
Pjontek, J., Kadlečík, O., Kasarda, R., and Horný, M.: Pedigree analysis in four Slovak endangered horse breeds, Czech J. Anim. Sci., 57, 54–64, https://doi.org/10.17221/5132-CJAS, 2012.
Popadiuk, S. S.: Immunogenetic control of the origin of the Hutsul horse breed, Sci. Messenger LNU Vet. Med. Biotechnol., Ser. Agric. Sci., 21, 98–102, https://doi.org/10.32718/nvlvet-a9117, 2019.
Poyato-Bonilla, J., Laseca, N., Demyda-Peyrás, S., Molina, A., and Valera, M.: 500 years of breeding in the Carthusian strain of Pura Raza Español horse: An evolutional analysis using genealogical and genomic data, J. Anim. Breed. Genet., 139, 84–99, https://doi.org/10.1111/jbg.12641, 2022.
Próchniak, T., Kasperek, K., Knaga, S., Rozempolska-Rucińska, I., Batkowska, J., and Drabik, K.: Population structure and genetic diversity of Polish Arabian horses based on pedigree data, Animal, 18, 101148, https://doi.org/10.1016/j.animal.2024.101148, 2024.
Račkauskaitė, A., Šveistienė, R., Razmaitė, V., Jatkauskienė, V.: Evaluation of genetic diversity of subdivided genealogical groups in Lithuanian Trakehner horse population using immunogenetic tools, Czech J. Anim. Sci., 66, 200–210, https://doi.org/10.17221/118/2020-CJAS, 2021.
Remais, J. V., Xiao, N., Akullian, A., Qiu, D., and Blair, D.: Genetic Assignment Methods for Gaining Insight into the Management of Infectious Disease by Understanding Pathogen, Vector, and Host Movement, PLoS Pathog., 7, e1002013, https://doi.org/10.1371/journal.ppat.1002013, 2011.
Roos, L., Hinrichs, D., Nissen, T., and Krieter, J.: Investigations into genetic variability in Holstein horse breed using pedigree data, Livest. Sci., 177, 25–32, https://doi.org/10.1016/j.livsci.2015.04.013, 2015.
Schröder, W., Stock, K. F., and Distl, O.: Genetic evaluation of Hanoverian warmblood horses for conformation traits considering the proportion of genes of foreign breeds, Arch. Anim. Breed., 53, 377–387, https://doi.org/10.5194/aab-53-377-2010, 2010.
Somogyvári, E., Posta, J., and Mihók, S.: Genetic analysis of the Hungarian population of endangered Hucul horses, Czech J. Anim. Sci., 63, 237–246, https://doi.org/10.17221/54/2017-CJAS, 2018.
Šveistienė, R.: Lietuvos jojamųjų žirgų įvairovė ir populiacijos struktūros analizė pagal kilmės informaciją, Gyvulininkystė, 49, 3–13, https://publications.lsmuni.lt/object/elaba:6219109/6219109.pdf (last access: 20 March 2022), 2007.
Teegen, R., Edel, C., and Thaller, G.: Population structure of the Trakehner horse breed, Animal, 3, 6–15, https://doi.org/10.1017/S1751731108003273, 2009.
Thirstrup, J. P., Pertoldi, C., and Loeschcke, V.: Genetic analysis, breed assignment and conservation priorities of three native Danish horse breeds, Anim. Genet., 39, 496–505, https://doi.org/10.1111/j.1365-2052.2008.01767.x, 2008.
Trakehner Verband: Breeding goal, https://www.trakehner-verband.de/en/pferde/zuchtziel/ (last access: 27 April 2025), 2022.
Trakehner Verband: Zuchtprogramm für die Population des Ostpreußischen Warmblutpferdes Trakehner Abstammung (Stand April 2025), https://www.trakehner-verband.de/wp-content/uploads/2025/12/Zuchtprogramm-2025-Weimar.pdf (last access: 19 March 2026), 2025.
World Breeding Federation for Sport Horses (WBFSH): Guidelines on Setting up a Sport Horse Studbook, https://www.wbfsh.com/downloads/members/2021-06-WBFSH-Guidelines-on-setting-up-a-studbook.pdf (last access: 27 April 2025), 2021.
Yaro, M., Munyard, K. A., Stear, M. J., and Groth, D. M.: Molecular identification of livestock breeds: a tool for modern conservation biology, Biol. Rev., 92, 993–1010, https://doi.org/10.1111/brv.12265, 2017.
Zechner, P., Sölkner, J., Bodo, I., Druml, T., Baumung, R., Achmann, R., Marti, E., Habe, F., and Brem, G.: Analysis of diversity and population structure in the Lipizzan horse breed based on pedigree information, Livest. Prod. Sci., 77, 137–146, https://doi.org/10.1016/S0301-6226(02)00079-9, 2002.