
the Creative Commons Attribution 4.0 License.
the Creative Commons Attribution 4.0 License.
 | 11 Jan 2024
Genetic diversity and population structure of Anatolian Hair goats, an ancient breed
Aylin Demiray
Zühal Gündüz
Onur Yılmaz
İbrahim Cemal
Aynur Konyalı
Zeynep Semen
Arif Altuntaş
Ali Atik
Ahmet Akçay
Hüseyin Baş
Hasan Hüseyin Şenyüz
This study aimed to investigate the genetic characterization and diversity of Hair goats from 10 regions using 20 microsatellite markers. A total of 522 alleles were observed. The INRA0023 locus exhibited the greatest number of alleles (48), while the DRBP1 locus had the highest effective allele number (16.27), and the BM1818 and DRBP1 loci had the highest polymorphic information content value (0.94). The expected heterozygosity value ranged from 0.85 (ILSTS011) to 0.94 (BM1818, SRCRSP15, and DRBP1). The Hair goat populations in Konya and Hatay displayed the lowest and highest allele numbers, with values of 10.40 and 16.25, respectively. The fixation index (FIS) values are significant in defining population structures and determining the extent of heterozygosity losses. The FIS values exhibited a range of 0.031 in Muǧla to 0.226 in Burdur. A total of 107 unique alleles were identified in Hair goat populations. However, it is noteworthy that, out of all the alleles, only 25 had a frequency exceeding 5 %. The results indicate that the microsatellite markers utilized demonstrate sufficient levels of polymorphism, making them appropriate for efficiently investigating the genetic variability of Hair goat populations.
- Article
(1994 KB) - Full-text XML
- BibTeX
- EndNote


Goats are regarded to be a crucial component of animal production systems in Türkiye, particularly in rural regions where they are reared in extensive conditions. Goat breeding is typically conducted in regions where agricultural cultivation and other forms of animal husbandry are not viable, particularly in the inner-forest areas. Hair goats, which constitute 97.8 % of Türkiye's goat population and for which many studies have been carried out to define their productivity characteristics, are mostly raised in the mountainous regions of Türkiye (Simsek et al., 2007; Atay et al., 2010; Cemal et al., 2019; Sirin, 2019; TUIK, 2022; Cemal et al., 2021). Although Hair goats are bred in all regions of Türkiye, they are known for their resilience to severe climatic conditions. The Hair goat is a breed that exhibits disease resistance due to its sturdy physique, which is well suited to the challenging climate and terrain of Anatolia (Erduran and Yaman, 2012; Koluman et al., 2013; Keskin et al., 2017; Daskiran et al., 2018).
Breeding programs aimed at improving productivity in farm animals have been observed to potentially compromise their adaptive capabilities. Nevertheless, these programs also emphasize the critical importance of the conservation of genetic resources (Karaca and Cemal, 1998). Research on the conservation of genetic resources is becoming increasingly significant, and investigations in this field are expanding globally, including in Türkiye. The initial stage in preserving diversity among domestic animals is to possess a thorough understanding of their genetic variability. It is of utmost importance to accurately determine the breed that requires protection for the purpose of conservation in order to prevent the loss of valuable allele combinations present in the gene pool. Numerous studies have been conducted on the genetic diversity of Hair goats in Türkiye (Bulut et al., 2016; Gurler and Bozkaya, 2013; Karsli et al., 2020; Tefiel et al., 2020; Gul et al., 2020; Karsli et al., 2022). However, this study was carried out in a wide geographical area where Hair goats are grown intensively, using a relatively high number of microsatellite markers compared to other studies.
It can be asserted that there exists a significant phenotypic variation among the populations of Hair goats that are raised in nearly all regions of Türkiye (Anonymous, 2023). Most of the goat breeding in Türkiye is carried out under extensive conditions. Within the scope of the National Genetic Improvement Project for Small Ruminants at Breeders' Conditions, which was launched by the General Directorate of Agricultural Research in 2005, breeding plans were carried out for animal species and breeds, and modern breeding organizations were put into action under field conditions. Hair goats have also been included in breeding organizations based on the open-core breeding model in many provinces of Türkiye. Records such as productivity and pedigree, which are needed to estimate genetic parameters for the breed, have begun to be obtained (Karaca et al., 2014).
In the past century, statistical techniques have been extensively utilized in breeding research, particularly in the field of livestock (Beuzen et al., 2000). Advancements in molecular biology and statistical techniques have facilitated the identification and utilization of significant quantitative trait loci (QTL) and genomic variations for enhancing the genetics of farm animals (Montaldo and Meza-Herrera, 1998).
The determination of population variation and genetic diversity in farm animals is of great significance in uncovering population structures and inter-population relationships and in devising national breeding and conservation programs. It is widely recognized that indigenous breeds are progressively being supplanted by high-yielding breeds, resulting in the potential extinction of certain breeds without proper identification. The current investigation aimed to ascertain the genetic variability and population structure of Hair goats, a breed commonly reared in Türkiye.
2.1 Sampling and DNA isolation
The animal material for the study consisted of 389 Hair goats, which were non-consanguineous to each other and were raised in 10 different provinces (Çanakkale, Karaman, Burdur, Niǧde, Muǧla, Mersin, Konya, Antalya, Isparta, and Hatay) in Türkiye. The animals included in the study are part of the breeding program. In this context, the selection of animals that constitute the animal population for the study was based on pedigree records. According to FAO (2011), genetic diversity studies conducted with microsatellites, one of the genetic markers, should involve a minimum of 25 unrelated individuals. In the presented study, sample numbers for animal material were selected according to this criterion. The figure depicting the sampling locations is presented in Fig. 1.
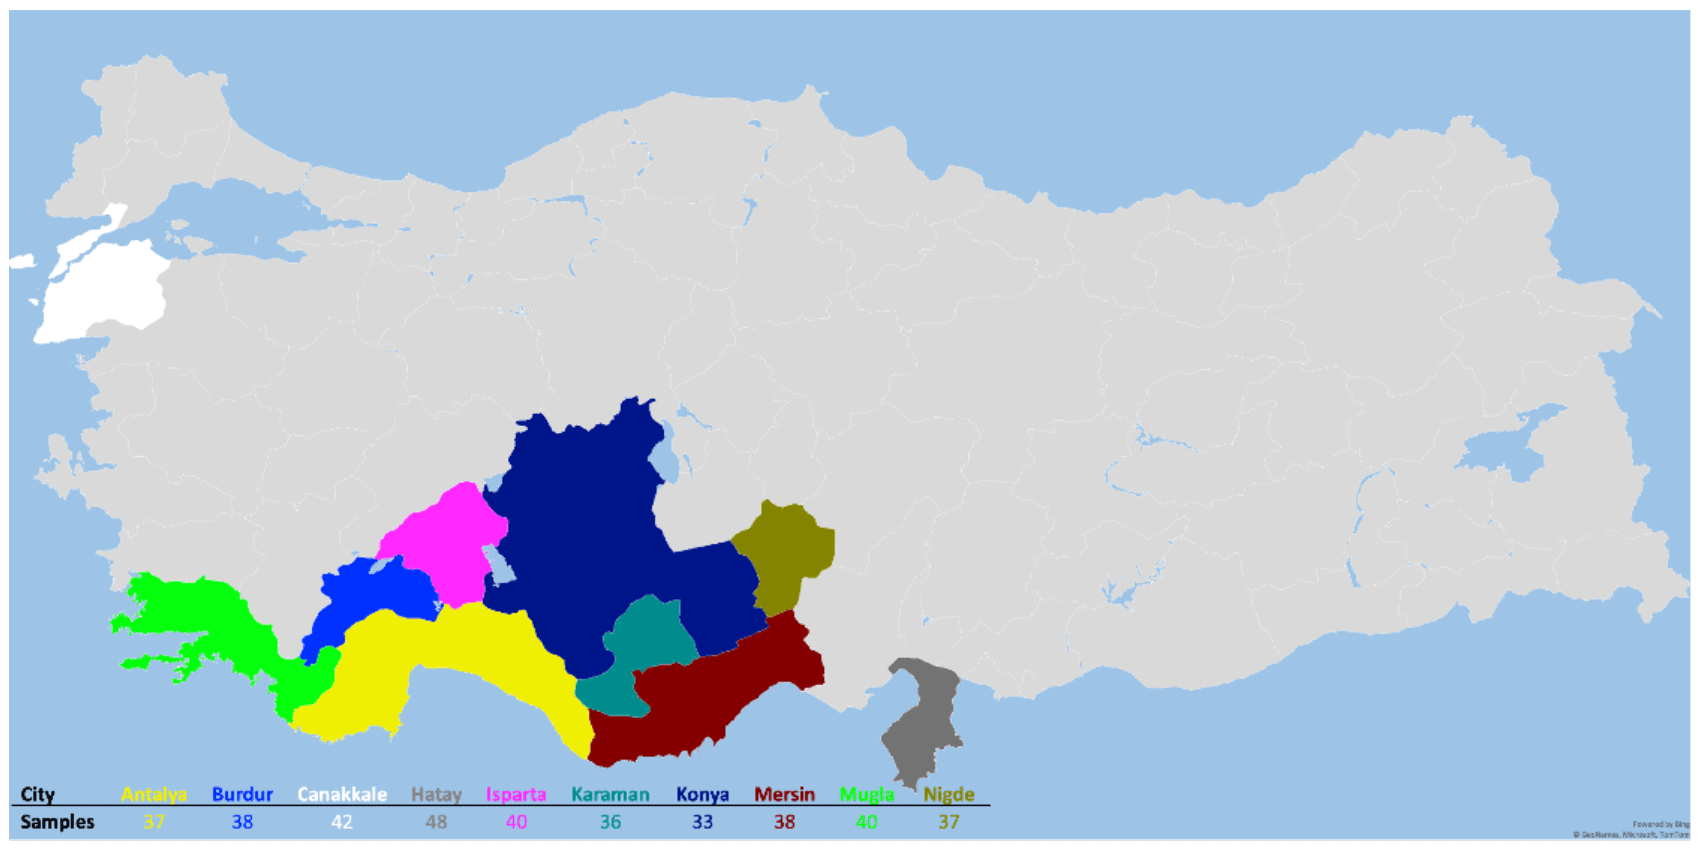
Figure 1Sampling locations.
Blood was collected from the jugular vein of the animals using a needle and a vacuum tube containing K3EDTA. The collected blood was stored at −20 ∘C until molecular genetic analysis was conducted. The genomic DNA was isolated from the blood samples using the salt precipitation technique, as previously outlined by Miller et al. (1988) and Montgomery and Sise (1990). After the isolation of DNA, its quantity and quality were evaluated using the NanoDrop 2000 spectrophotometer, which was produced by Thermo Scientific, USA.
2.2 PCR amplification and fragment analysis
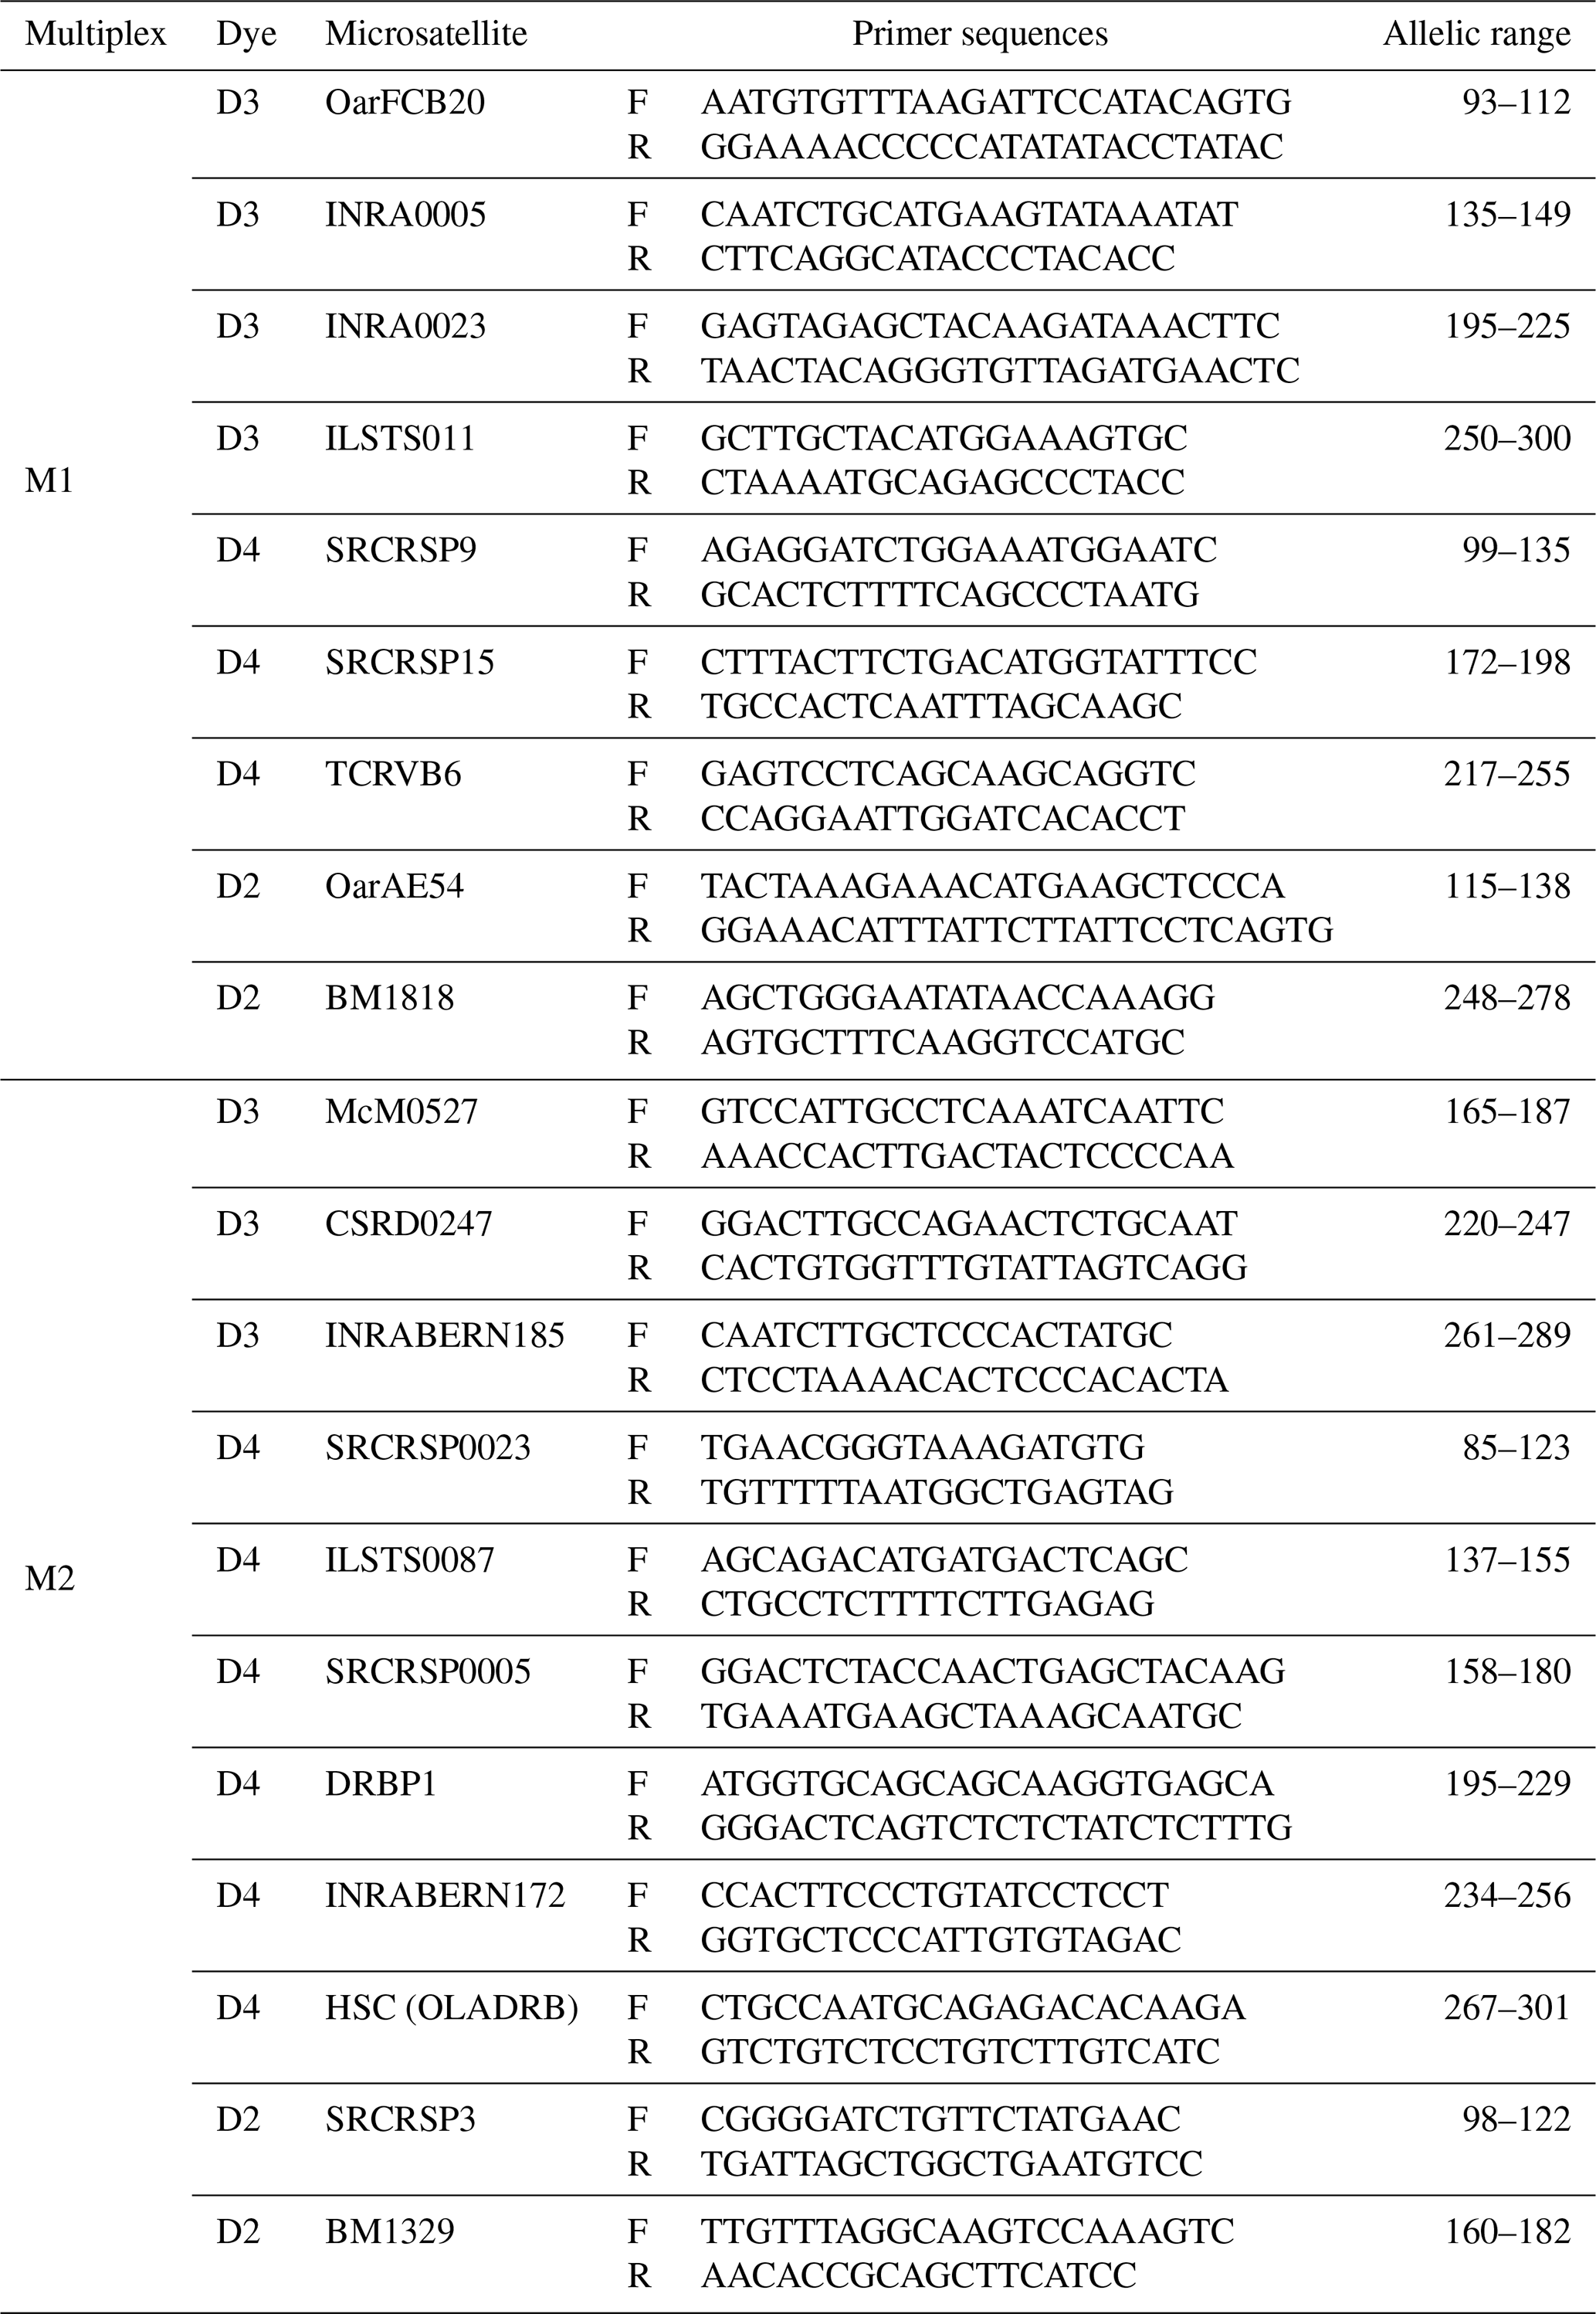
In this study, 20 microsatellite markers were used, following the recommendation of the Food and Agriculture Organization (FAO, 2011). Loci that are likely to overlap due to their allelic ranges are marked with different fluorescent dyes. Loci without the possibility of overlap were marked with the same fluorescent dye, while those with the potential for overlap were marked with a different fluorescent dye. For this reason, forward primers of microsatellites were labeled with WellRed dye (D4, D3, or D2), which is compatible with the genetic analyzer (Beckman Coulter GeXP) used in the study to facilitate capillary electrophoresis and fragment analysis. Table 1 provides a comprehensive summary of the multiplex clusters generated by microsatellites, including the fluorescent dyes employed for labeling.
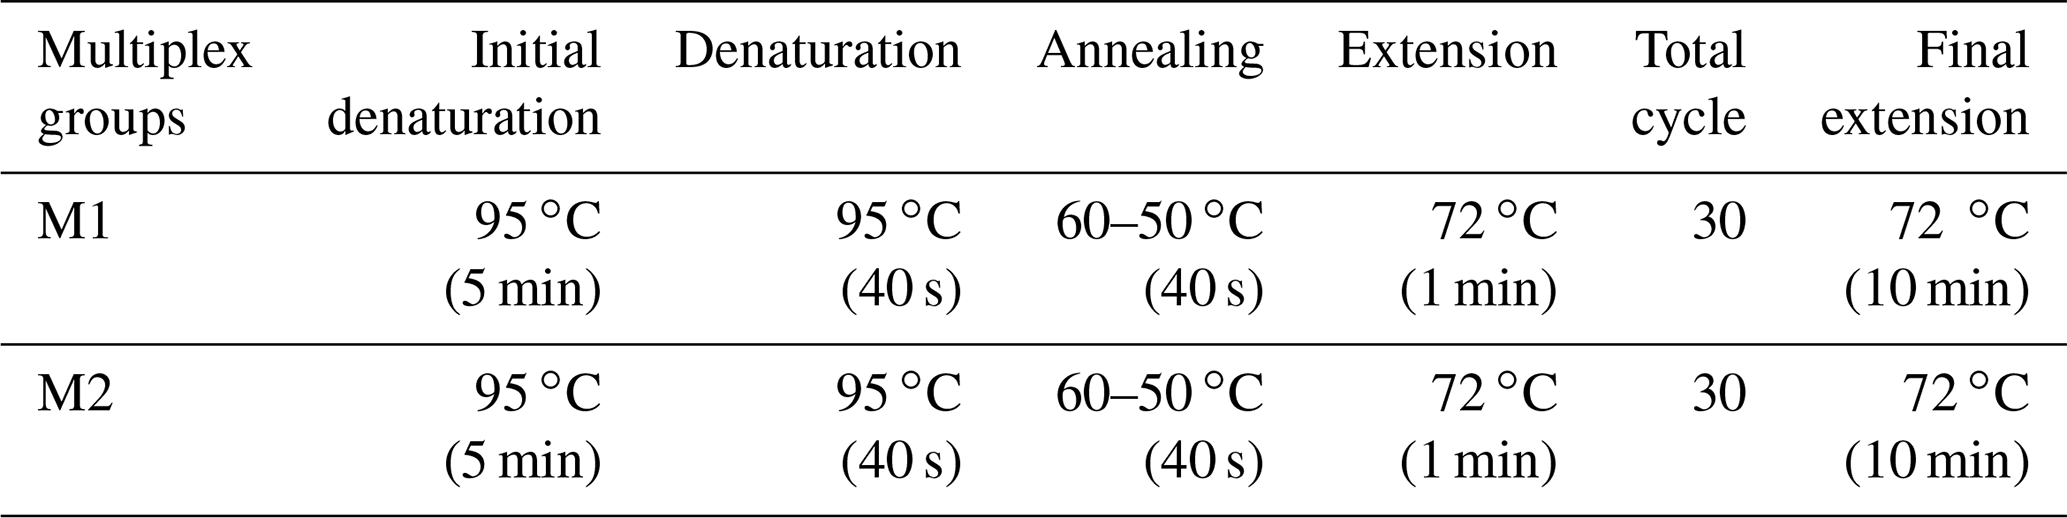
During the PCR stage, 50 ng of genomic DNA and sterile distilled water were used to amplify specific regions of the primer. The PCR tube contained a total volume of 20 µL, which included 1X PCR buffer, 2.0 mM MgCl2, 0.20 mM dNTP mixture (dATP, dTTP, dGTP, dCTP), 0.10 µM of both forward and reverse primers, and 1 U of Taq DNA Polymerase (ABM-G009). The touchdown PCR method, as described by Hecker and Roux (1996), was used for DNA amplification (Table 2). The PCR fragments labeled with fluorescence were separated by means of capillary electrophoresis, utilizing a Beckman Coulter GeXP Genetic Analyzer (Beckman Coulter, Inc., USA).
Table 1Summary information of microsatellites used for analysis in the study.
2.3 Statistical analysis
Various genetic parameters were computed to assess the genetic diversity of the population. These parameters included the number of alleles (Na), mean number of alleles (MNa), effective number of alleles (Ne), polymorphic information content (PIC), observed heterozygosity (Ho), expected heterozygosity (He), and Wright's F statistics (FIT, FIS, FST) (Wright, 1990; Weir and Cockerham, 1984). Additionally, compliance with the Hardy–Weinberg equilibrium was evaluated. The software programs GenAlEx (Peakall and Smouse, 2005, 2012), POPGENE (Yeh et al., 1997), and CERVUS 3.0.3 (Marshall, 1998/2006; Kalinowski et al., 2007) were utilized for these calculations. The software applications Populations 1.2.32 (Langella, 1999) and FigTree 1.4.2 (Rambout, 2006) were employed to generate a neighbor-joining (NJ) phylogenetic tree using Nei's Da distance matrix (Nei et al., 1983) for the populations being investigated. The reliability of the dendrogram's structure was evaluated by means of bootstrap resampling (n=1000). The diversity between breeds (DST), coefficient of gene differentiation (GST), and Nei's gene diversity (HT) were computed using the FSTAT 2.9.3 program (Goudet, 2001). The present study utilized the AFC sur populations module of the GENETIX v4.05 software (Belkhir et al., 2001) to perform factorial correspondence analysis. This analysis aimed to investigate any possible admixtures that may have taken place among the populations under study. The Bayesian approach was employed to examine the population structures via cluster analysis techniques, utilizing the STRUCTURE software (Hubisz et al., 2009; Falush et al., 2003, 2007; Pritchard et al., 2000). The STRUCTURE analysis employed an admixture model and independent allele frequencies, with a length value of 20 000 being set. The number of iterations for the Markov-chain–Monte-Carlo was set to 100 000, and the analysis was performed with 20 replications for different values of K (K = 2–11). The alignment charts were produced based on the STRUCTURE results acquired through the utilization of the CLUMPAK software (Kopelman et al., 2015). The ideal cluster value, denoted as K, was determined by analyzing the data with the STRUCTURE HARVESTER program. The approach utilized to ascertain this quantity was founded on the equation (), as documented by Evanno et al. (2005).
In this study, a total of 522 alleles were identified across 20 microsatellite loci. Table 3 displays the statistics of molecular genetic polymorphism.
The locus INRA0023 exhibited the greatest number of alleles (48), while the locus DRBP1 had the highest effective allele number (16.27). The loci BM1818 and DRBP1 had the highest polymorphic information content value (0.94). The anticipated level of heterozygosity (He) varied between 0.85 (ILSTS011) and 0.94 (BM1818, SRCRSP15, and DRBP1). The mean values of Wright's F statistics, namely FIS, FIT, and FST, were 0.111, 0.153, and 0.047, correspondingly. The mean values for DST, HT, and GST were calculated to be 0.026, 0.029 and 0.903, respectively. The data gathered from the 20 microsatellite loci utilized in the research were assessed for conformity with the Hardy–Weinberg equilibrium (HWE) through the application of the χ2 test. The analysis revealed that the distribution of alleles for all microsatellite markers examined did not adhere to the principles of the Hardy–Weinberg equilibrium. All null allele frequencies obtained from the microsatellites studied were found to be below 20 %. Table 4 presents genetic diversity statistics for Hair goat populations raised in various provinces.
The Hair goat populations raised in Konya and Hatay exhibited the lowest (10.40) and highest (16.25) allele numbers, respectively. The FIS (fixation index) values hold significant importance in defining population structures and determining the extent of heterozygosity losses. FIS values ranged from 0.031 in Muǧla to 0.226 in Burdur. A total of 107 unique alleles were identified in Hair goat populations bred across 10 different provinces. However, only 25 alleles had a frequency above 5 %. The dendrogram depicting the genetic distance, as obtained from the study, is presented in Fig. 2.
Table 3Polymorphism statistics of microsatellite loci studied.
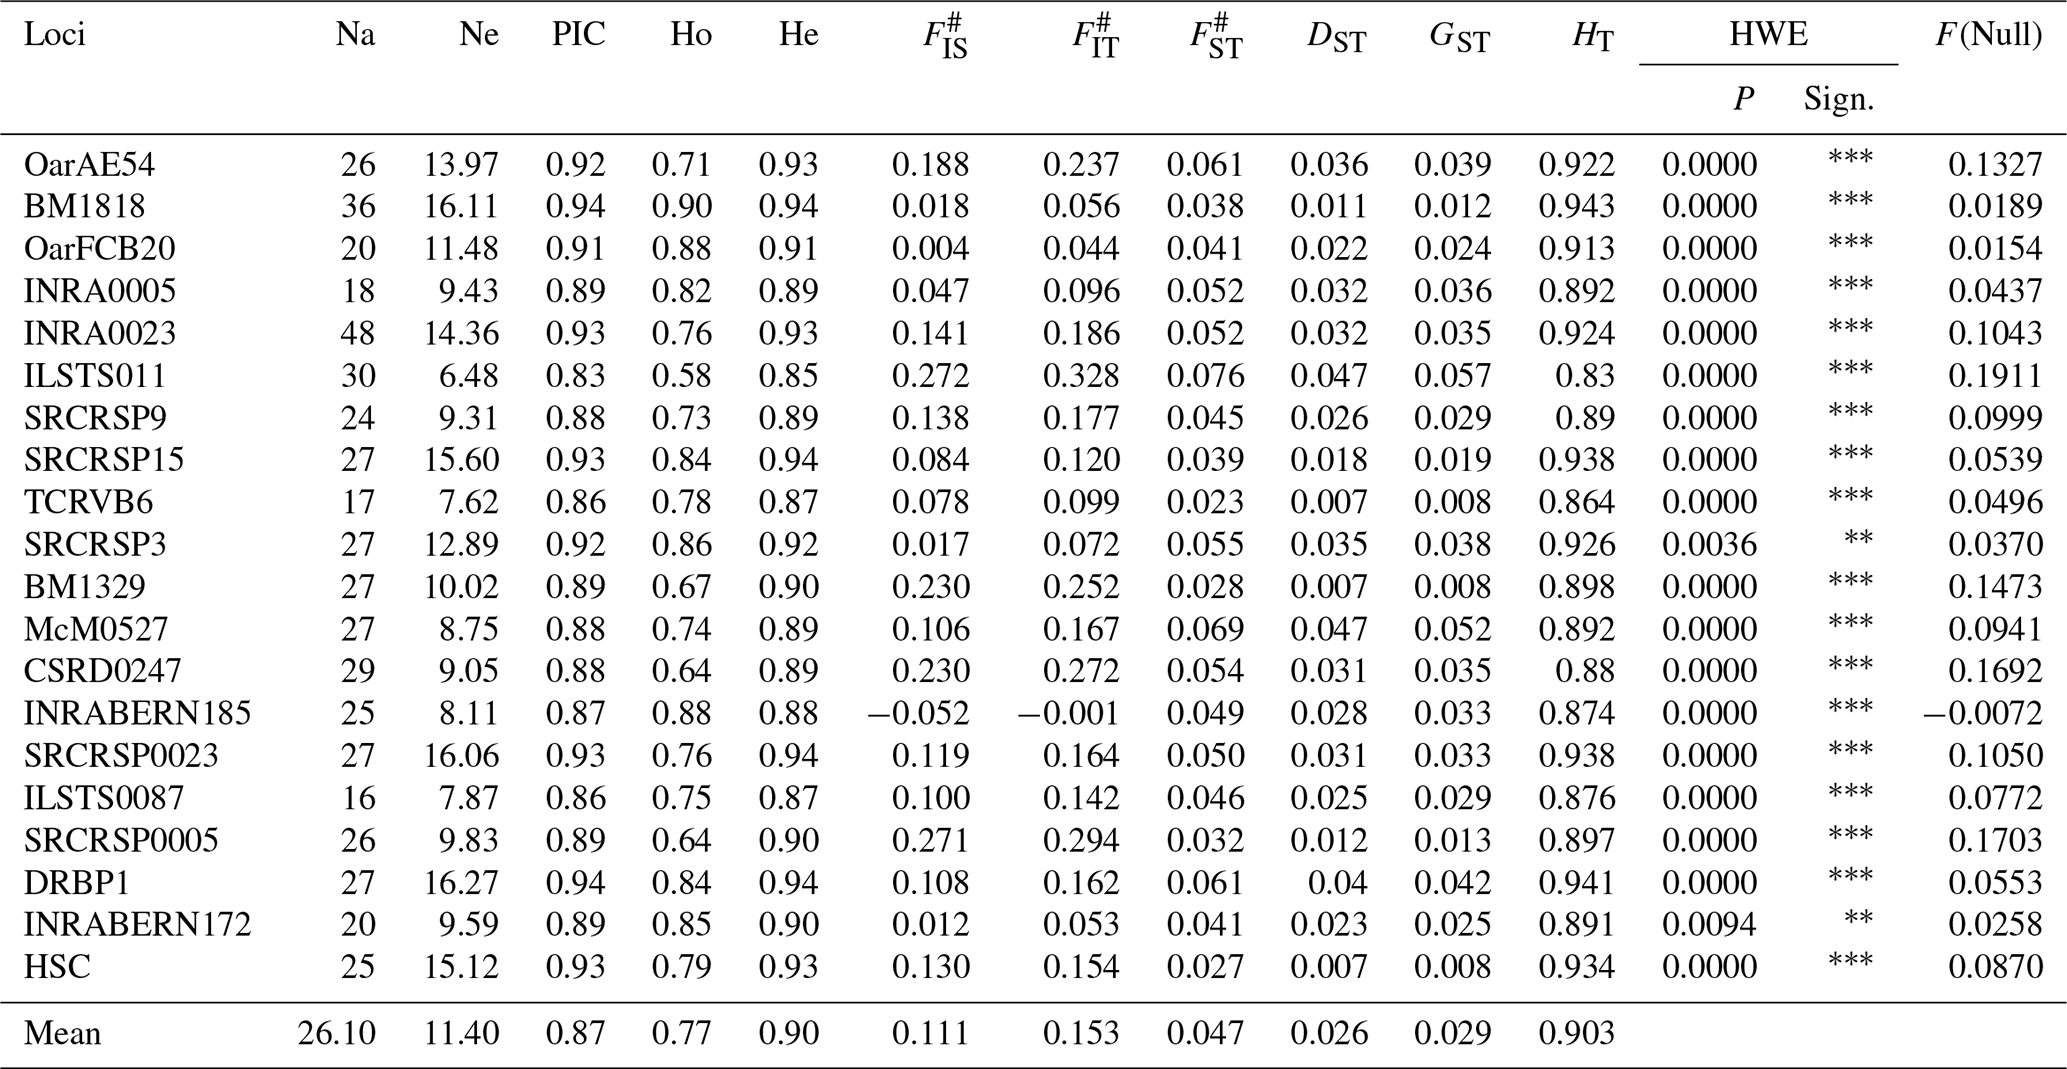
Na is the number of alleles, Ne is the number of effective alleles, PIC is the polymorphic information content, Ho is the observed heterozygosity, He is the expected heterozygosity, # refers to Wright's F statistics (Weir and Cockerham, 1984), DST refers to interracial genetic diversity, GST refers to the coefficient of gene variation, HT refers to Nei's gene diversity, and HWE is the Hardy–Weinberg equilibrium; * indicates P<0.05, indicates P<0.01, indicates P<0.001, and F(Null) indicates null allele frequency.
Table 4Polymorphism statistics in Hair goat populations raised in different provinces.
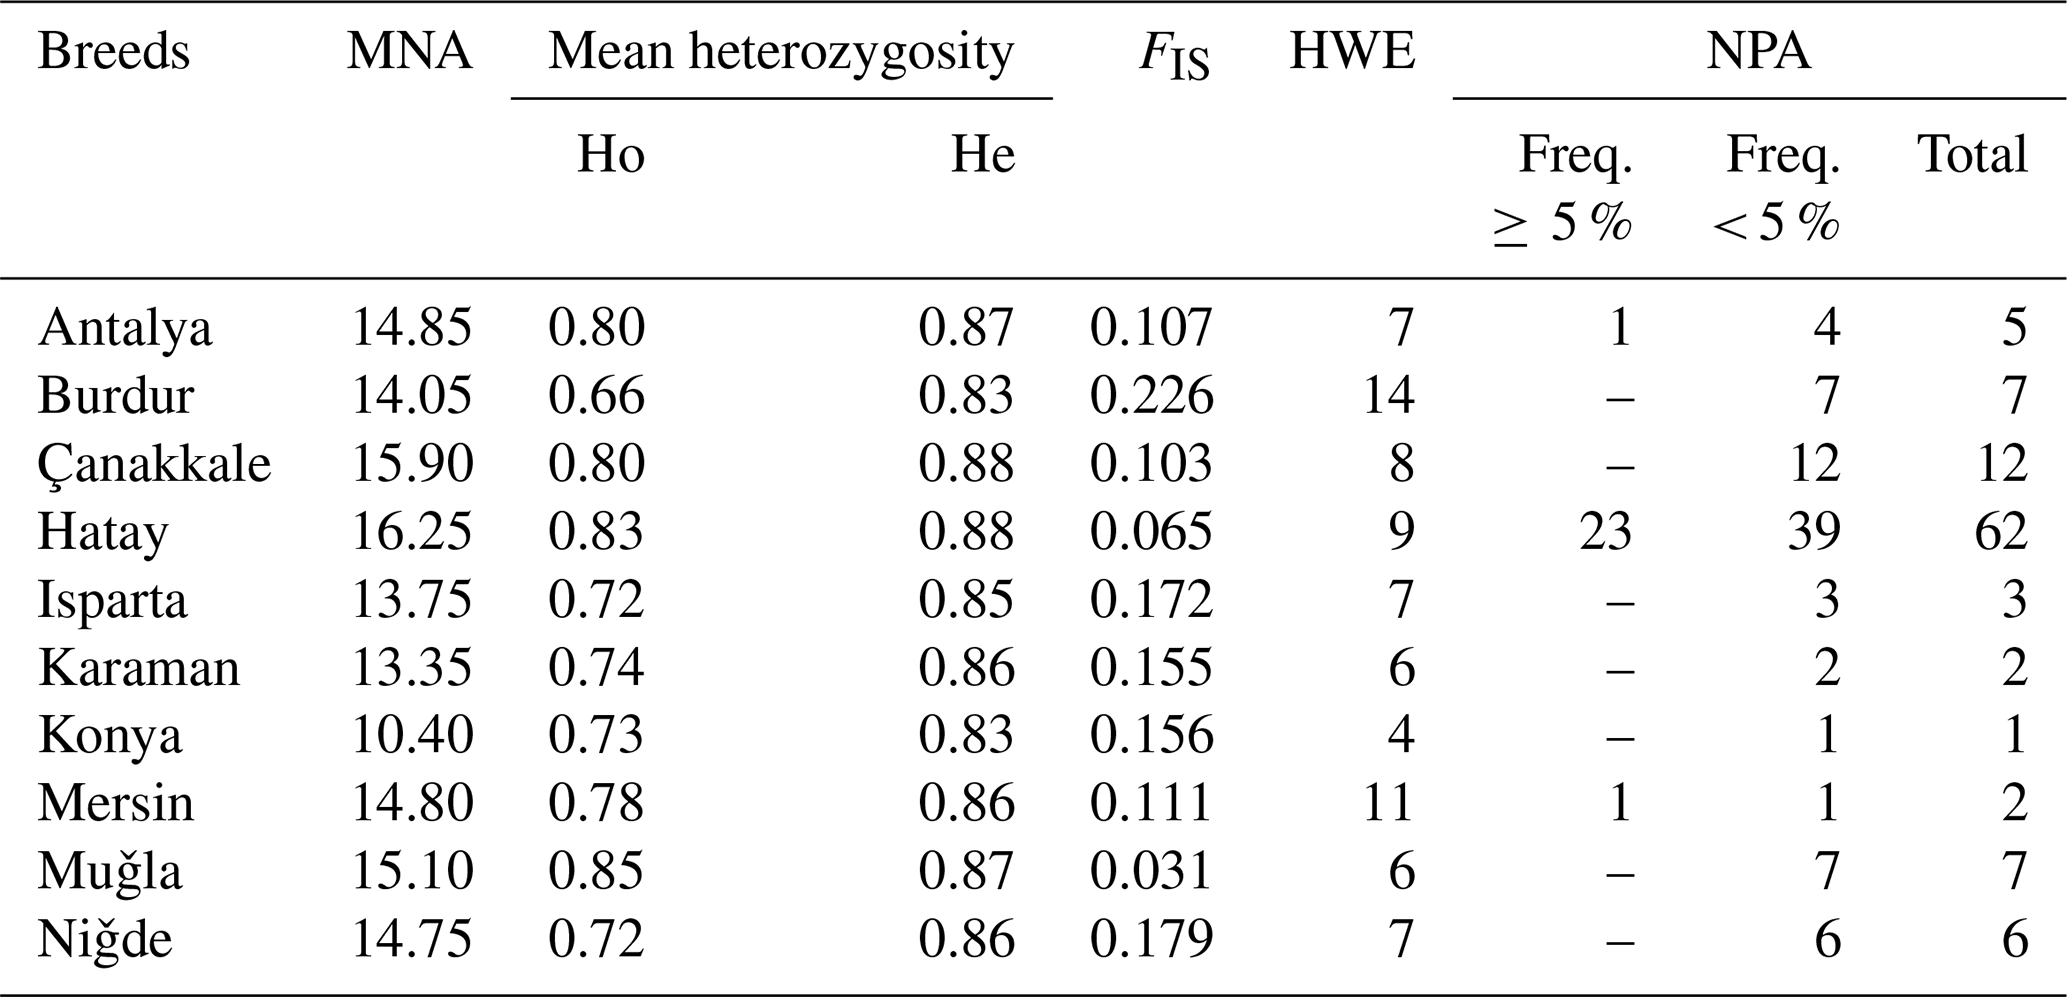
MNA is mean number of alleles, Ho is observed heterozygosity, He is expected heterozygosity, FIS is heterozygote deficiency, HWE is the number of loci not in the Hardy–Weinberg equilibrium (P<0.05), and NPA is private alleles within-breed.
The graph illustrating the factorial correspondence analysis (FCA) is presented in Fig. 3. The graph provided by the FCA illustrates that the population of Hair goats raised in Hatay is distinct from those in other provinces, which appear to be more interconnected.
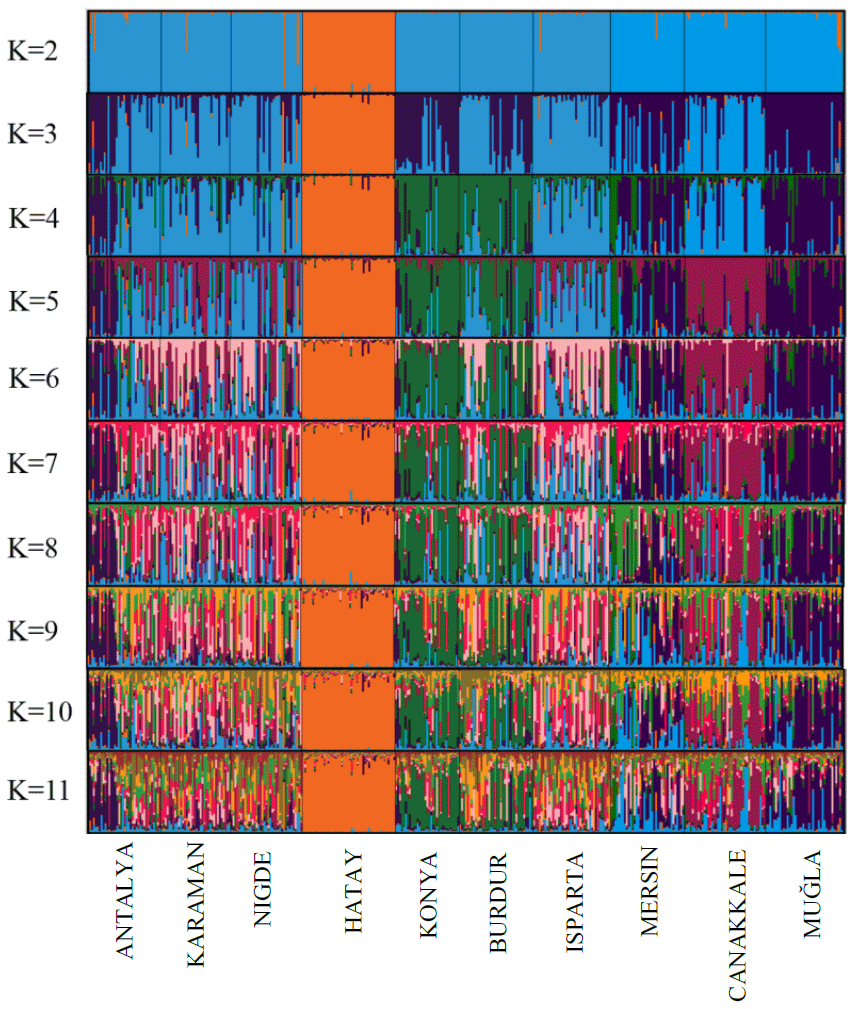
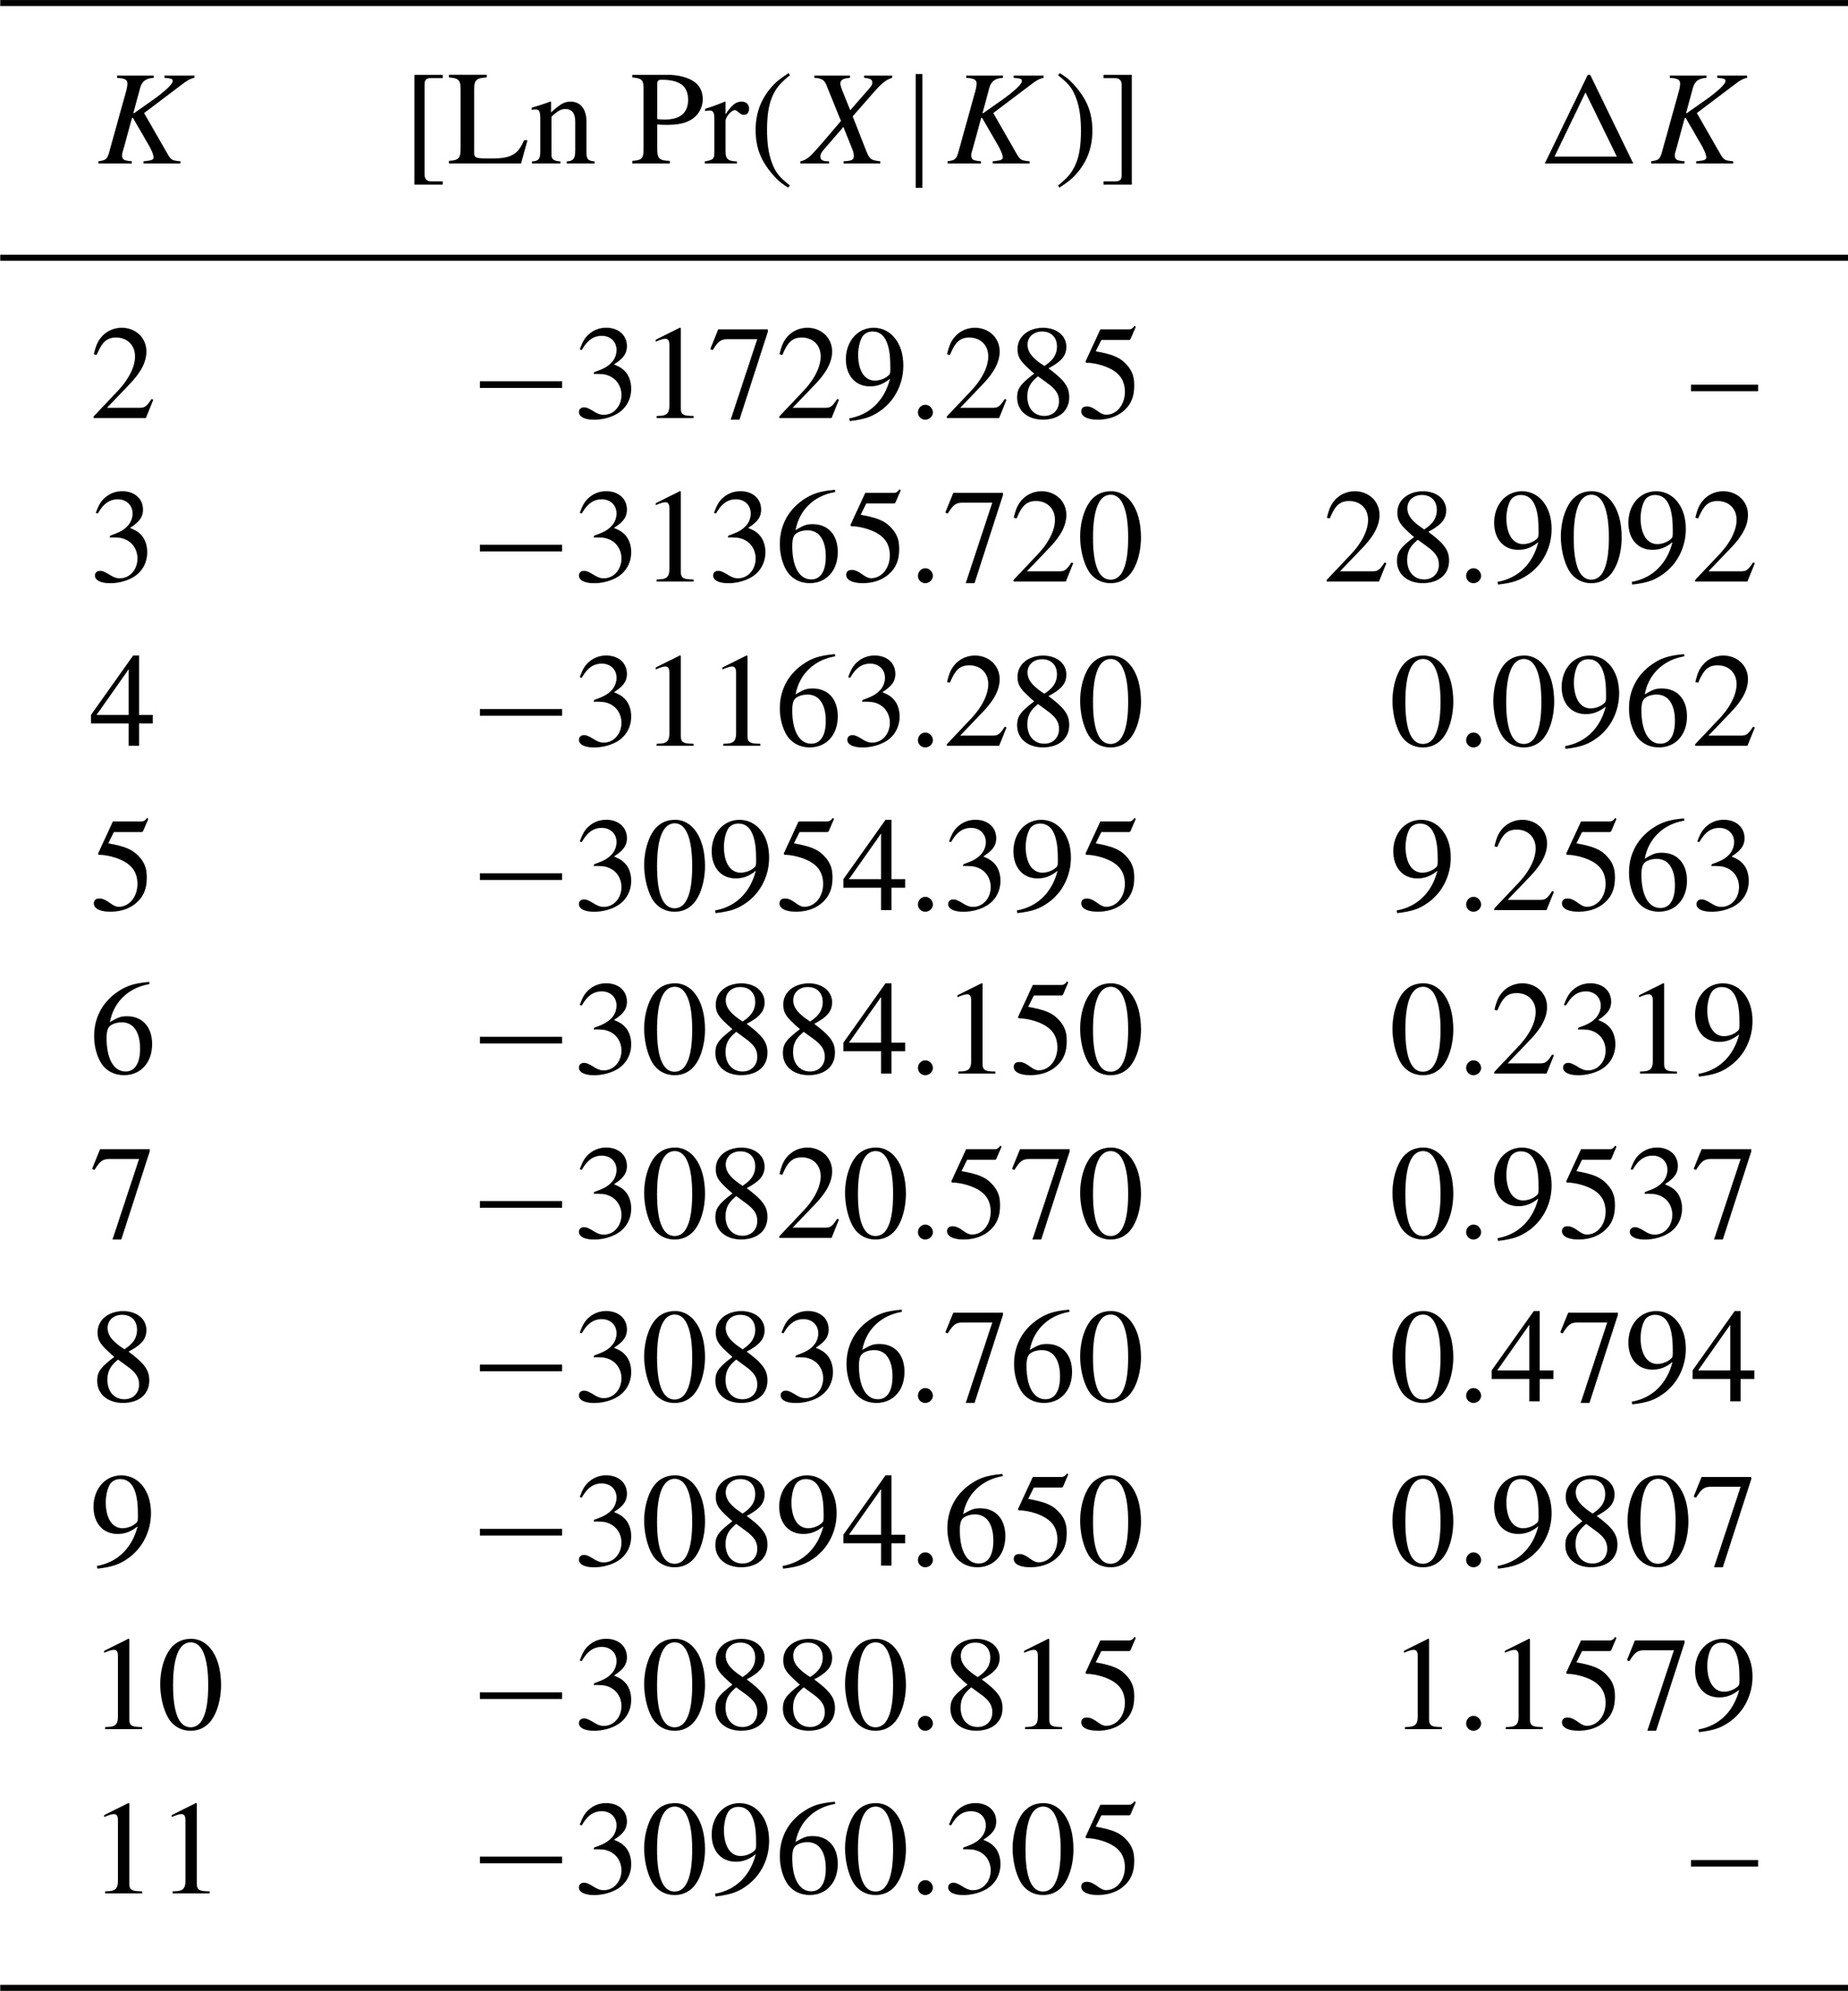
The results of the STRUCTURE analysis, which involved varying clustering numbers (K=2–11), are depicted in Fig. 4. Additionally, Table 5 presents the findings, which include the estimation of posterior probabilities ([Ln Pr (X|K)]) for different clustering numbers (K) and ΔK values.
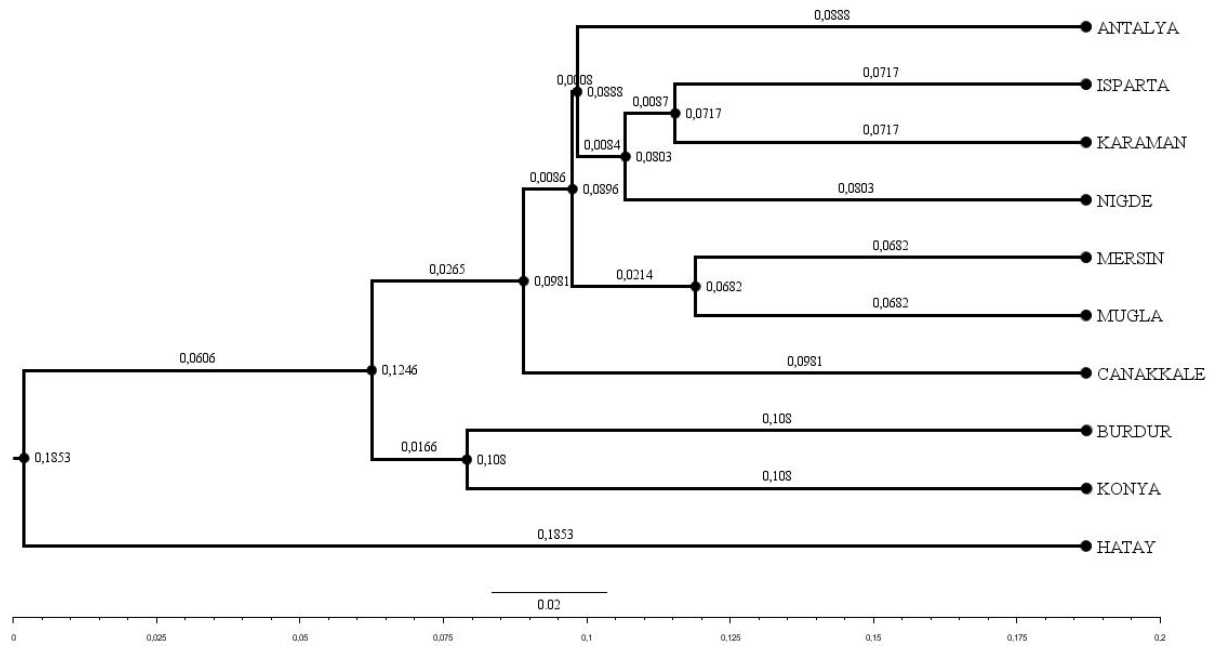
Figure 2Dendrogram obtained using Nei's Da distance matrix (Nei, 1983) (bootstrap resampling methodology (1000 iterations)).
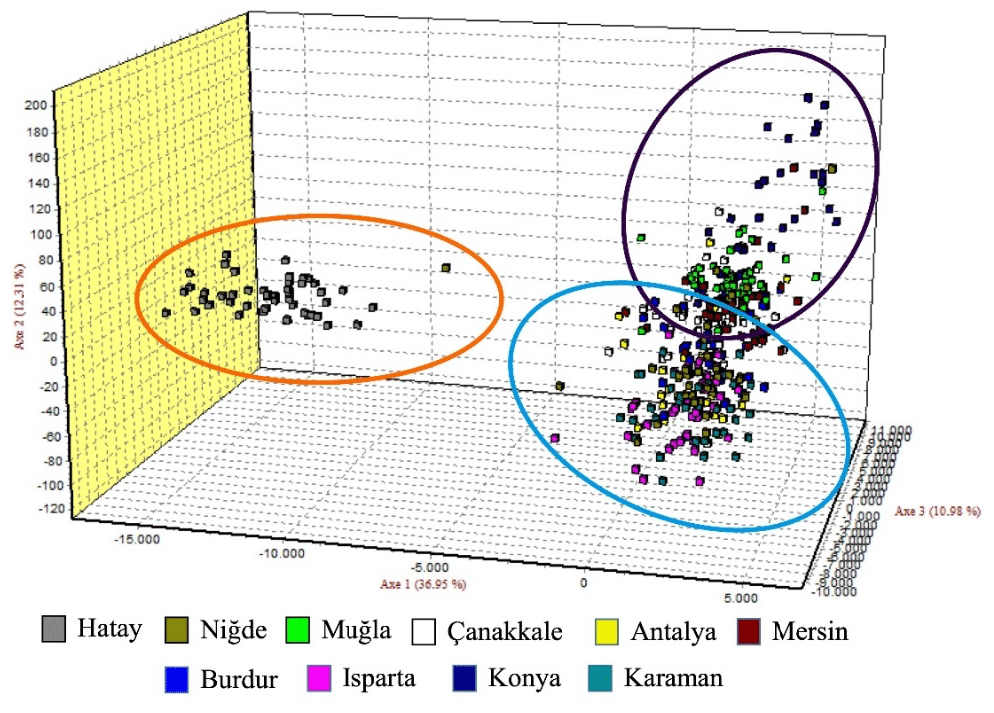
Figure 3Factorial correspondence analysis (FCA) graph belonging to Hair goat populations raised in different provinces.
Hair goats have been raised in the mountainous regions of Türkiye for centuries. These goats have been an important source of income and nutrition for local people due to their ability to survive, especially in mountainous and difficult terrain (Daskiran et al., 2018). Although there are molecular genetic studies on the hair goat, there are a very limited number of genetic diversity studies with such a large sample. The study carried out in this context has revealed very important information about the population structures and intra-breed genetic diversity of Hair goats raised in different geographies of Türkiye.
Table 5Estimation of posterior probabilities ([Ln Pr(X|K)]) for different clustering (K) and ΔK values.
The allele numbers and average polymorphic information content obtained indicate that the 20 microsatellite loci utilized in the study exhibit a remarkably high degree of polymorphism. The high rates of observed heterozygosity, along with the average number of alleles detected at each locus, serve as significant indicators of the considerable genetic diversity present in the Hair goat populations under investigation.
Brito et al. (2017) reported Ho and He values of 0.374 and 0.369, respectively, in their genome-wide association study conducted on goats. Zaman and Shekar (2015) reported a total of 400 alleles in their investigation of Hair goats, whereas the current study identified 522 alleles. The results of this study on Hair goat populations indicate a higher number of alleles and molecular genetic parameter values, including polymorphic information content (PIC) and observed (Ho) and expected heterozygosity (He), compared to previous research on the topic. It is reported that there is a wide phenotypic variation within and between populations in Hair goat populations, which are bred in almost all regions of Türkiye and constitute a large part of the goat population (Cam et al., 2010; Elmaz and Saatcı, 2017). The findings obtained in the presented study, which was carried out with a large sample, revealed that Hair goat populations have a high level of genetic diversity and that the microsatellites used can be used successfully to identify the genetic diversity in Hair goat populations.
The levels of observed heterozygosity in this study were lower than those found in various other breeds bred in Türkiye (Bulut et al., 2016; Gumus, 2018; Gul et al., 2020; Karsli et al., 2022) but higher than those reported for certain other breeds (Agaoglu and Ertugrul, 2012; Gurler and Bozkaya, 2013; Gumus, 2018; Gul et al., 2020; Karsli et al., 2020; Tefiel et al., 2020). In terms of expected heterozygosity, a higher value has been obtained in this study compared to all previous studies (Agaoglu and Ertugrul, 2012; Gurler and Bozkaya, 2013; Bulut et al., 2016; Gumus, 2018; Gul et al., 2020; Tefiel et al., 2020; Karsli et al., 2020, 2022) conducted in Türkiye. The differences in the values revealed for some molecular genetic parameters in this study can be associated with the number of locations where the study was conducted and the sample size.
Upon examination of the FIS values based on the microsatellites, it is notable that there is a reduction in heterozygosity at the INRABERN185 locus, which is one of the loci that was analyzed. The literature on the subject presents comparable results, as reported by Gurler and Bozkaya (2013) and Zaman and Shekar (2015). Hartl et al. (1997) reported, based on the FST classification of the loci studied, that the mean FST value (0.047) indicates relatively low genetic diversity among populations. The calculated FST value was lower than that reported in previous studies (Agaoglu and Ertugrul, 2012; Parejo et al., 2015; Bosman et al., 2015; Dominguez et al., 2018).
The mean coefficient of gene variation (GST) obtained in the study indicates that around 97.10 % of the identified genetic variation can be attributed to differences among individuals. However, the overall mean of DST indicates that there is not a significant level of inter-population variation. This finding, in fact, corroborates the previously mentioned results of FST and GST.
The χ2 test results indicate that the allele distributions of the 20 microsatellite markers examined are not in accordance with the Hardy–Weinberg equilibrium. Similar findings have been revealed in studies conducted on goats (Guang-Xin et al., 2019; Tefiel et al., 2020; Gul et al., 2020). It has been reported that deviations from the Hardy–Weinberg equilibrium (HWE) may occur due to artificial selection, and inbreeding may also contribute to these deviations (Granevitze et al., 2007; Guang-Xin et al., 2018). Due to the breeding programs implemented in all populations included in the study, controlled mating programs are carried out, and intensive selection is conducted. Considering this situation, it is thought that the resulting deviation from the Hardy–Weinberg equilibrium (HWE) is most likely due to selection.
The frequencies of null alleles for the 20 microsatellite loci utilized in this study were found to be below 20 %. This discovery provides tangible evidence that these 20 microsatellites can be utilized with confidence to delineate genetic variability. The MNa values obtained from the study's population were found to be higher than those reported in previous studies conducted on both domestic and foreign breeds (Zaman and Shekar, 2015; Awobajo et al., 2015; Al-Atiyat et al., 2015; Bulut et al., 2016; Tefiel et al., 2020).
Upon examination of the FIS values, which represent the inbreeding coefficient with respect to populations, it was found that there was no loss of heterozygosity within the populations under study, with the exception of INRABERN185.
Although the Hair goat population studied had a total of 107 unique alleles, only 25 of them were found to have a frequency higher than 5 %. The Hatay Hair goat population exhibited the greatest number of private alleles. After analysis, it was found that the private alleles identified in the research were not particularly effective in distinguishing between populations, with the exception of those found in the Hair goat population specifically bred in the Hatay Province.
Upon examination of the dendrogram, it becomes apparent that three distinct clusters emerge. It is worth noting that the Hatay Hair goat population exhibits significant differences from other Hair goat populations. The factorial relationship analysis yielded an FCA graph that showed comparable results.
The outcomes derived from the STRUCTURE analysis were consistent with those of the dendrogram and FCA plot, as anticipated. In the STRUCTURE analysis, a noteworthy discovery is that the Hair goat population bred in the Hatay Province exhibits significant differentiation from other populations. In previous studies conducted in Hatay (Keskin and Bicer, 1997; Gul et al., 2020), it was reported that breeders had been crossbreeding Shami and Hair goat breeds in a non-systematic manner. This study concludes that the variation in Hair goats raised in Hatay, as compared to those raised in other locations, is a result of non-systematic crossbreeding. The most suitable number of groups was determined to be three based on the ΔK value obtained using the method described by Evanno et al. (2005). Considering the fact that all of the sampling was carried out from Hair goat populations, the results of the population structure analysis draw attention to the presence of significant admixtures in these populations. In Türkiye, goat breeding is carried out under extensive conditions, and it is even practiced as nomadic animal husbandry in some regions. It is believed that this admixture in populations may have arisen due to extensive breeding practices and nomadic animal husbandry. On the other hand, when considering the breeding locations of hair goats, it is noteworthy that, in addition to hair goats, Honamlı breeds are raised in Burdur Province, and Saanen breeds are also raised in Çanakkale Province. In the realm of goat breeds, the Honamlı breed distinguishes itself for its meat production capabilities, while the Saanen breed excels in terms of milk yield performance. Among these goat breeds, the Damascus and Saanen breeds have high milk yield performances. Therefore, the admixture observed in these regions can be associated with unsystematic crossbreeding practices carried out by breeders in order to improve specific yield traits. Upon examining the CLUMPAK graph, it is evident that there is a significant level of migration between populations, with the exception of the Hair goat populations raised in Hatay. The fact that Hatay Province has a completely different profile from other Hair goat breeding regions has revealed a very interesting situation. The Damascus breed, which stands out for its milk yield performance, is widely raised in Hatay Province. The difference in the population profile of hair goat populations in Hatay Province strengthens the suspicion that breeders use this breed for crossbreeding to enhance the milk yield of hair goats.
There is a limited amount of research on the molecular diversity of Hair goat populations in Türkiye. Upon considering other goat breeds in Türkiye, it is evident that the Hair goat is the most prevalent and dominant breed. This breed is known for its adaptability to various geographical locations. The current investigation has disclosed significant insights into the genetic variability of Hair goat populations reared across diverse regions of Türkiye, as well as the interrelationship among these populations. The microsatellites utilized in this study possess the potential to provide a precise depiction of the genetic variability present in the examined breeds. The findings of this investigation demonstrate that the microsatellite markers employed for the Hair goat populations exhibited polymorphism. Moreover, the populations under scrutiny exhibited a substantial level of genetic diversity, indicating the reliability of the markers used.
The data underlying the findings of this research article are accessible from the corresponding author upon reasonable request.
AD and ZS designed the experiment. NA and ZG performed all the laboratory experiments. OY and İC performed statistical analyses of experimental data and co-supervision. ArA, AlA, AhA, HB and HHS contributed materials and gathered blood samples. AK performed the investigations. All the authors critically revised the paper and approved the final version.
The contact author has declared that none of the authors has any competing interests.
All procedures involving animals were approved by The Animal Experiments Local Ethics Committee of Republic of Türkiye Ministry of Agriculture and Forestry, International Center for Livestock Research and Training based on document no. 23.05.2017-137.
Publisher’s note: Copernicus Publications remains neutral with regard to jurisdictional claims made in the text, published maps, institutional affiliations, or any other geographical representation in this paper. While Copernicus Publications makes every effort to include appropriate place names, the final responsibility lies with the authors.
We would like to express our gratitude to the Ministry of Agriculture and Forestry of the Republic of Türkiye for providing the necessary animal materials for our study. Additionally, we would like to acknowledge the Agricultural Biotechnology and Food Safety Application and Research Centre (ADÜ-TARBİYOMER) at Aydın Adnan Menderes University for generously providing laboratory facilities to conduct molecular genetic analysis.
This study was supported by Republic of Türkiye Ministry of Agriculture and Forestry General Directorate of Agricultural Research and Policies (Project No: TAGEM/HAYSUD/17/A05/P03/01).
This paper was edited by Henry Reyer and reviewed by three anonymous referees.
Agaoglu, O. K. and Ertugrul, O.: Assessment of genetic diversity, genetic relationship and bottleneck using microsatellites in some native Turkish goat breeds, Small Rumin. Res., 105, 53–60, ohttps://doi.org/10.1016/j.smallrumres.2011.12.005, 2012.
Al-Atiyat, R. M., Alobre, M. M., Aljumaah, R. S., and Alshaikh, M. A.: Microsatellite based genetic diversity and population structure of three Saudi goat breeds, Small Rumin. Res., 130, 90–94, https://doi.org/10.1016/j.smallrumres.2015.07.027, 2015.
Anonymous: https://www.esk.gov.tr/tr/11124/Kil-Kecisi-Kara-Keci (last access: 15 March 2023), 2023.
Atay, O., Gökdal, Ö., and Eren, V.: Reproductive characteristics and kid marketing weights of hair goat flocks in rural conditions in Türkiye, Cuban J. Agr. Sci., 44, 353–358, 2010.
Awobajo, O. K., Salako, A. E., and Osaiyuwu, O. H.: Analysis of genetic structure of Nigerian West African Dwarf goats by microsatellite markers, Small Rumin. Res., 133, 112–117, 2015.
Belkhir, K., Borsa, P., Chikhi, L., Raufaste, N., and Bonhomme, F.: genetix 4.02, logiciel sous Windows TM pour la geìneìtique des populations. Laboratoire Geìnome, Populations, Interactions: CNRS UMR 5000, Universiteì de Montpellier II, Montpellier, France, https://kimura.univ-montp2.fr/genetix/, (last access: 23 January 2023), 2001.
Beuzen, N. D., Stear, M. J., and Chang, K. C.: Molecular markers and their use in animal breeding, Vet. J., 160, 42–52, https://doi.org/10.1053/tvjl.2000.0468, 2000.
Bosman, L., van Marle-Köster, E., and Visser, C.: Genetic diversity of South African dairy goats for genetic management and improvement, Small Rumin. Res., 123, 224-231, 2015.
Brito, L. F., Kijas, J. W., Ventura, R. V., Sargolzaei, M., Porto-Neto, L. R., Cánovas, A., Feng, Z., Jafarikia, M., and Schenkel, F.: Genetic diversity and signatures of selection in various goat breeds revealed by genome-wide SNP markers, BMC Genom., 18, 229, https://doi.org/10.1186/s12864-017-3610-0, 2017.
Bulut, Z., Kurar, E., Ozsensoy, Y., Altunok, V., and Nizamlioglu, M.: Genetic Diversity of eight domestic goat populations raised in Türkiye, Biomed. Res. Int., 2830394, https://doi.org/10.1155/2016/2830394, 2016.
Cam, M. A., Olfaz, M., and Soydan, E.: Possibilities of using morphometrics characteristics as a tool for body weight prediction in Turkish Hair Goats (Kilkeci), Asian J. Anim. Vet. Adv., 5, 52–59, 2010.
Cemal İ., Karaca O., Ata N., Yilmaz O.: Growth rates of Hair goat kids, II. International Livestock Studies Congress, 29–30 October, 130 pp., Antalya, Türkiye, https://arastirma.tarimorman.gov.tr/lalahanhmae/Belgeler/Duyurular/II. International Livestock Studies Congress Book.pdf, (last access: 19 November 2022), 2021
Cemal, İ., Karaca, O., Ata, N., and Yılmaz, O.: Reproductive performances of Kıl goats raised in Aydın and Denizli provinces, 11th International Animal Science Congress, 20–22 October, 525 pp., Kapadokya, Türkiye, e-ISBN: 978–605–80643-1-7, 2019.
Daskiran, I., Savas, T., Koyuncu, M., Koluman, N., Keskin, M., Esenbuga, N., Konyali, A., Cemal, İ., Gul, S., Elmaz, O., Kosum, N., Dellal, G., and Bingöl, M.: Goat production systems of Türkiye: Nomadic to industrial, Small Ruminant Res., 163, 15–20, https://doi.org/10.1016/j.smallrumres.2017.10.001, 2018.
Domiìnguez, M. A., Peìrez de la Rosa, J. D., Landi, V., Peìrez de la Rosa, J., Vazquez, N., Martiìnez, A. M., and Fuentes-Mascorro, G.: Genetic diversity and population structure analysis of the Mexican PastorenÞa Goat, Small Ruminant Res., 168, 76–81, https://doi.org/10.1016/j.smallrumres.2018.09.019, 2018.
Elmaz, Ö. and Saatcı, M. : Turkish hair goat, the main pillar of goat population in Türkiye, in: Sustainable Goat Production in Adverse Environments, edited by: Simoes, J. and Guitterez, C., Vol. II, Local Goat Breeds, 113–130, ISBN: 978-3319891101, 2017.
Erduran, H. and Yaman, B.: Comparasion of growth rate, survivability and body measurements characteristics of Hair × Hair, Saanen × Hair and Alpin × Hair crossbreed kids under mountainous conditions, International Animal Science Congress of Turkish And Relatives Communities, 11–13 September, 114–120, Isparta, Türkiye, ISBN: 978-9944-452-60-1, 2012.
Evanno, G., Regnaut, S., and Goudet, J.: Detecting the number of clusters of individuals using the software STRUCTURE: a simulation study, Mol. Ecol., 14, 2611–2620, https://doi.org/10.1111/j.1365-294X.2005.02553.x, 2005.
Falush, D., Stephens, M., and Pritchard, J.K.: Inference of population structure using multilocus genotype data: linked loci and correlated allele frequencies, Genetics, 164, 1567–1587, https://doi.org/10.1093/genetics/164.4.1567, 2003.
Falush, D., Stephens, M., and Pritchard, J.K.: Inference of population structure using multilocus genotype data: dominant markers and null alleles, Mol. Ecol. Notes, 7, 574–578, https://doi.org/10.1111/j.1471-8286.2007.01758.x, 2007.
FAO: Molecular Genetic Characterization of Animal Genetic Re- sources, FAO, Rome, ISBN: 978-92-5-107032-1, 2011.
Goudet, J.: FSTAT, A Program to Estimate and Test Gene Diversities and Fixation Indices (version 2.9. 3), https://www2.unil.ch/popgen/softwares/fstat.htm (last access: 2 March 2005), 2001.
Guang-Xin, E., Hong, Q. H., Zhao, Y. J., Ma, Y. H., Chu, M. X., Zhu, L., and Huang, Y. F.: Genetic diversity estimation of Yunnan indigenous goat breeds using microsatellite markers, Ecol. Evol., 9, 5916–5924, https://doi.org/10.1002/ece3.5174, 2019.
Guang-Xin, E., Zhao, Y. J., Chen, L. P., Ma, Y. H., Chu, M. X., Li, X. L., Hong, Q. H., Li, L. H., Guo, J. J., Zhu, L., Han, Y. G., Gao, H. J., Zhang, J. H., Jiang, H. Z., Jiang, C. D., Wang, G. F., Ren, H. X., Jin, M. L., Sun, Y. Z., Zhou, P., and Huang, Y. F.: Genetic diversity of the Chinese goat in the littoral zone of the Yangtze River as assessed by microsatellite and mtDNA, Ecol. Evol., 8, 5111–5123, https://doi.org/10.1002/ece3.4100, 2018.
Granevitze, Z., Hillel, J., Chen, G. H., Cuc, N. T. K., Feldman, M., Eding, H., and Weigend, S.: Genetic diversity within chicken populations from different continents and management histories, Anim. Genet., 38, 576–583, https://doi.org/10.1111/j.1365-2052.2007.01650.x, 2007.
Gul, S., Yilmaz, O., Gunduz, Z., Keskin, M., Cemal, I., Ata, N., and Önel, S. E.: The genetic structure of the goat breeds belonging to Northwest part of Fertile Crescent, Small Ruminant Res., 182, 22–28, https://doi.org/10.1016/j.smallrumres.2019.09.009, 2020.
Gumus, N.: The identification of genetic diversity in Turkish native goat breeds by using microsatellite DNA markers, MSc thesis, Thesis No: 495051, Namık Kemal University, Tekirdağ, Türkiye, https://tez.yok.gov.tr/UlusalTezMerkezi/, (last access: 17 September 2022), 2018.
Gurler, S. and Bozkaya, F.: Genetic diversity of three native goat populations raised in the South-Eastern Region of Türkiye, Kafkas Universitesi Veteriner Fakultesi Dergisi, 19, 207–213, https://doi.org/10.9775/kvfd.2012.7475, 2013.
Hartl, D. L., Clark, A. G., and Clark, A. G.: Principles of population genetics, Vol. 116, Sunderland, Sinauer associates, Oxford University Press, ISBN: 9780878933068, 1997.
Hecker, K. H. and Roux, K. H.: High and low annealing temperatures increase both specifity and yield in touchdown and stepdown PCR, Biotechniques, 20, 478–485, https://doi.org/10.2144/19962003478, 1996.
Hubisz, M.J., Falush, D., Stephens, M., and Pritchard, J.K.: Inferring weak population structure with the assistance of sample group information, Mol. Ecol. Resour., 9, 1322–1332, https://doi.org/10.1111/j.1755-0998.2009.02591.x, 2009.
Kalinowski, S. T., Taper, M. L., and Marshall, T. C.: Revising how the computer program CERVUS accommodates genotyping error increases success in paternity assignment, Mol. Ecol., 16, 1099–1106, https://doi.org/10.1111/j.1365-294X.2007.03089.x, 2007.
Karaca, O., Cemal, İ., Taşkın, T., Gökdal, Ö., Yılmaz, O., Yaralı, E., and Özdoğan, M.: Koyun-Keçi Genetik Islah ÇalıştayıNotları. Türkiye Damızlık Koyun Keçi Yetiştiricileri Merkez Birliği yayınları1, 1–229, 2014.
Karaca, O. and Cemal, İ.: BatıAnadolu koyunculugunda genetik kaynakların korunma ve kullanımı, Ege Bölgesi, 1, 573–582, 1998.
Karsli, T., Demir, E., Fidan, H. G., Aslan, M., Karsli, B. A., Arik, I. Z., Semerci, E.S., Karabag, K., and Balcioglu, M. S.: Determination of genetic variability, population structure and genetic differentiation of indigenous Turkish goat breeds based on SSR loci, Small Ruminant Res., 190, 106147, https://doi.org/10.1016/j.smallrumres.2020.106147, 2020.
Karsli, T., Aslan, M., and Demir, E.: Microsatellite diversity and restriction enzyme-based polymorphisms of MHC loci in native Turkish goats, J. Agr. Sci., 28, 626–634, https://doi.org/10.15832/ankutbd.924222, 2022.
Keskin, M. and Biçer, O.: Some morphological and physiological characterıstics of goats bred in Hatay region, J. Agr. Facul. MKU, 2, 73–86, 1997.
Keskin, M., Gül, S., Biçer, O., and Gündüz, Z.: Suitibility of Hair Goat Breeding with regards to Organic Production, Turkish J. Agr.-Food Sci. Technol., 5, 1700–1704, 2017.
Koluman, N., Daşkıran, İ., and S ̧ener, B.: The heat stress effect on T4 (Thyroxin),T3(Triiodothyronine),cortisol hormones of goats in rearing extensive systems, J. Tekirdag Agr. Facul., 10, 29–36, 2013.
Kopelman, N. M., Mayzel, J., Jakobsson, M., Rosenberg, N. A., and Mayrose, I.: Clumpak: a program for identifying clustering modes and packaging population structure inferences across K, Mol. Ecol. Resour., 15, 1179–1191, https://doi.org/10.1111/1755-0998.12387, 2015.
Langella, O.: Populations 1.2.32, https://bioinformatics.org/populations/ (last access: 9 July 2015), 1999.
Marshall, T. C.: Cervus, 3.0. Cervus is a Computer Program for Assignment of Parents to Their Offspring Using Genetic Markers, Cervus, A Windows Package for Parentage Analysis Using Likelihood Approach, http://www.fieldgenetics.com/pages/home.jsp, (last access: 14 January 2023), 2006.
Miller, S. A., Dykes, D. D., and Polesky, H. F.: A simple salting out procedure for extracting DNA from Human nucleated cells, Nucl. Acid. Res., 16, 1215, https://doi.org/10.1093/nar/16.3.1215, 1988.
Montaldo, H. H. and Meza-Herrera, C. A.: Use of molecular markers and major genes in the genetic improvement of livestock, Electron. J. Biotechn., 1, 15–16, https://doi.org/10.2225/vol1-issue2-fulltext-4, 1998.
Montgomery, G. W. and Sise, J.: Extraction of DNA from sheep white blood cells, New Zeal. J. Agr. Res., 33, 437–441, https://doi.org/10.1080/00288233.1990.10428440, 1990.
Nei, M., Tajima, F., and Tateno, Y.: Accuracy of estimated phylogenetic trees from Molecular-Data. 2. Gene-frequency data, J. Mol. Evol., 19, 153–170, https://doi.org/10.1007/BF02300753, 1983.
Parejo, J. C., Padilla, J. A., Calero, R., Martinez-Trancon, M., Sansinforiano, E., Rabasco, A., Salazar, J., and Bravo, J. A.: Population genetic structure and conservation management of Retinta Extremeña goats, Small Ruminant Res., 124, 9–16, https://doi.org/10.1016/j.smallrumres.2015.01.004, 2015.
Peakall, R. and Smouse, P. E.: GenAlEx 6: genetic analysis in Excel. Population genetic software for teaching and research, Mol. Ecol. Notes, 6, 288–295, https://doi.org/10.1111/j.1471-8286.2005.01155.x, 2005.
Peakall, R. and Smouse, P. E.: GenAlEx 6.5: genetic analysis in Excel. Population genetic software for teaching and research – an update, Bioinformatics, 28, 2537–2539, https://doi.org/10.1093/bioinformatics/bts460, 2012.
Pritchard, J. K., Stephens, M., and Donnelly, P.: Inference of population structure using multilocus genotype data, Genetics, 155, 945–959, https://doi.org/10.1093/genetics/155.2.945, 2000.
Rambout, A.: FigTree 1.4.2, http://tree.bio.ed.ac.uk, last access: 9 July 2015.
Simsek, U. G. and Bayraktar, M.: Kıl Kecisi ve Saanen x Kıl kecisi (F1) melezlerinde besi performansıve karkas özellikleri. F U Sag Bil Vet Derg, 21, 15–20, http://veteriner.fusabil.org/pdf/pdf_FUSABIL_486.pdf (last access: 13 October 2022), 2007.
Sirin, E.: Fertility Characteristics of Hair Goats in Tokat Province, Turk. J. Agric.-Food Sci. Technol., 7, 955–957, https://doi.org/10.24925/turjaf.v7i7.955-957.2166, 2019.
Tefiel, H., Ata, N., Fantezi, K., Yılmaz, O., Cemal, İ., Karaca, O., Chahbar, M., Ameur Ameur, A., and Gaouar, S. B. S.: Microsatellite based genetic diversity in indigenous goat breeds reared in Algeria and Türkiye, J. Anim. Plant Sci., 30, 1151–1122, https://doi.org/10.36899/JAPS.2020.5.0127, 2020.
TUİK: Turkish Statistical Institute, https://data.tuik.gov.tr (last access: 18 November 2022), 2021.
Weir, B. S. and Cockerham, C. C.: Estimating F-statistics for the analysis of population-structure, Evolution, 38, 1358–1370, https://doi.org/10.2307/2408641, 1984.
Wright, S.: Evolution in Mendelian Populations, reprinted from genetics, Vol. 16, 97–159, 1931, Mol. Based Math. Biol., 52, 241–295, https://doi.org/10.1093/genetics/16.2.97, 1990.
Yeh, F. C., Yang, R. C., Boyle, T. B. J., Ye, Z. H., and J. X. M.: POPGENE the User-Friendly Shareware for Population Genetic Analysis, edited by: Alberta, U., Canada, https://sites.ualberta.ca/~fyeh/popgene.html, (last access: 24 December 2022), 1997.
Zaman, G. and Shekar, M. C.: Genetic diversity of indigenous goat populations of northeast India including West Bengal based on microsatellite markers, Anim. Mol. Breed., 5, 1–7, https://doi.org/10.5376/amb.2015.05.0003, 2015.