
the Creative Commons Attribution 4.0 License.
the Creative Commons Attribution 4.0 License.
 | 19 Feb 2020
Assessment of genetic diversity in main local sheep breeds from Romania using microsatellite markers
Andreea Dudu
Gina-Oana Popa
Elena Ghiță
Rodica Pelmuș
Cristina Lazăr
Marieta Costache
Sergiu E. Georgescu
The state of the local breeds of farm animals is increasingly precarious worldwide because of the aggressive introduction of breeds with improved economical traits. The preference of the breeders for local breeds is due to their higher adaptability to the particular climate and relief conditions of the mountain areas, to the high rate of assimilation of the feeds from these regions and to their increased resistance to diseases. This study analyzes the genetic variation of the main four local Romanian sheep breeds (Tsurcana, Tsigai, Ratska and Teleorman Blackhead) in terms of stock and economic importance, using 18 microsatellite markers. The mean number of alleles per locus was of 9.764. The values of genetic diversity parameters exhibited a high degree of polymorphism for the analyzed breeds, although inbreeding was highlighted particularly in Tsurcana and Tsigai. These breeds also showed an intense gene flow among them and were less differentiated in comparison with Ratska and Teleorman Blackhead. The results of this study may be useful for breeding programs and conservation plans since the genetic resources of the local breeds must be preserved so as to maintain an adequate level of biodiversity in animal husbandry.
- Article
(1243 KB) - Full-text XML
-
Supplement
(88 KB) - BibTeX
- EndNote


The diversity of the local breeds in Romania is very high, even nowadays, firstly because of the high variety of relief forms, implicitly of the existing ecological systems, as well as because of the substantial inflow of animals from abroad, especially at the end of the First World War when territories of the former Austro-Hungarian Empire returned to Romania. However, significant erosion of the local genetic resources has been noticed as of the 20th century, but it seems that this phenomenon has affected the local Romanian sheep breeds rather little. This is due to the rearing of the different local breeds in limited, geographically isolated areas where the farmers use traditional systems.
In Romania there is an extremely broad variety of local sheep breeds. Tsurcana is the most numerous and widespread sheep breed from Romania and is the starting point of all Wallachian (Zackel) sheep breeds in central and eastern Europe (Ilişiu et al., 2013). This breed has good aptitudes for walking, as well as a high capacity for adapting to difficult environmental conditions, high resistance to diseases and a high capacity to use roughages. Ratska sheep have been long-time considered to be a variety of Tsurcana sheep, but now it is considered to be a different transboundary breed (Savic et al., 2013). In terms of the stock of sheep, this breed is in a good state of preservation in Hungary and in a critical state in Serbia; in Romania, it lost ground to other breeds, currently being raised only in a few locations in the Banat region, at the border with Serbia (Dudu et al., 2016). The Tsigai breed is thought to have originated in Asia Minor, and currently it is widespread in Ukraine, Czech Republic, Hungary and Serbia. In Romania, Tsigai sheep rank second in terms of stock of animals and area of rearing, being a dual-purpose breed, with good milk yields (Ilişiu et al., 2013). The Teleorman Blackhead is a local breed that has been reared for a long time in southern Romania, in the Danube meadows, which was homologated in 2010 under the name Teleorman Blackhead. This breed is very well adapted to meadows and plain areas, but it can successfully acclimatize to hill areas as well (Pelmus et al., 2012).
Many studies have been conducted in recent years on the genetic variability and diversity of the local sheep breeds, using microsatellites analysis. Some of these studies were done in the Balkans area, in Greece (Mastranestasis et al., 2015; Loukovitis et al., 2016), Turkey (Yilmaz et al., 2014), Bulgaria (Kusza et al., 2010) and Romania (Kevorkian et al., 2010). These studies reveal the rather precarious situation of these local breeds, which lose ground to the imported breeds, and the genetic diversity tends to decrease due to the shrinking numbers and because the stocks of sheep are reared increasingly isolated from one another.
The purpose of this study was to obtain information on the genetic diversity of the most important local sheep breeds from Romania, which are also widespread in central and eastern Europe, with the purpose of making an inventory of their genetic resources and of constructing a database which will be available for future programs of sustainable breeding and conservation.
2.1 Sampling and DNA extraction
A total of 308 blood samples were collected from four local sheep breeds: Tsurcana (78 samples), Ratska (82 samples), Teleorman Blackhead (72 samples) and Tsigai (76 samples). The samples come from unrelated animals reared by private producers living in different counties of Romania: Caraş-Severin County (Ratska), Teleorman County (Teleorman Blackhead), Cluj County (Tsigai), Argeș County (Tsurcana) and Dâmbovița County (Tsurcana and Tsigai). For sampling, three different flocks were selected from each breed. Blood samples were collected in compliance with the Directive 2010/63/EU of the European Parliament and of the Council of 22 September 2010 on the protection of animals used for scientific purposes, and all the efforts were made in order to minimize animal suffering. Also, no animals were affected in any way during the sampling.
The DNA was extracted with the Wizard Genomic DNA Purification Kit (Promega), and the quality and quantity were checked using a NanoDrop 8000 spectrophotometer (Thermo Scientific).
2.2 Genotyping
The 18 microsatellites (Table S1 in the Supplement) were amplified by three PCR multiplex reactions, as follows: 3-plex reaction for OarFCB11 (Buchanan and Crawford, 1993), MAF33 (Buchanan and Crawford, 1992a), and OarFCB20 (Buchanan et al., 1994); 8-plex reaction for OarCP20 (Buchanan et al., 1994), OarCP34 (Ede et al., 1995), MAF70 (Buchanan et al., 1993), MAF214 (Buchanan and Crawford, 1992b), MAF65 (Buchanan et al., 1992), BM143 (Maddox et al., 1996), McM42 (Dalvit et al., 2008) and HSC (Scott et al., 1991); 7-plex reaction for MAF35 (Swarbrick et al., 1991), OarCP49 (Ede et al., 1995), BM1314, TGLA53 (Bishop et al., 1994), INRA063, INRA127 (Vaiman et al., 1994), and McM527 (Hulme et al., 1994). The PCR reactions were done in a final volume of 25 µL containing polymerase buffer, 1.5 mM MgCl2, 200 µM dNTPs, 30 ng DNA template, 0.5 U of AmpliTaq Gold DNA Polymerase and nuclease-free water. The concentration of each primers pair was adjusted to ensure a rather equal amplification for each microsatellite. The amplification programs for PCR multiplex reactions were comprised of 35 cycles consisting in denaturation, for 30 s at 95 ∘C, hybridization, for 30 s at 59 ∘C, and extension, for 75 s at 72 ∘C. The initial step was done at 95 ∘C for 10 min, followed in the end by a step of extension for 60 min at 72 ∘C. The PCR products were mixed and subjected to capillary electrophoresis with fluorescent detection using an ABIPrism310 Genetic Analyzer (Applied Biosystems). Gene-Scan 500 LIZ Size Standard (Applied Biosystems) was used as a molecular weight marker. The results were processed by GeneMapper 4.0 (Applied Biosystems).
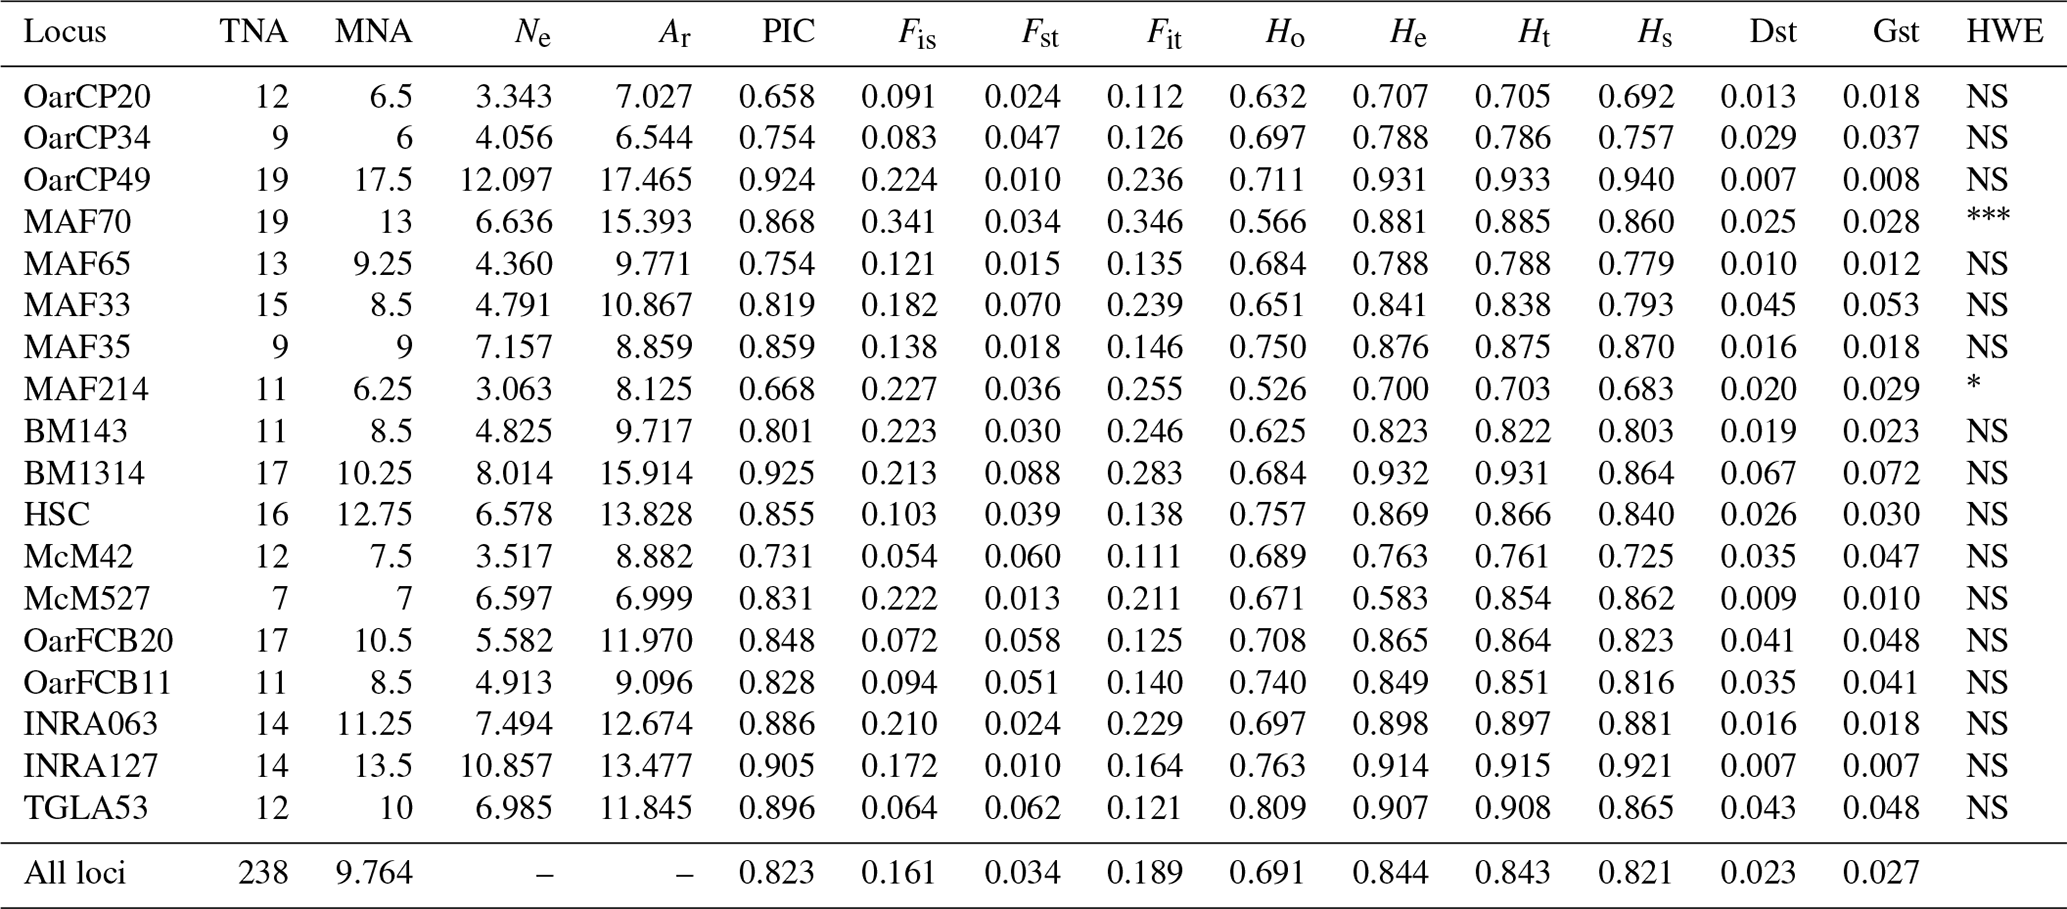
Table 1Genetic diversity parameters estimated for 18 microsatellite markers over all populations. TNA – total number of alleles; MNA – mean number of alleles; Ne – effective number of alleles; Ar – allelic richness; PIC – polymorphic information content for each locus; F statistics (Fis, Fst, Fit); Ho – observed heterozygosity; He – expected heterozygosity; Ht – Nei's gene diversity; Hs – diversity within breeds; Dst – diversity between breeds; Gst – coefficient of gene differentiation; HWE – test for significant deviation from Hardy–Weinberg equilibrium with the hypothesis of the heterozygote excess (; ; ).
2.3 Data analysis
Total number of alleles, allelic frequencies, total number of alleles per locus (TNA), mean number of alleles (MNA), effective number of alleles (Ne), observed heterozygosity (Ho) and expected heterozygosity (He) were calculated with GENETIX 4.05.2 (Belkhir et al., 2004) and GenAlEx 6.503 (Peakall and Smouse, 2012). Polymorphic information content (PIC) and Hardy–Weinberg equilibrium were calculated using CERVUS software. The estimates of Wright statistics indices per locus and overall loci and gene diversity, allelic richness per locus and population, Nei's gene diversity (Ht), diversity between breeds (Dst) and coefficient of gene differentiation (Gst) values and pairwise were calculated with FSTAT (Goudet, 1995). As a measure of the genetic distance between the breeds, we determined pairwise Fst for all pairs of populations using FSTAT software.
In order to infer the differentiation among the investigated breeds, we used a factorial correspondence analysis (FCA) implemented in Genetix 4.05.2. The genetic structure of the populations was analyzed using STRUCTURE software (Pritchard et al., 2000). The tests were performed using an admixture model, in which the allelic frequencies were correlated. In order to select the appropriate number of inferred populations, several analyses were conducted with K (number of populations inferred) ranging from 2 to 6, a total of 300 000 iterations (burn-in period 3000) and 10 independent replications for each analysis. The real K values were gathered using the Structure Harvester (Earl and Von Holdt, 2012), according to Evanno's method (Evanno et al., 2005). This algorithm offers the identification of the appropriate number of clusters using ΔK, based on the rate of change in the log probability of the data.
3.1 Genetic variation among and within breeds
We tested all 18 loci with MICRO-CHECKER (Van Oosterhout et al., 2004) and did not detect evidence for genotype inferring errors due to stuttering, neither for large allele dropout nor for a high frequency of null alleles.
A total of 238 alleles were observed for the 18 analyzed loci. The characteristics of the analyzed loci along with the genetic variability statistics are summarized in Table 1. The total number of alleles per locus ranged from 9 (OarCP34) to 19 (MAF70), while the mean number of alleles per locus varied between 6 and 13 for the same loci, with a mean number of alleles per locus of 9.764. The effective number of alleles per locus ranged between 3.063 (MAF214) and 12.097 (OarCP49). The PIC values were between 0.658 (OarCP20) and 0.925 (BM1314), with a mean of 0.823 for all the loci.
Mean Ho and He were higher than 0.5 for all loci. However, the value of Ho for all loci was lower than the value of He, indicating an excess of homozygosity. The values for He ranged from 0.700 to 0.932, values that together with the ones of PIC demonstrate that the microsatellites were properly selected to infer the genetic variation (Takezaki and Nei, 1996). F statistics of overall loci were Fis=0.161, Fit=0.189 and Fst=0.034. Mean Fst (0.034) was moderate to low while Hs (0.821) was relatively high. Nei's gene diversity index (Ht) for loci ranged from 0.703 (MAF214) to 0.933 (OarCP49), with an average of 0.821 (Table 1). The Ho values for Romanian breeds ranged from 0.652 for Tsurcana to 0.741 for Teleorman Blackhead (Table 2).
Table 2Genetic variability for Romanian sheep breeds (standard error values are in the brackets). Na – number of different alleles; Ne – number of effective alleles; MNA/locus – mean number of alleles per locus; Ar – allelic richness; Par – private allelic richness; Ho – observed heterozygosity; He – expected heterozygosity; Fis – Fis values (averaged over all loci); Deviation HWE – deviations from Hardy–Weinberg equilibrium.
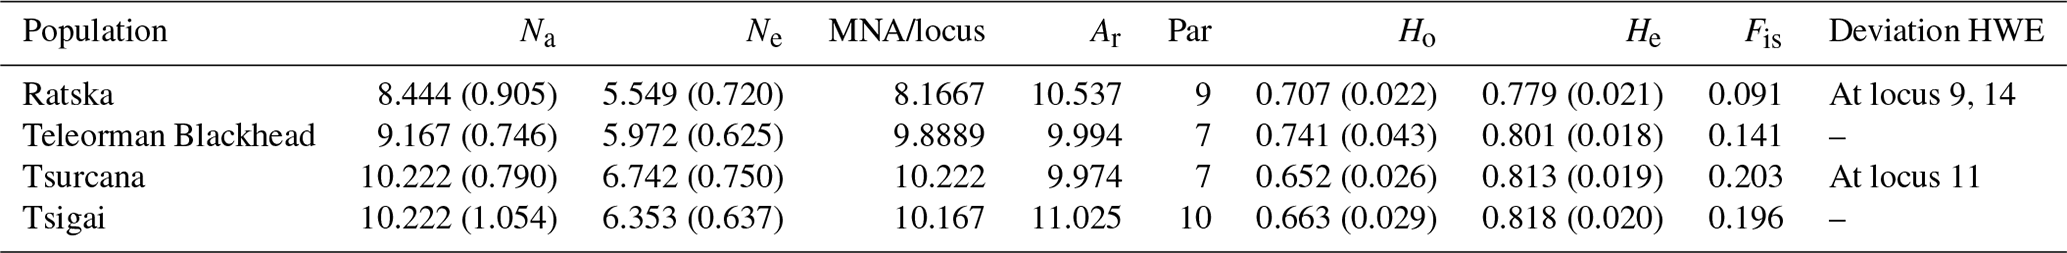
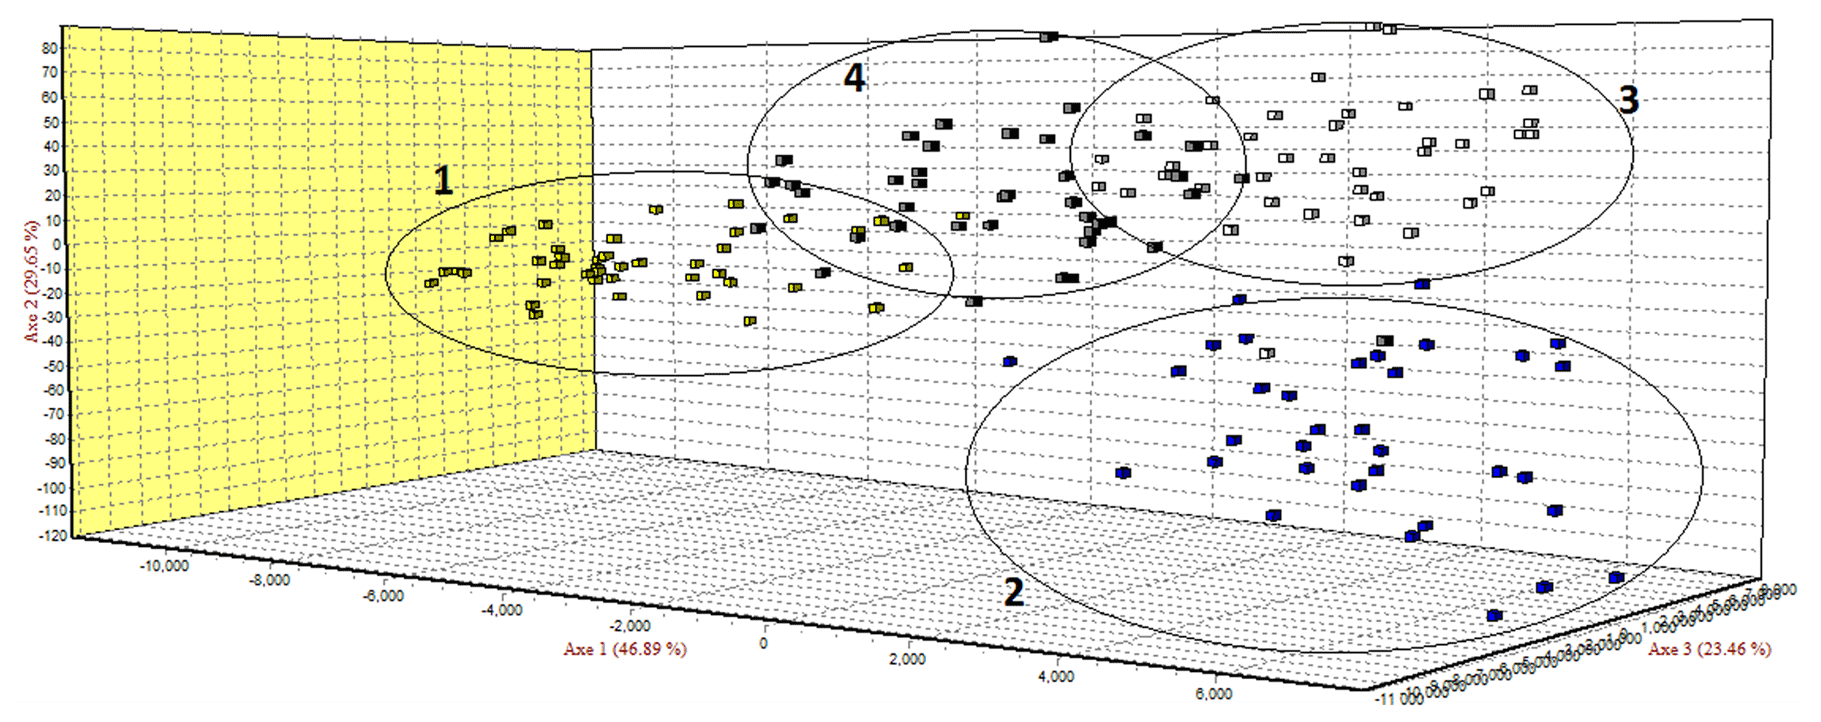
Figure 1Factorial correspondence analysis (FCA) of four local sheep breeds from Romania: (1) Ratska, (2) Teleorman Blackhead, (3) Tsurcana and (4) Tsigai.
3.2 Genetic differentiation
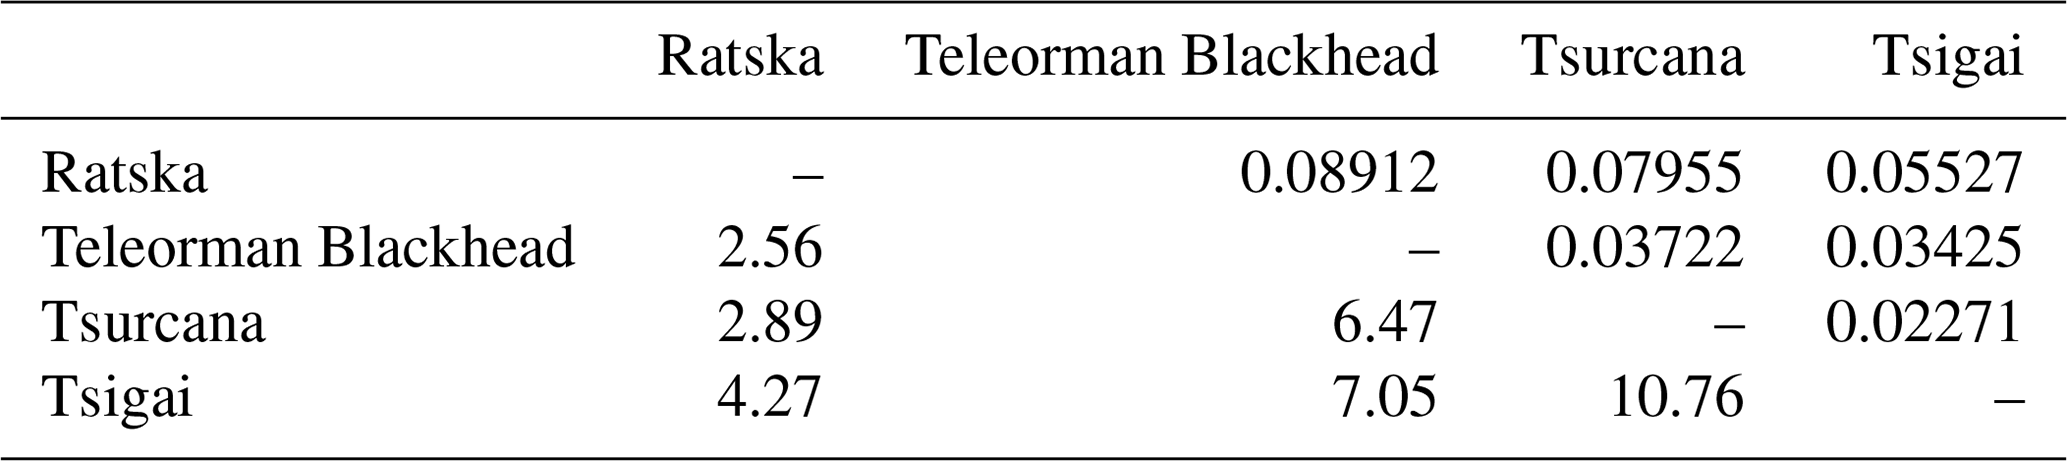
The Fst values of pairwise comparisons among the Romanian sheep ranged from 0.02271 between Tsurcana and Tsigai to 0.08912 between Ratska and Teleorman Blackhead. The number of migrants (Nm) was correlated with the values of Fst and ranged from 10.76 between Tsurcana and Tsigai to 2.56 between Teleorman Blackhead and Ratska (Table 3).
Table 3Pairwise genetic differentiation (Fst) (above the diagonal) and number of migrants per generation (Nm) (below the diagonal).
The FCA analysis has shown that Ratska and Teleorman Blackhead are clearly separated, while between Tsurcana and Tsigai the separation is less noticeable (Fig. 1). According to the STRUCTURE analysis, the most likely value of ΔK was obtained for K=4, indicating that the four breeds analyzed in this study can be assigned to four clusters (Fig. 2). In graphical representation of the clustering breeds (Fig. 3), each color represents one cluster, and the length of the colored segment shows the individual's estimated proportion of membership in that cluster. Black lines separate the individuals of the four local Romanian breeds.

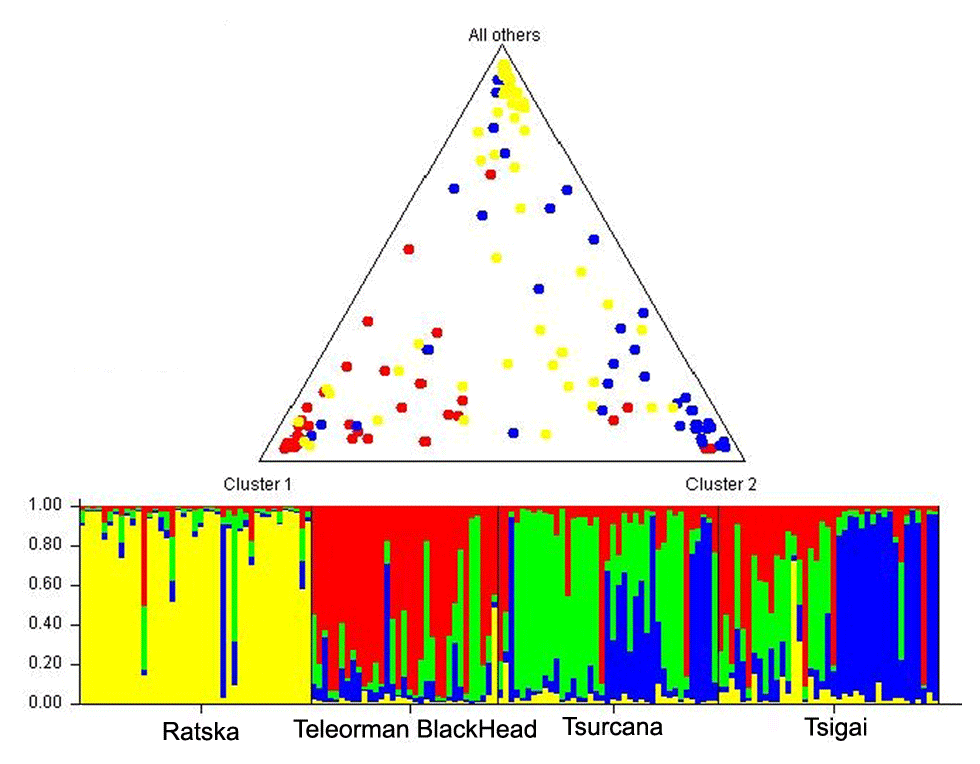
Figure 3Genetic structure of Romanian breeds inferred by Bayesian analysis at K=4 using STRUCTURE program. Ratska – yellow; Teleorman Blackhead – red; Tsurcana – green; Tsigai – blue. The colored bar plots show the assignment of individual according to Q values. Triangle plot displays average admixture according of these four breeds.
The values of genetic diversity parameters were higher compared with similar study of Tsigai and Zackel type group sheep breeds from central, eastern and southern European regions (Kusza et al., 2008). Also, the mean He value of all 18 loci (0.844) was higher than the values reported in the literature (Kusza et al., 2008, 2010, 2011; Neubauer et al., 2015). Positive values of Fis indicate loss of heterozygosity in all loci, similar with the results reported by Kusza et al. (2008, 2011), Kevorkian et al. (2010) and Zahan et al. (2011). The overall value of Dst (0.023) and the value of mean Fst (0.034) were low, indicating a low genetic diversity between breeds. The Gst value that shows the diversity within breeds relative to the diversity of the entire population is 0.027 and indicates that 2.7 % of total genetic variation is due to the differences between the populations. A total of 14 loci were in Hardy–Weinberg equilibrium, while MAF 214 and MAF70 deviate from this (Table 1).
Several indicators of variability within a breed like Na, Ne and MNA highlighted the highest values for Tsurcana and Tsigai, followed by Teleorman Blackhead and Ratska (Table 2). The values were higher than the ones reported in the literature for breeds from this region, such as Teleorman Blackhead and Tsigai (Kusza et al., 2008, 2011). The obtained He values for all breeds were higher than Ho values indicating that several factors, and mostly inbreeding, might contribute to less than expected heterozygosity in a population. The Fis values were positive but lower than the ones reported by Kusza et al. (2008, 2011). However, with the exception of the Fis value for Tsurcana, the rest are not significantly different from zero. The degree of inbreeding was higher in Tsurcana and Tsigai, followed by Ratska and Teleorman Blackhead. Regarding genetic differentiation, the highest degree of gene flow (highest Nm value) was found between Tsurcana and Tsigai, which is also supported by the fact that the two breeds had the lowest Fst value among all pairwise comparisons (Table 3). This suggests that Tsurcana and Tsigai breeds might have a common history and breeding practices.
In the FCA analysis, Ratska and Teleorman Blackhead are clearly separated, while separation is less noticeable between Tsurcana and Tsigai. Teleorman Blackhead is grouped in a cluster differentiated from the rest of analyzed breeds, while Ratska and Tsurcana are also clearly separated and they have the second highest pairwise Fst value (Fig. 1). These findings are supported by the fact that Ratska and Teleorman Blackhead had the highest value of pairwise Fst, while between Tsurcana and Tsigai there is a great gene flow. Overall, the differentiation patterns observed in the FCA analysis are generally in agreement with the pairwise Fst estimates of the studied breeds. According to the STRUCTURE analysis, Ratska and Teleorman Blackhead appear as two genetically distinct groups, while Tsurcana and Tsigai remain less differentiated.
The results showed high levels of genetic variability for all local sheep breeds from Romania. The Fis had positive values for all breeds, but they were significantly higher in Tsurcana and Tsigai, which also showed an intense gene flow between them and a low degree of genetic differentiation. Tsurcana and Tsigai breeds have a common history and mutual breeding practices with exchange of animals between flocks. This is also reflected in the clustering obtained by STRUCTURE analysis, which highlighted that Ratska and Teleorman Blackhead were well differentiated in comparison with Tsurcana and Tsigai. Overall, the level of genetic diversity could be attributed to lack of artificial selection pressure and high level of gene flow among breeds typical of traditional breeding systems.
The data sets are available upon request from the corresponding author.
The supplement related to this article is available online at: https://doi.org/10.5194/aab-63-53-2020-supplement.
AD and GOP performed the data analyses and wrote the manuscript. EG, RP and CL contributed to the conception of the study and provided the samples. AD and SEG did the statistical analysis. EG, MC and SEG designed the experiment and revised the manuscript.
The authors declare that they have no conflict of interest.
This work was supported by UEFISCDI, Complex project PN-III-P1-1.2-PCCDI-2017-0473 “From classical animal nutrition to precision animal nutrition, scientific foundation for food security”, Project 4 “Development of feed products based on plants extracts, which to enhance animal performance by manipulation of the rumen environment”.
This research has been supported by the UEFISCDI (grant no. PN-III-P1-1.2-PCCDI-2017-0473).
This paper was edited by Steffen Maak and reviewed by Ante Ivanković and one anonymous referee.
Belkhir, K., Borsa, P., Chikhi, L., Raufaste, N., and Bonhomme, F.: GENETIX 4.05, logiciel sous WindowsTM pour la génétique des populations, Laboratoire Génome, Populations, Interactions, CNRS UMR 5000, Université de Montpellier II, Montpellier, France, 2004.
Bishop, M. D., Kappes, S. M., Keele, J. W., Stone, R. T., Sunden, S. L., Hawkins, G. A., Toldo, S. S., Fries, R., Grosz, M. D., and Yoo, J.: A genetic linkage map for cattle, Genetics, 136, 619–639, 1994.
Buchanan, F. C. and Crawford, A. M.: Ovine microsatellite polymorphism at the MAF33 locus, Anim. Genet., 23, 186, https://doi.org/10.1111/j.1365-2052.1992.tb00044.x, 1992a.
Buchanan, F. C. and Crawford, A. M.: Ovine dinucleotide repeat polymorphism at the MAF214 locus, Anim. Genet., 23, 394, https://doi.org/10.1111/j.1365-2052.1992.tb00167.x, 1992b.
Buchanan, F. C. and Crawford, A. M.: Ovine microsatellites at the OarFCB11, OarFCB128, OarFCB193, OarFCB266 and OarFCB304 loci, Anim. Genet., 24, 145, https://doi.org/10.1111/j.1365-2052.1993.tb00269.x, 1993.
Buchanan, F. C., Swarbrick, P. A., and Crawford, A. M.: Ovine dinucleotide repeat polymorphism at the MAF65 locus, Anim. Genet., 23, 85, https://doi.org/10.1111/j.1365-2052.1992.tb00026.x, 1992.
Buchanan, F. C., Littlejohn, R. P., Galloway, S. M., and Crawford, A. M.: Microsatellites and associated repetitive elements in the sheep genome, Mamm. Genome, 4, 258–264, https://doi.org/10.1007/BF00417432, 1993.
Buchanan, F. C., Galloway, S. M., and Crawford, A. M.: Ovine microsatellites at the OarFCB5, OarFCB19, OarFCB20, OarFCB48, OarFCB129 and OarFCB226 loci, Anim. Genet., 25, 60, https://doi.org/10.1111/j.1365-2052.1994.tb00461.x, 1994.
Dalvit, C., Sacca, E., and Cassandro, M.: Genetic diversity and variability in Alpine sheep breeds, Small Ruminant Res., 80, 45–51, https://doi.org/10.1016/j.smallrumres.2008.09.005, 2008.
Dudu, A., Ghita, E., Costache, M., and Georgescu, S. E.: Origin and genetic diversity of Romanian Racka sheep using mitochondrial markers, Small Ruminant Res., 144, 276–282, https://doi.org/10.1016/j.smallrumres.2016.10.016, 2016.
Earl, D. and Vonholdt, B.: Structure Harvester: a website and program for visualizing STRUCTURE output and implementing the Evanno method, Conserv. Genet. Resour., 4, 359–361, https://doi.org/10.1007/s12686-011-9548-7, 2012.
Ede, A. J., Pierson, C. A., and Crawford, A. M.: Ovine microsatellites at the OarCP34, OarCP38, OarCP43, OarCP49, OarCP73, OarCP79 and OarCP99 loci, Anim. Genet., 26, 130–131, https://doi.org/10.1111/j.1365-2052.1995.tb02656.x, 1995.
Evanno, G., Regnaut, S., and Goudet, J.: Detecting the number of clusters of individuals using the software structure: A simulation study, Mol. Ecol., 14, 2611–2620, https://doi.org/10.1111/j.1365-294X.2005.02553.x, 2005.
Goudet, J.: FSTAT (Version1.2): A Computer Program to Calculate F-Statistics, J. Hered., 86, 485–486, https://doi.org/10.1093/oxfordjournals.jhered.a111627, 1995.
Hulme, D. J., Silk, J. P., Redwin, J., Barendse, W., and Beh, K. J.: Ten polymorphic ovine microsatellites, Anim. Genet., 25, 434–435, https://doi.org/10.1111/j.1365-2052.1994.tb00543.x, 1994.
Ilişiu, E., Dărăban, S., Radu, R., Pădeanu, I., Ilişiu, V. C., Pascal, C., and Rahmann, G.: The Romanian Tsigai sheep breed, their potential and the challenges for research, Landbauforschung Appl. Ag. Forest. Res., 63, 161–170, https://doi.org/10.3220/LBF_2013_161-170, 2013.
Kevorkian, S. E. M., Georgescu, S. E., Manea, M. A., Zăuleţ, M., Hermenean, A. O., and Costache, M.: Genetic diversity using microsatellite markers in four Romanian autochthonous sheep breeds, Rom. Biotech. Lett., 15, 5059–5065, 2010.
Kusza, S., Nagy, I., Sasvari, Z., Stagel, A., Nemeth, T., Molnar, A., Kume, K., Bosze, Z., Javor, A., and Kukovics, S.: Genetic diversity and population structure of Tsigai and Zackel type of sheep breeds in the Central, Eastern and Southern European regions, Small Ruminant Res., 78, 13–23, https://doi.org/10.1016/j.smallrumres.2008.04.002, 2008.
Kusza, S., Dimov, D., Nagy, I., Bosze, Z., Javor, A., and Kukovics, S.: Microsatellite analysis to estimate genetic relationships among five Bulgarian sheep breeds, Genet. Mol. Biol., 33, 51–56, https://doi.org/10.1590/S1415-47572010005000003, 2010.
Kusza, S., Ivankovic, A., Ramjlak, J., Nagy, I., Javor, A., and Kukovics, S.: Genetic structure of Tsigai, Ruda, Pramenka and other local sheep in Southern and Eastern Europe, Small Ruminant Res., 99, 130–134, https://doi.org/10.1016/j.smallrumres.2011.03.059, 2011.
Loukovitis, D., Siasiou, A., Mitsopoulos, I., Lymberopoulos, A. G., Laga, V., and Chatziplis, D.: Genetic diversity of Greek sheep breeds and transhumant populations utilizing microsatellite markers, Small Ruminant Res., 136, 238–242, https://doi.org/10.1016/j.smallrumres.2016.02.008, 2016.
Maddox, J. F., Davies, K. P., Cuthbertson, R., Hulme, D. J., Henry, H., Hawken, R. J., Drinkwater, R. D., Dodds, K. G., and Crawford, A. M.: Updating the sheep linkage map, Anim. Genet., 27, 85–86, https://doi.org/10.1111/j.1365-2052.1996.tb01585.x, 1996.
Mastranestasis, I., Ekateriniadou, L. V., Ligda, C., and Theodorou, K.: Genetic diversity and structure of the Lesvos sheep breed, Small Ruminant Res., 130, 54–59, https://doi.org/10.1016/j.smallrumres.2015.07.015, 2015.
Neubauer, V., Vogl, C., Seregi, J., Sáfár, L., and Brem, G.: Genetic diversity and population structure of Zackel sheep and other Hungarian sheep breeds, Arch. Anim. Breed., 58, 343–350, https://doi.org/10.5194/aab-58-343-2015, 2015.
Peakall, R. and Smouse, P. E.: GenAlEx6.5: genetic analysis in Excel. Population genetic software for teaching and research – an update, Bioinformatics, 28, 2537–2539, https://doi.org/10.1093/bioinformatics/bts460, 2012.
Pelmus, R. S., Pistol, G. C., Lazar, C., Marin, D. E., Gras, M., Radu, M., and Ghita, E.: Preliminary study on milk composition and milk protein polymorphism in the Romanian local sheep breed Teleorman Black Head Tsigai, Rom. Biotech. Lett., 17, 7582–7591, 2012.
Pritchard, J. K., Stephens, M., and Donnelly, P.: Inference of population structure using multilocus genotype data, Genetics, 155, 945–959, 2000.
Savic, M., Trailovic, R., Petrujkic, B., Beckei, Z., Dimitrijevic, B., and Dimitrijevic, V.: Determining the value of Vlashko-Vitoroga Zackel sheep for the conservation process, Acta Vet.-Beograd, 63, 621–629, https://doi.org/10.2298/AVB1306621S, 2013.
Scott, P. C., Maddox, J. F., Gogolin-Ewens, K. J., and Brandon, M. R.: The nucleotide sequence and evolution of ovine MHC class II B genes DQB and DRB, Immunogenetics, 34, 80–87, https://doi.org/10.1007/BF00211420, 1991.
Swarbrick, P. A., Buchanan, F. C., and Crawford, A. M.: Ovine dinucleotide repeat polymorphism at the MAF35 locus, Anim. Genet., 22, 369–370, https://doi.org/10.1111/j.1365-2052.1991.tb00692.x, 1991.
Takezaki, N. and Nei, M.: Genetic distances and reconstruction of phylogenetic trees from microsatellite DNA, Genetics, 144, 389–399, 1996.
Vaiman, D., Mercier, D., Moazami-Goudarzi, K., Eggen, A., Ciampolini, R., Lépingle, A., Velmala, R., Kaukinen, J., Varvio, S. L., Martin, P., Levéziel, H., and Guérin, G.: A set of 99 cattle microsatellite: characterization, synteny mapping and polymorphism, Mamm. Genome, 5, 288–297, https://doi.org/10.1007/BF00389543, 1994.
Van Oosterhout, C., Hutchinson, W. F., Wills, D. P. M., and Shipley, P.: MICRO-CHECKER: software for identifying and correcting genotyping errors in microsatellite data, Mol. Ecol. Notes, 4, 535–538, https://doi.org/10.1111/j.1471-8286.2004.00684.x, 2004.
Yilmaz, O., Cemal, I., and Karaca, O.: Genetic diversity in nine native Turkish sheep breeds based on microsatellite analysis, Anim. Genet., 45, 604–608, https://doi.org/10.1111/age.12173, 2014.
Zahan, M., Miclea, V., Raica, P., Miclea, I., and Ilisiu, E.: Analysis of genetic variation within Tsigai population from Romania using microsatellites markers, Bulletin UASMV Animal Sciences and Biotechnologies, 68, 396–400, 2011.