
the Creative Commons Attribution 4.0 License.
the Creative Commons Attribution 4.0 License.
 | 18 Dec 2020
Genomic analysis of GBS data reveals genes associated with facial pigmentation in Xinyang blue-shelled layers
Haobin Hou
Xiaoliang Wang
Caiyun Zhang
Yingying Tu
Wenwei Lv
Xia Cai
Zhigang Xu
Junfeng Yao
Changsuo Yang
Facial pigmentation is an important economic trait of chickens, especially for laying hens, which will affect the carcass appearance of eliminated layers. Therefore, identifying the genomic regions and exploring the function of this region that contributes to understanding the variation of skin color traits is significant for breeding. In the study, 291 pure-line Xinyang blue-shelled laying hens were selected, of which 75 were dark-faced chickens and 216 were white-faced chickens. The population was sequenced and typed by GBS genotyping technology. The obtained high-quality SNPs and pigmentation phenotypes were analyzed by a genome-wide association study (GWAS) and a FST scan. Based on the two analytical methods, we identified a same genomic region (10.70–11.60 Mb) on chromosome 20 with 68 significant SNPs (−log 10(P)>6), mapped to 10 known genes, including NPEPL1, EDN3, GNAS, C20orf85, VAPB, BMP7, TUBB1, ELMO2, DDX27, and NCOA5, which are associated with dermal hyperpigmentation.
- Article
(917 KB) - Full-text XML
-
Supplement
(318 KB) - BibTeX
- EndNote


Chicken skin color is mainly divided into three types: white, yellow, and black. Commercialized poultry varieties mostly have white or yellow skin traits. Some Chinese indigenous or Silkie chicken breeds have a black skin phenotype. These skin color traits are defined as quality traits and primarily controlled by genetic factors. It is one of the representative phenotypes of hypermelanization, which is caused by the deposition of numerous melanin particles in dermal and visceral tissue and known as fibromelanosis (FM) (Hutt, 1936). Melanocytes are the major cell types produced by birds and mammals to display body color. Melanocyte precursor cells, melanoblasts, are produced by the nerve crest and other progenitor cells in the early stage of embryogenesis (Bennett, 2006). Thought to originate in China and described by Marco Polo in the 13th century during his explorations of Asia, the poultry breeds with FM are believed to have been established well before the 13th century due to references in writings of unusual fowl in ancient Chinese (Haw, 2006). In 1911, researchers reported that the black trait in chicken is autosomal dominant (Bateson and Punnett, 1911). The physical location of FM (10.3–13.1 Mb, chromosome 20) was identified by a genome-wide single-nucleotide polymorphism (SNP)-trait association analysis (Dorshorst et al., 2010). Studies have shown that an inverted replication and junction of two genomic regions which are separated by more than 400 kb in wild-type individuals is the causal FM mutation. The mutation is formed by the inversion and replication of two genomic fragments Dup1 and Dup2 of 129 and 172 kb, respectively. The FM mutation has a dose effect on the regulation of black-skinned traits; the degree of blackness of the skin of homozygous FM mutants is significantly higher than that of heterozygous and wild-type homozygotes (Dorshorst et al., 2011; Shinomiya et al., 2012).
Chinese black-boned chicken breeds include Silkie, Dongxiang, Emei Black, Wumeng blacked-boned chicken, and other indigenous or hybrid breeds. These black-boned chicken breeds are characterized by the intensity of the black pigmentation in the skin, cockscombs, muscles, bones, and visceral organs, and it can be readily seen in the trachea, pericardium, blood vessels, sheaths of muscles and nerves, gonads, mesenteries of the gut, and periosteum of bone (Muroya et al., 2000). In particular, the Silkie is one of the most well-known breeds, and geneticists have researched this breed extensively as a pigmentation model. However, there are relatively few studies on the excavation and identification of pigmentation functional genes in indigenous blue-shelled chicken breeds. Recent advances in next-generation sequencing (Liao et al., 2015) have facilitated genome-wide SNP identification and SNP characterization. The advent of next-generation sequencing (NGS) has reduced the cost of genome sequencing to a level where genotyping by sequencing (GBS) is now considered a powerful tool for inquiring into a large number of genomic variations (SNPs). A large number of candidate genes related to different economic traits of livestock and poultry have been identified by this method, such as the coat color of sheep (Baazaoui et al., 2019), the fatty acid biosynthesis and litter traits of pigs (Kai et al., 2018; Wu et al., 2018), and the body weight of chicken (Fuwei et al., 2018). The combined analysis of genome-wide association study (GWAS) and selection signatures can effectively reveal agronomic traits of crops (You et al., 2018; Lu et al., 2019) and livestock economic traits (Yang et al., 2017). With advances in genomics tools, this study aims to identify SNP loci associated with dermal hyperpigmentation and useful SNP markers to track these loci; it also aims to determine new genetics donors through signatures of selection and associated loci, which will provide a theoretical basis for the selection of blue-shelled hens and the deposition of skin melanin.
2.1 Experimental animals and phenotype
Animals used in this study were approved by the Ethics and Animal Welfare Committee of Shanghai Academy of Agricultural Sciences and performed according to the guidelines established by “the instructive notions with respect to caring for laboratory animals” issued by the Ministry of Science and Technology of the People's Republic of China (no. (2006)398). This study was conducted using 291 pure-line Xinyang blue-shelled layers (75 dark-faced (Fig. 1a) and 216 white-faced (Fig. 1b)) from Shanghai Poultry Breeding Co., Ltd., China. The original group of Xinyang blue-shelled layers comes from the local blue-shelled layers collected in Dongxiang County, Jiangxi Province. It is currently used as the parent line of the three-line matching for commercial egg production. The selected chicken population was from the same batch, with pedigree, single-cage feeding, and consistent management. Pulmonary venous blood collection and extraction of genomic DNA occurred at 36 weeks of age.
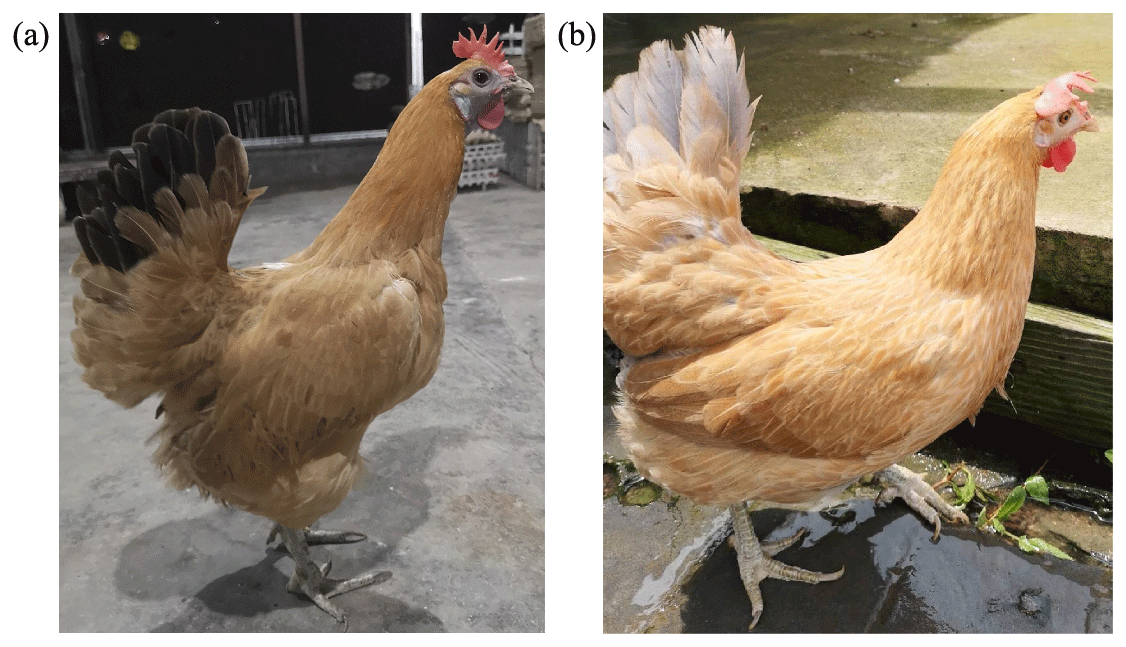
Figure 1Xinyang blue-shelled pure-line layers: (a) dark-faced individuals and (b) white-faced individuals.
2.2 Library construction and sequencing
In the construction of the GBS library, the genome was digested by restriction endonucleases, and each sample was amplified by a bar-code interface. Then the samples were mixed, and the required fragments were selected to construct the library. Paired-end 150 sequencing was performed using an Illumina HiSeq sequencing platform.
2.3 Library inspection
After the construction of the library, the initial quantification was carried out with Qubit 2.0, and the library was diluted to 1 ng/µL. Then the insert size of the library was detected with Agilent 2100. After the insert size met expectations, the effective concentration of the library was quantified accurately by Q-PCR (library effective concentration >2 nM) to ensure the quality of the library.
2.4 Online sequencing
After the qualified library inspection, Illumina HiSeq PE150 was sequenced by pooling different libraries according to the effective concentration and quantity of target data. Efficient high-quality sequencing data were aligned to the reference genome by BWA (Li and Durbin, 2009) software (parameter: mem-t4-k32-M).
2.5 SNP detection and annotation
SNPs mainly refer to DNA sequence polymorphisms caused by variation in a single nucleotide at the genome level and include conversions and transversions of a single base. We used software such as SAMtools (Li et al., 2009) for group SNP detection. Bayesian models were used to detect polymorphic loci in the population. High-quality SNPs were obtained using ANNOVAR (Wang et al., 2010) software for population SNP annotations. ANNOVAR (Wang et al., 2010) is an efficient software tool that uses the latest information to functionally annotate genetic variants detected in multiple genomes.
2.6 Population principal component analysis
PCA only deals with autosomal data with the number of individuals n= XX, ignoring the higher than two allele loci and mismatch data. The analysis method of PCA is shown in the following equation:
In Eq. (1), dik represents the SNP of the individual i and k position. If the individual i is homozygous with the reference allele, then dik=0. If it is heterozygous, then dik=1. If the individual i and the non-reference allele are pure, dik=2. E(dk) is the average value of dk, and the individual sample covariance n×n matrix is calculated by X= MMT ∕S. GCTA (https://cnsgenomics.com/software/gcta/#Download, last access: 13 December 2020) software calculates feature vectors and feature values, and R software draws PCA distribution maps.
2.7 Association and selection signal analysis
In the process of GWAS analysis, the main factors causing false association are individual relationships and population stratification. Therefore, a mixed linear model was used to analyze the correlation of traits. Population genetic structure was used as a fixed effect, and an individual genetic relationship was used as a random effect to correct the effects of population structure and individual genetic relationships:
where y is the phenotypic trait, X is the indicator matrix of the fixed effect, and α is the estimated parameter of the fixed effect; Z is the indicator matrix of the SNP, and β is the effect of the SNP; W is the indicator matrix of the random effect, and μ is the predicted random individual, and e is a random residual that obeys e∼ (0, ).
We considered dark and white face of chicken as case/control groups to obtain Wright's FST estimate for each SNP, using the FST option in PLINK 1.9 (Chang et al., 2015). In order to detect superior signals based on the allele frequency difference, markers were ranked according to raw FST values and plotted according to their genomic position based on the Gallus_gallus-5.0 assembly genome using R software (version 2.13.2). In addition, Haploview v4.2 software was used to analyze linkage disequilibrium and haplotype (Barrett et al., 2005).
2.8 Gene enrichment analysis
The gene contents in the candidate regions were annotated according to the outliers tested by FST from the Gallus_gallus-5.0 assembly genome. The Gene Ontology and Kyoto Encyclopedia of Genes and Genomes (KEGG) pathway analyses were performed with Metascape (http://metascape.org/gp/index.html#/main/step1, last access: 13 December 2020).
3.1 Sequencing results
The total raw base sequence obtained after sequencing was 267.433 Gb, and the amount of individual sequencing was from 542.663 to 2079.192 Mb, with an average of 919.014 Mb per sample. The data obtained at this stage contained a certain amount of interference information, which will cause interference to subsequent analysis and need to be removed. According to the filtration conditions, strict quality control was obtained, and 267.402 Gb high-quality clean bases were obtained, with an average of 918.910 Mb per individual. The minimum sequencing of the individual was 542.510 Mb, and the maximum sequencing was 20795.560 Mb. The minimum value of Q20 was 93.29 %, indicating that the mass score of 93.29 % is greater than or equal to Q20 (error rate is less than 1 %), and the minimum value of Q30 is 85 %, indicating that the quality score of more than 85 % of bases is greater than Q30 (accurate). The rate was equal to 99.9 %, the sequencing quality was high, the GC distribution was normal, and the average value was 41.75 % (Supplement Table S1). All the samples used in the GBS library in this study were not contaminated, and the database was successfully constructed.
3.2 SNP detection and annotation
On comparing the 458 304 SNPs in this experiment with the chicken dbSNP library, the proportion of known and newly discovered SNPs was 88.9 % and 10.7 %, respectively. Because there is only chromosomal information in the reference dbSNP library, the information on the scaffold is missing. Therefore, a very small fraction (0.4 %) is on the scaffold (Fig. S1). Except for the SNPs distributed in the scaffold, the distribution of the remaining SNPs on each chromosome was analyzed. Most of the SNPs were distributed on chromosomes 1–5, while a small number were distributed on chromosomes 16, 32, W, and MT linkage groups (Fig. S2).
3.3 Population structure analysis
PCA analysis of 458 304 independent SNPs revealed that the genetic distance of pure lines of dark- and white-faced Xinyang blue shell layers was close, and there was no obvious segregation, which was consistent with the breeding situation of the whole population (Fig. 2).
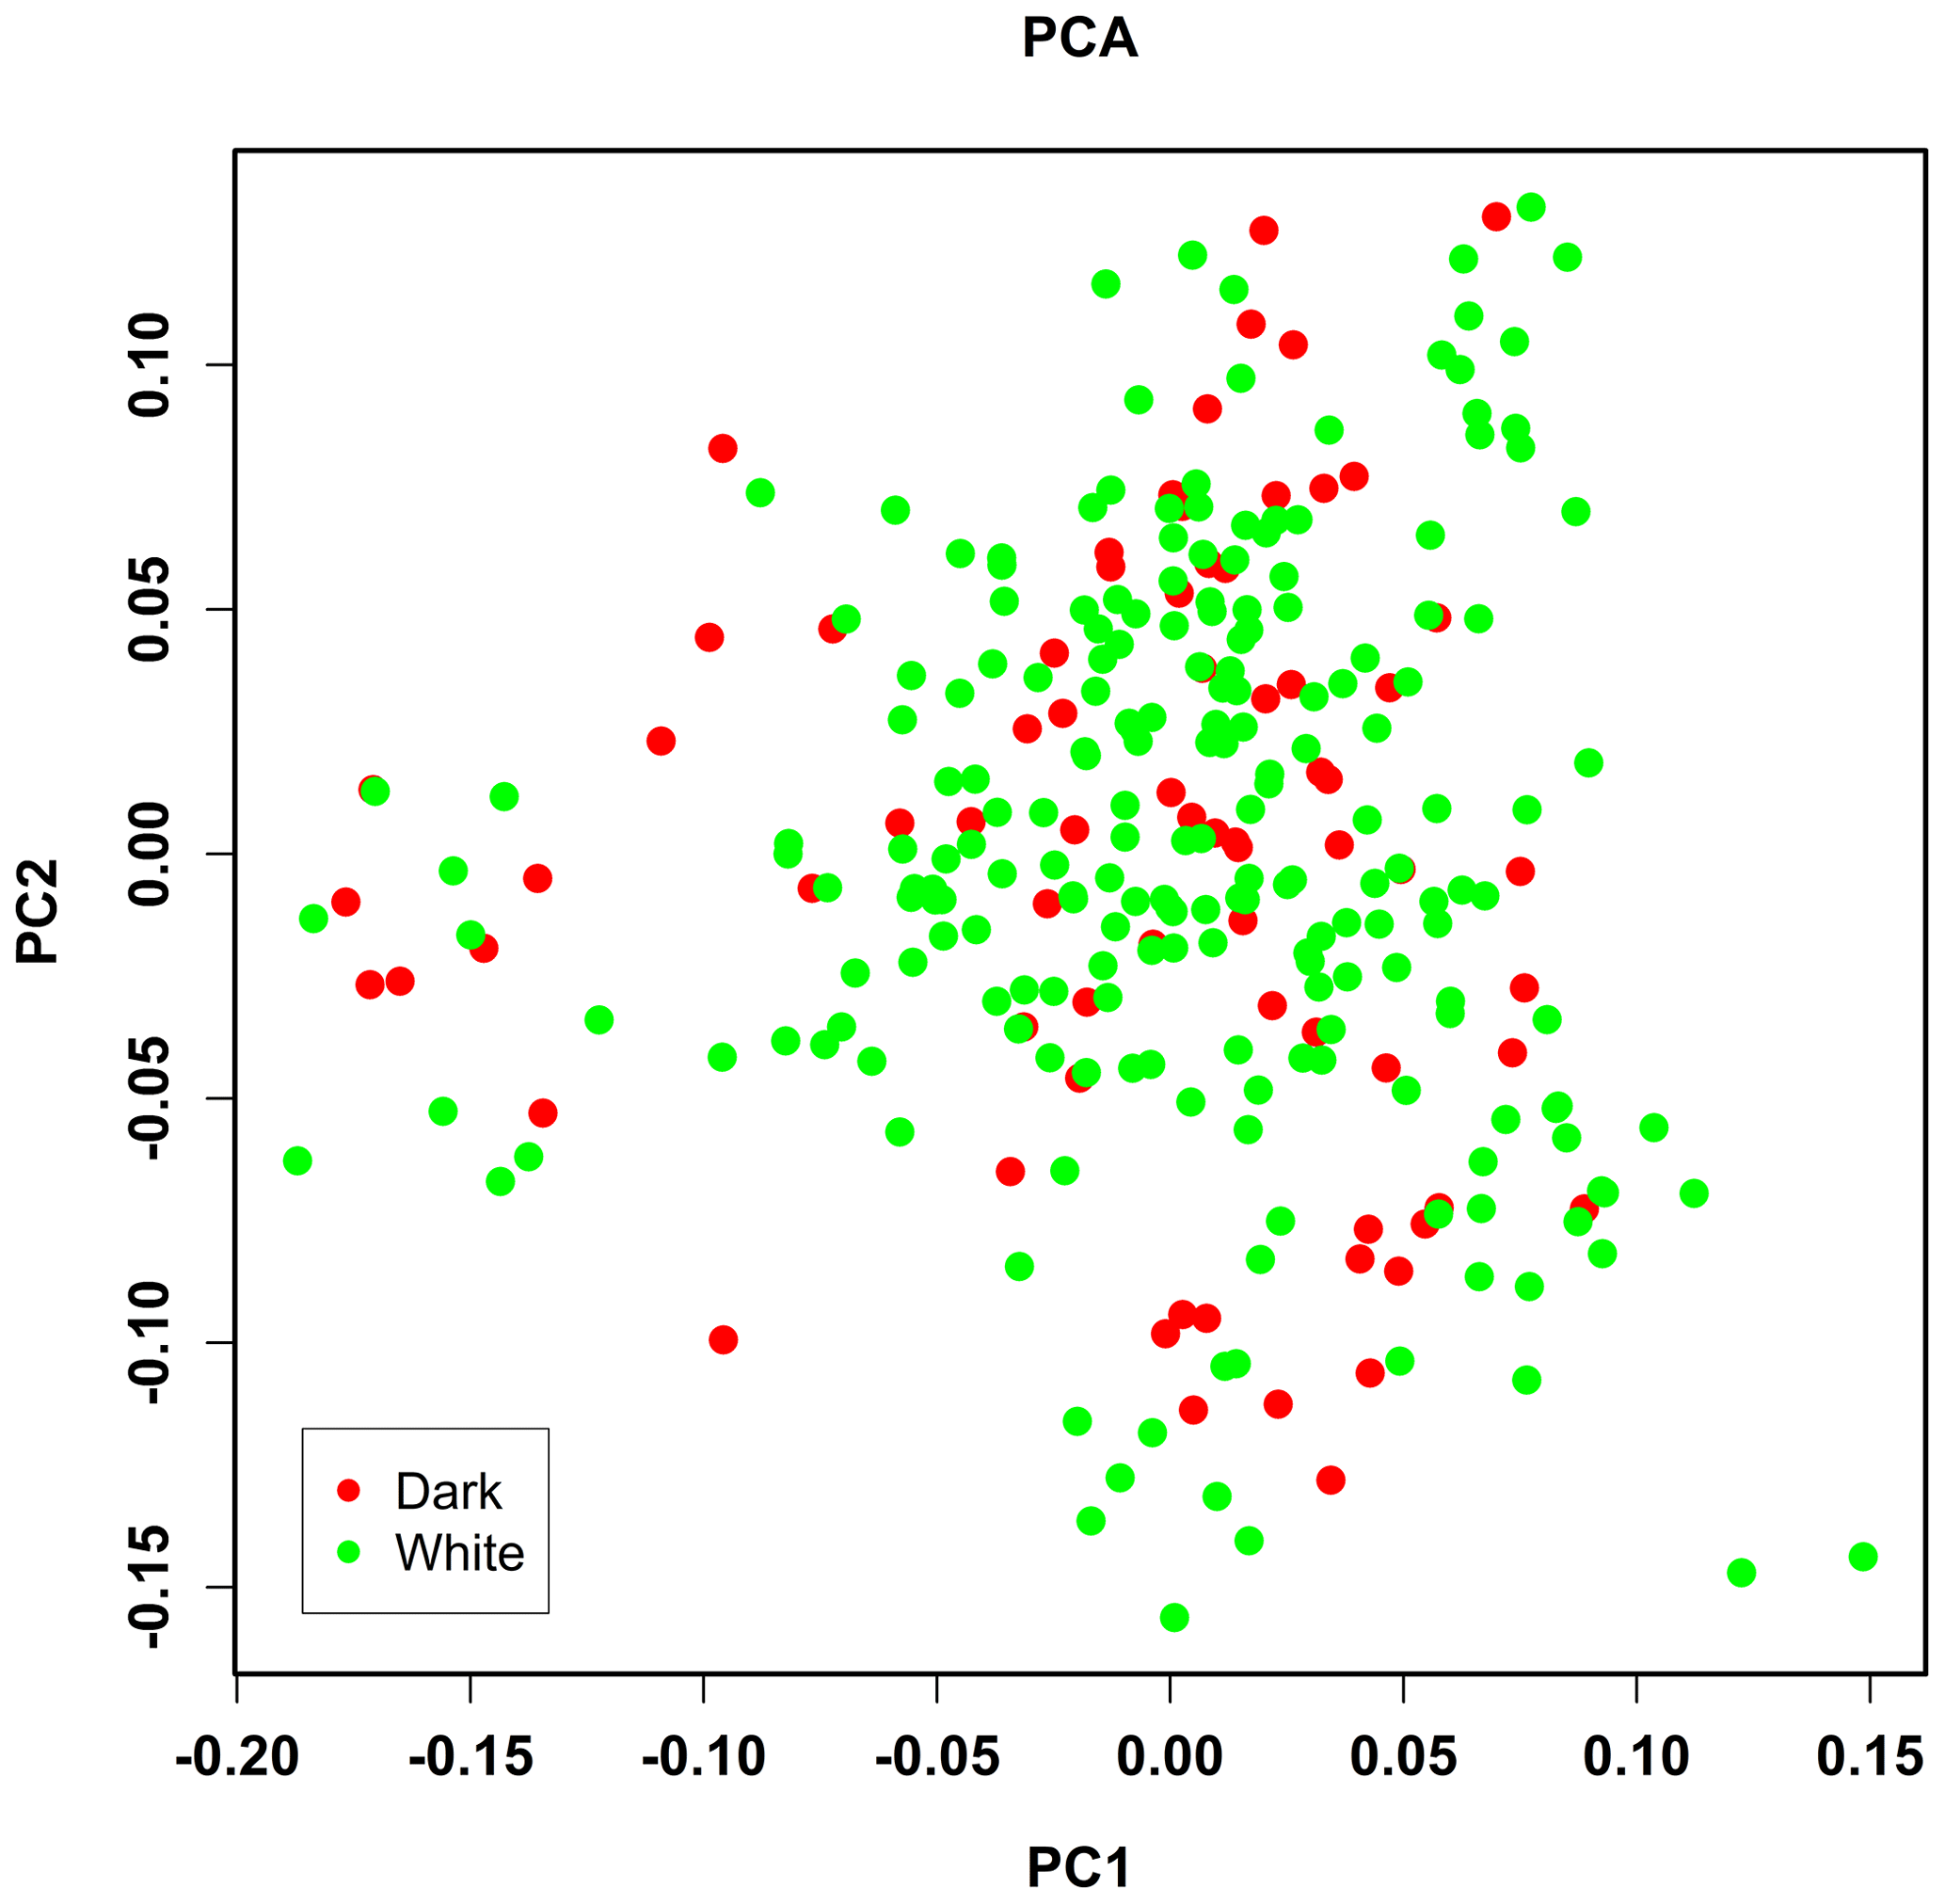
Figure 2Population structure identified by the principal component analysis (PCA). Dark and white represent the face color of chickens.
3.4 Genome-wide association analysis
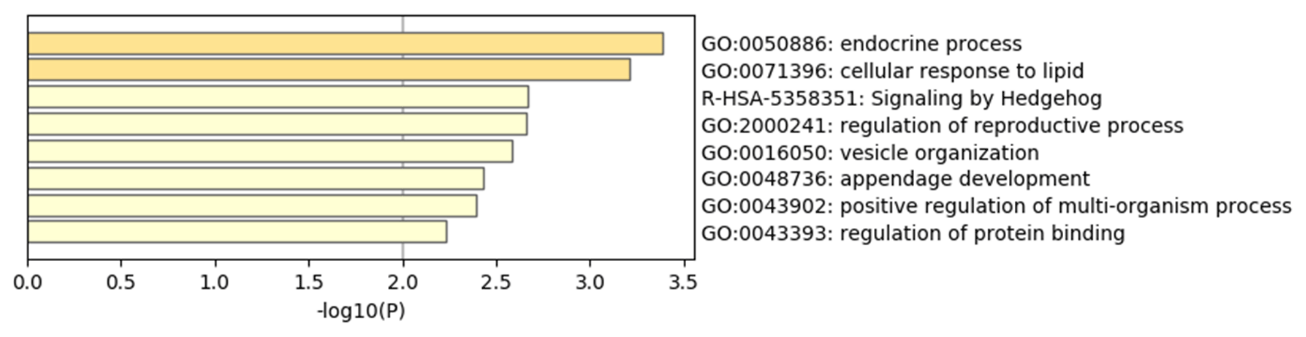
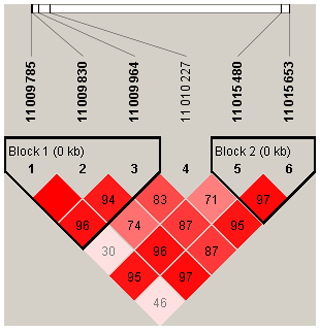
To explore the genetic mechanism of face color in Xinyang blue-shelled chickens, we conducted a GWAS with the univariate method for face color phenotype. A total of 130 genome-wide significant SNPs located on chromosome 20 were successfully identified for the traits (Tables 1, S2, Figs. 3a, 4a). The associated SNPs located between regions 10.7 and 11.6 Mb were entirely attributable to a chromosomal region (∼ 0.9 Mb) harboring 10 genes including EDN3 and BMP7 (Table 1). The most significant SNP is at position 11 205 031 on chromosome 20. The results of detection FST revealed 187 potential SNPs distributed on same genomic regions with FST values ranging from 0.08 to 0.61 (Figs. 3c, 4b; Tables S3, 2). The 42 genes (Table S4) annotated by FST were analyzed for functional enrichment, and 31 significant biological processes were found (Table S5), which contain GO:0050886 (endocrine process) and GO:0071396 (cellular response to lipid) (Fig. 5). In addition, the linkage disequilibrium (LD) plot of six significant SNPs revealed two haplotypes (Block 1 and block 2) (Fig. 6).
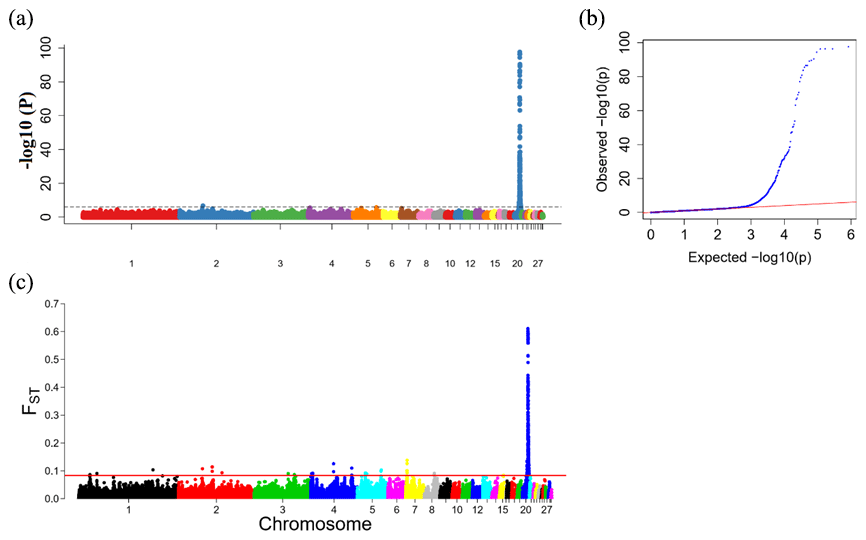
Figure 3Results from the genome-wide association study (GWAS) of face color phenotype. (a) Manhattan plot of the GWAS for the face color phenotype; the y axis shows −log 10(P) values adjusted by a Bonferroni approach for the association tests, and the dashed horizontal line indicates the genome-wide significant threshold value (−log 10(P)>6). (b) The quantile–quantile plot of the P values; the x axis shows the expected −log 10(P) values, and the y axis shows the observed −log 10(P) values. (c) Genome-wide distribution of FST values for pairwise comparison of dark-faced vs. white-faced layers. The solid red line represents the threshold of significance (top 0.1 % SNPs).
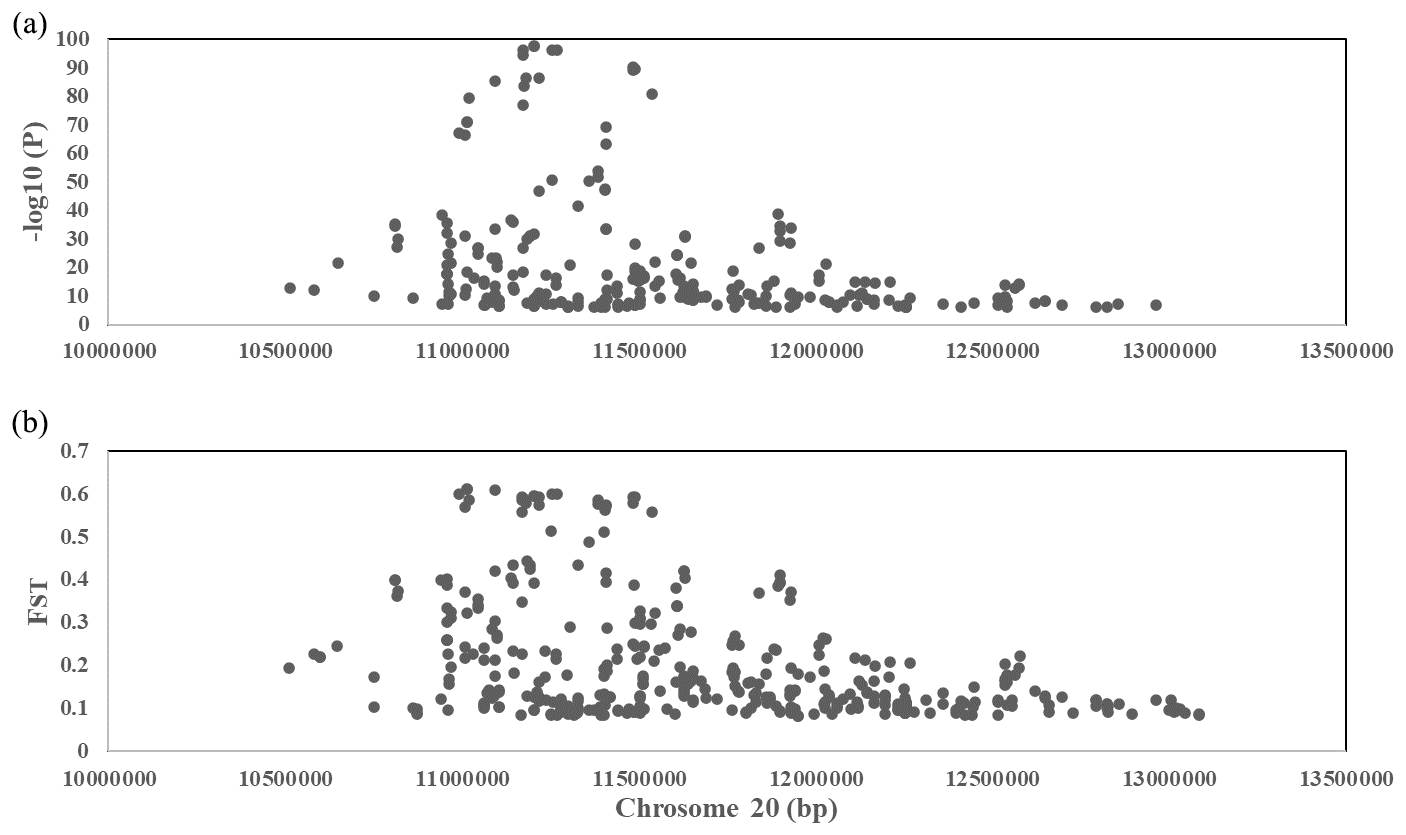
Figure 4(a) A scatterplot presenting all the significant (−log 10(P)>6) single-nucleotide polymorphisms (SNPs) GWAS tested on chromosome 20 for the comb color phenotype. (b) A scatterplot presenting all the significant (top 0.1 %) single-nucleotide polymorphisms (SNPs) FST tested on chromosome 20 for the comb color phenotype.
4.1 GBS assay for genome-wide SNP discovery
It was found that high-density SNPs are important for studying the genetic mechanism of complex traits or the mechanism of population genetics. After quality control, a total of 458 304 high-quality SNPs were identified in this study, more than in previous studies using this method in chickens (Liao et al., 2015; Pértille et al., 2016; Wang et al., 2017). If SNPs located on the linkage group are not considered, the high-quality SNPs identified in this study are mainly located on chromosomes 1 to 5, and the number of SNPs on chromosomes 6 to 10 is average, whereas a minimum number were found on chromosomes 16, 32, and W. This is the same as in a previous study, because chromosomes 1–5 are larger than the other chromosomes (Liao et al., 2015). After annotation, most of the SNPs are located in the intergenic and intron regions, and a very small number of SNPs are located in the exon functional region, indicating that only a few variant sites have an effect on protein translation. This result is the same as that reported in previous studies (Wang et al., 2017). In addition, 10.7 % of high-quality SNPs were found to be different from those in the dbSNP library, which cannot be achieved by SNP chips.
Table 1Significant SNPs with extremely high P values revealed by a GWAS of face color phenotype on chromosome.
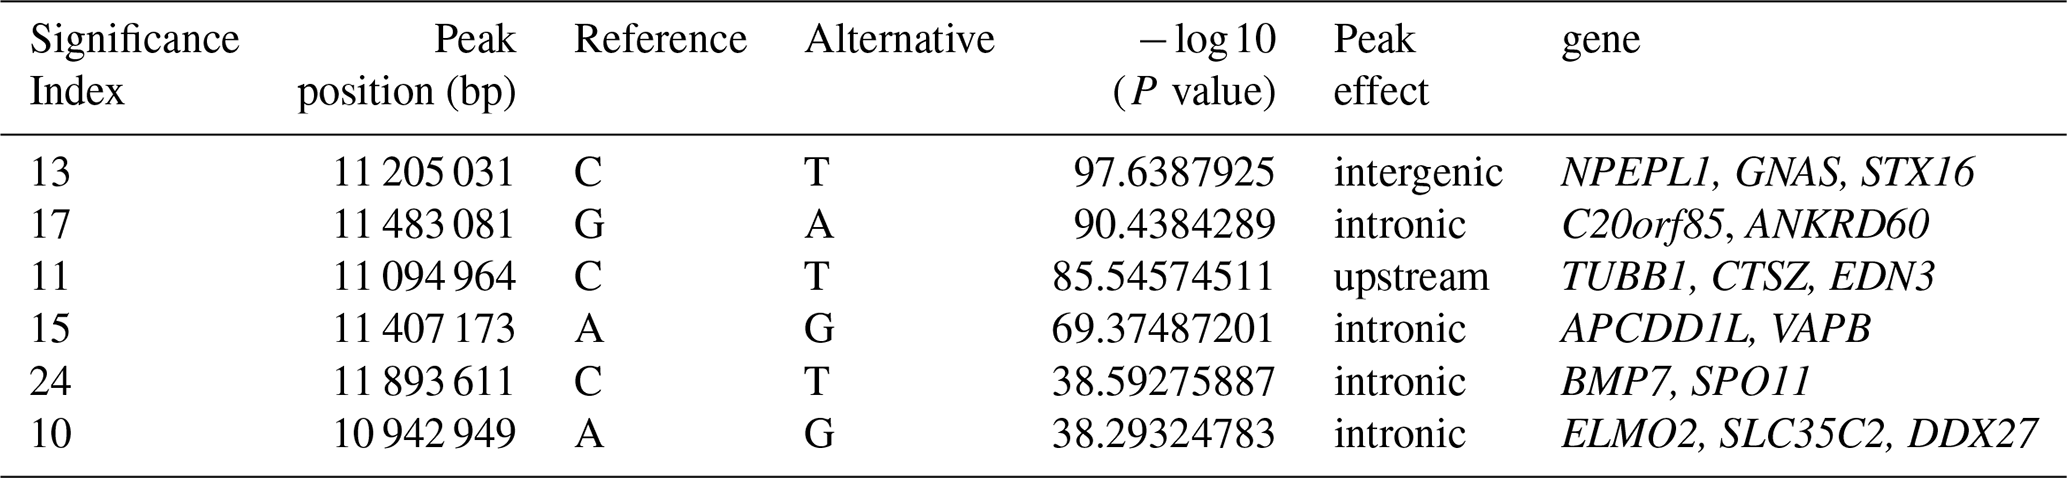
Table 2Summary of the most interesting candidate genes within extreme signatures on chromosome 20.

4.2 Genome-wide association analysis
The most significant genomic regions were identified, including NPEPL1, EDN3, GNAS, and STX16 genes. Previous GWAS studies revealed that GNAS, BMP7, and STX16 genes may be associated with hyperpigmentation of the visceral peritoneum (HVP) (Luo et al., 2013). The molecular function of NPEPL1 is enriched to GO:0030145 (manganese ion binding), and the protein function is metallopeptidases. Endocrine process (GO:0050886) involves the secretion of or response to endocrine hormones. An endocrine hormone is a hormone released into the circulatory system. CTSZ, EDN3, and GNAS are involved this process. In poultry, hyperpigmentation is determined by a dominant autosomal gene conditionally termed Fm/EDN3 (fibromelanosis) interacting with the sex-linked recessive wild type id+ gene and, possibly, the W+ gene that determines the white color of the face. The phenotype is inherited in a Mendelian fashion with incomplete dominance (Shinomiya et al., 2012). Previous research and new gene terminology indicate that the Fm locus is on chromosome 20, with the EDN3 gene as the main factor provoking fibromelanosis in Silkie chickens (Dorshorst et al., 2010, 2011).
The chickens used in the present study have been selected for over 19 generations and subjected to unified selection for egg quality and yield, and black face accounts for about a quarter of the population. In the present study, we also found some extremely significant SNP loci in the Fm locus region on chromosome 20. These SNPs were annotated, and regions related to dermal hyperpigmentation phenotypes were located, including the EDN3 gene. EDN3 is a gene with an acknowledged role in enhancing the proliferation of melanoblasts and melanocytic regulation (Baynash et al., 1994; Lahav et al., 1996; Dupin et al., 2000; Garcia et al., 2008; Chang et al., 2015). Endothelins are endothelium-derived vasoactive peptides involved in a variety of biological functions, and the active form of this protein is a 21 amino acid peptide processed from the precursor protein (Yanagisawa et al., 1988). The active peptide is a ligand for endothelin receptor type B (EDNRB) (Kurihara et al., 1999). The interaction this endothelin with EDNRB is essential for development of neural crest-derived cell lineages, such as melanocytes and enteric neurons (Baynash et al., 1994). Mutations in this gene and EDNRB have been associated with Hirschsprung disease (HSCR) (Gabriel et al., 2002) and Waardenburg syndrome (WS) (Amiel et al., 2008). The gene may also be related to pigmentation of sheep skin (Fariello et al., 2014; Baazaoui et al., 2019). Recently, a combined analysis of genomic and transcriptomic data suggests that the candidate gene related to the black-bone trait, EDN3, might interact with the upstream ncRNA LOC101747896 to generate black skin color during melanogenesis (Li et al., 2020). The extremely significant SNP in this region can explain more than 90 % of whether the face of the Xinyang blue-shelled layer is dark or white. Research shows Cemani and Silkie have 2–4 times larger copy numbers than non-Fm chickens (Budhi et al., 2017). Such results have also been verified in two local chicken breeds in Sweden (Johansson et al., 2015). The size of these areas is over 100 kb and code for EDN3, BMP7, TUBB1, and SLMO2. BMP7 plays a crucial role in regulate embryonic size (Engelman et al., 2006), renal function, and development (Gould et al., 2002; Zeisberg et al., 2003).
Recent studies have shown that a genomic region on chromosome 20 involving EDN3 and BMP7 is associated with hyperpigmentation in Dongxiang chicken comb (Dong et al., 2019). The results also showed that there was a significant correlation between melanin deposition and egg production, which suggests that the laying number of black comb layers is significantly higher than that of red comb chicken. Our research is also enriched in the GO:2000241 (regulation of reproductive process), involving BMP7, AURKA, RTF2, EDN3, and SPO11 genes. However, we counted the number of laying eggs 129 d after 26 weeks of age, which show that there was no statistically significant effect between pigmentation and egg production, although white chickens have three more eggs on average than dark layers (Table S6). The red and dark comb of Dongxiang layers were two distinct lines, obviously different from our research population. However, the gene regions mapped are consistent with our results, from which it can be further inferred that dermal hyperpigmentation as a quality trait is determined by a few major genes. It has been established that the Fm mutation is positively correlated with the duplication of a segment that contains the EDN3 gene (Dorshorst et al., 2011). The located gene regions of this study are consistent with the research, but the specific SNP sites are different. This suggests that the genetic mechanisms involved in different varieties or parts of chicken carcass (such as organs, comb, skin, and face) are also different and may be related to the adopted research methods. In the future, we need to further verify the gene expression in different tissues of chicken.
In this study, two analysis methods (GWAS and FST) were used to reveal the major candidate region affecting chicken dermal hyperpigmentation, which was consistent with previous research results in other black-boned chicken breeds. This region contains EDN3 gene, which is essential for development of melanocytes. It is also verified that a large number of effective molecular markers can be obtained by GBS technology in chicken, which can be used to correlate important economic traits of chicken and thus lay the foundation for maker-assisted selection or genome selection.
The data generated by this project are included as supplementary information. Requests for the raw data should be made to the corresponding authors.
Table S1 contains sequencing reads, alignment statistics, and mean genome-wide coverage of each sample. Table S2 contains GWAS results of dermal hyperpigmentation in Xinyang blue-shelled pure-line layers. Table S3 contains the detection FST result of dermal hyperpigmentation in Xinyang blue-shelled pure-line layers. Table S4 contains the genes of enrichment analysis. Table S5 contains the results of GO analysis in Metascape. Table S6 contains the number of eggs laid in 129 d of Xinyang green-shell layer at 26 weeks of age. The supplement related to this article is available online at: https://doi.org/10.5194/aab-63-483-2020-supplement.
The research was designed by JY, including the design of the experimental plan and analyses. HH, XW and CZ performed genotype data analysis. HH, XW and YT collected the skin color phenotype data of Xinyang green shell laying hens. ZX and XC provide chicken research population of different skin colors. HH drafted the full text. JY and CY are responsible for the project management. All authors read and approved the final manuscript for publication.
The authors declare that they have no conflict of interest.
The authors are grateful to Shanghai Poultry Breeding Co., Ltd. for providing us with research materials and related photos. At the same time, authors would like to thank Jiaxin Liu for providing technical support in bioinformatics analysis.
This research has been supported by Agricultural Breeder-Industry Technology (grant no. 2014-5), the China Agriculture Research System (grant no. CARS-40-K03), and the Shanghai Grants from the SAAS Program for Excellent Research Team (SPERT).
This paper was edited by Steffen Maak and reviewed by two anonymous referees.
Amiel, J., Sproat-Emison, E., Garcia-Barcelo, M., Lantieri, F., Burzynski, G., Borrego, S., Pelet, A., Arnold, S., Miao, X., Griseri, P., Brooks, A. S., Antinolo, G., de Pontual, L., Clement-Ziza, M., Munnich, A., Kashuk, C., West, K., Wong, K. K., Lyonnet, S., Chakravarti, A., Tam, P. K., Ceccherini, I., Hofstra, R. M., and Fernandez, R.: Hirschsprung disease, associated syndromes and genetics: a review, J. Med. Genet., 45, 1–14, https://doi.org/10.1136/jmg.2007.053959, 2001.
Johansson, A. M. and Nelson, R. M.: Characterization of genetic diversity and gene mapping in two Swedish local chicken breeds, Front. Genet., 6, 1–8, https://doi.org/10.3389/fgene.2015.00044, 2015.
Baazaoui, I., Mcewan, J., Anderson, R., Brauning, R., and Bedhiaf-Romdhani, S.: GBS Data Identify Pigmentation-Specific Genes of Potential Role in Skin-Photosensitization in Two Tunisian Sheep Breeds, Animals, 10, 1–10, https://doi.org/10.3390/ani10010005, 2019.
Barrett, J. C., Fry, B., Maller, J., and Daly, M. J.: Haploview: analysis and visualization of LD and haplotype maps, Bioinformatics, 21, 263–265, https://doi.org/10.1093/bioinformatics/bth457, 2005.
Bateson, W. and Punnett, R. C.: On gametic series involving reduplication of certain terms, J. Genet., 1, 293–302, https://doi.org/10.1007/BF02981554, 1911.
Baynash, A. G., Hosoda, K., Giaid, A., Richardson, J. A., Emoto, N., Hammer, R. E., and Yanagisawa, M.: Interaction of endothelin-3 with endothelin-B receptor is essential for development of epidermal melanocytes and enteric neurons, Cell, 79, 1277–1285, https://doi.org/10.1016/0092-8674(94)90018-3, 1994.
Bennett, D.: The Pigmentary System, Pigment Cell Res., 19, 469, https://doi.org/10.1111/j.1600-0749.2006.00341.x, 2006.
Budhi, D. A., Yohei, T., Sri, S., Arifin, Z. M. S., Toyoko, A., Yoko, S., and Petr, H.: The origin and evolution of fibromelanosis in domesticated chickens: Genomic comparison of Indonesian Cemani and Chinese Silkie breeds, Plos One, 12, e0173147, https://doi.org/10.1371/journal.pone.0173147, 2017.
Chang, C. C., Chow, C. C., Tellier, L. C., Vattikuti, S., Purcell, S. M., and Lee J. J.: Second-generation PLINK: rising to the challenge of larger and richer datasets, Gigascience, 4, 1–16, https://doi.org/10.1186/s13742-015-0047-8, 2015.
Dong, X., Li, J. Y., Zhang, Y., Han, D., Hua, G., Wang, J., Deng, X., and Wu, C.: Genomic Analysis Reveals Pleiotropic Alleles at EDN3 and BMP7 Involved in Chicken Comb Color and Egg Production, Front. Genet., 10, 1–12, https://doi.org/10.3389/fgene.2019.00612, 2019.
Dorshorst, B., Okimoto, R., and Ashwell, C.: Genomic Regions Associated with Dermal Hyperpigmentation, Polydactyly and Other Morphological Traits in the Silkie Chicken, J. Hered., 101, 339–350, https://doi.org/10.1093/jhered/esp120, 2010.
Dorshorst, B., Molin, A. M., Rubin, C.-J., Johansson, A. M., Strömstedt, L., Pham, M.-H., Chen, C.-F., Hallböök, F., Ashwell, C., and Andersson, L.: A complex genomic rearrangement involving the endothelin 3 locus causes dermal hyperpigmentation in the chicken, PLoS Genet, 7, e1002412, https://doi.org/10.1371/journal.pgen.1002412, 2011.
Dupin, E., Glavieux, C., Vaigot, P., and Douarin, N. M. L.: Endothelin 3 induces the reversion of melanocytes to glia through a neural crest-derived glial-melanocytic progenitor, P. Natl. Acad. Sci. USA, 97, 7882–7887, https://doi.org/10.1073/pnas.97.14.7882, 2000.
Engelman, J. A., Luo, J., and Cantley, L. C.: The evolution of phosphatidylinositol 3-kinases as regulators of growth and metabolism, Nat. Rev. Genet., 7, 606–619, https://doi.org/10.1038/nrg1879, 2006.
Fariello, M. I., Servin, B., Tosserklopp, G., Rupp, R., Moreno, C., Cristobal, M. S., and Boitard, S.: Selection Signatures in Worldwide Sheep Populations, Plos One, 9, e103813, https://doi.org/10.1371/journal.pone.0103813, 2014.
Fuwei, L., Haixia, H., Qiuxia, L., Jinbo, G., Jie, L., and Wei, L.: Genome-wide association study of body weight in Wenshang Barred chicken based on the SLAF-seq technology, J. Appl. Genet., 59, 305–312, https://doi.org/10.1007/s13353-018-0452-7, 2018.
Gabriel, S., Salomon, R., Pelet, A., Angrist, M., Amiel, J., Fornage, M., Attiebitach, T., Olson, J. M., Hofstra, R. M. W., and Buys, C. H. C. M.: Segregation at three loci explains familial and population risk in Hirschsprung disease, Nat. Genet., 31, 89–93, https://doi.org/10.1038/ng868, 2002.
Garcia, R. J., Ittah, A., Mirabal, S., Figueroa, J., Lopez, L., Glick, A. B., and Kos, L.: Endothelin 3 induces skin pigmentation in a keratin-driven inducible mouse model, J. Invest. Dermatol., 128, 131–142, https://doi.org/10.1038/sj.jid.5700948, 2008.
Gould, S. E., Day, M., Jones, S. S., and Dorai, H.: BMP-7 regulates chemokine, cytokine, and hemodynamic gene expression in proximal tubule cells, Kidney Int., 61, 51–60, https://doi.org/10.1046/j.1523-1755.2002.00103.x , 2002.
Haw, S. G.: Marco Polo's China: a Venetian in the realm of Khubilai Khan, Routledge, London, 1–214, 2006.
Hutt, F. B.: Genetics of the fowl, J. Genet., 32, 277, https://doi.org/10.1007/BF02982682, 1936.
Kai, W., Pingxian, W., Qiang, Y., Dejuan, C., Jie, Z., Anan, J., Jideng, M., Qianzi, T., Weihang, X., and Yanzhi, J.: Detection of Selection Signatures in Chinese Landrace and Yorkshire Pigs Based on Genotyping-by-Sequencing Data, Front. Genet., 9, 119, https://doi.org/10.3389/fgene.2018.00119, 2018.
Kurihara, H., Kurihara, Y., Nagai, R., and Yazaki, Y.: Endothelin and neural crest development, Cell. Mol. Biol., 45, 639–651, 1999.
Lahav, R., Ziller, C., Dupin, E., and Douarin, N. M. L.: Endothelin 3 promotes neural crest cell proliferation and mediates a vast increase in melanocyte number in culture, P. Natl. Acad. Sci. USA, 93, 3892–3897, https://doi.org/10.1073/pnas.93.9.3892, 1996.
Li, D., Sun, G., Zhang, M., Cao, Y., and Kang, X.: Breeding history and candidate genes responsible for black skin of Xichuan black-bone chicken, BMC Genomics, 21, 511, https://doi.org/10.1186/s12864-020-06900-8, 2020.
Li, H. and Durbin, R.: Fast and accurate short read alignment with Burrows-Wheeler transform, Bioinformatics, 25, 1754–1760, https://doi.org/10.1093/bioinformatics/btp324, 2009.
Li, H., Handsaker, B., Wysoker, A., Fennell, T., Ruan, J., Homer, N., Marth, G., Abecasis, G., Durbin, R., and 1000 Genome Project Data Processing Subgroup: The Sequence Alignment/Map format and SAMtools, Bioinformatics, 25, 2078–2079, https://doi.org/10.1093/bioinformatics/btp352, 2009.
Liao, R., Wang, Z., Chen, Q., Tu, Y., Chen, Z., Wang, Q., Yang, C., Zhang, X., and Pan, Y.: An Efficient Genotyping Method in Chicken Based on Genome Reducing and Sequencing, Plos One, 10, e0137010, https://doi.org/10.1371/journal.pone.0137010, 2015.
Lu, K., Wei, L., Li, X., Wang, Y., Wu, J., Liu, M., Zhang, C., Chen, Z., Xiao, Z., and Jian, H.: Whole-genome resequencing reveals Brassica napus origin and genetic loci involved in its improvement, Nat. Commun., 10, 1–12, https://doi.org/10.1038/s41467-019-09134-9, 2019.
Luo, C., Qu, H., Wang, J., Wang, Y., Ma, J., Li, C., Yang, C., Hu, X., Li, N., and Shu, D.: Genetic parameters and genome-wide association study of hyperpigmentation of the visceral peritoneum in chickens, BMC Genomics, 14, 334, https://doi.org/10.1186/1471-2164-14-334, 2013.
Muroya, S., Tanabe, R. I., Nakajima, I., and Chikuni, K.: Molecular characteristics and site specific distribution of the pigment of the silky fowl, J. Vet. Med. Sci., 62, 391–395, https://doi.org/10.1292/jvms.62.391, 2000.
Pértille, F., Guerrero-Bosagna, C., Silva, V. H. D., Boschiero, C., Nunes, J. d. R. d. S., Ledur, M. n. C., Jensen, P., and Coutinho, L. L.: High-throughput and Cost-effective Chicken Genotyping Using Next-Generation Sequencing, Sci. Rep., 6, 26929, https://doi.org/10.1038/srep26929, 2016.
Shinomiya, A., Kayashima, Y., Kinoshita, K., Mizutani, M., Namikawa, T., Matsuda, Y., and Akiyama, T.: Gene duplication of endothelin 3 is closely correlated with the hyperpigmentation of the internal organs (Fibromelanosis) in silky chickens, Genetics, 190, 627–638, https://doi.org/10.1534/genetics.111.136705, 2012.
Wang, K., Li, M., and Hakonarson, H.: ANNOVAR: functional annotation of genetic variants from high-throughput sequencing data, Nucleic. Acids. Res., 38, 1–7, https://doi.org/10.1093/nar/gkq603, 2010.
Wang, Y., Cao, X., Zhao, Y., Fei, J., Hu, X., and Li, N.: Optimized double-digest genotyping by sequencing (ddGBS) method with high-density SNP markers and high genotyping accuracy for chickens, Plos One, 12, e0179073, https://doi.org/10.1371/journal.pone.0179073, 2017.
Wu, P., Yang, Q., Wang, K., Zhou, J., Ma, J., Tang, Q., Jin, L., Xiao, W., Jiang, A., Jiang, Y., Zhu, L., Li, X., and Tang, G.: Single step genome-wide association studies based on genotyping by sequence data reveals novel loci for the litter traits of domestic pigs, Genomics, 110, 171–179, https://doi.org/10.1016/j.ygeno.2017.09.009, 2018.
Yanagisawa, M., Kurihara, H., Kimura, S., Tomobe, Y., Kobayashi, M., Mitsui, Y., and Masaki, T.: A novel potent vasoconstrictor peptide produced by vascular endothelial cells, Nature, 332, 411–415, https://doi.org/10.1038/332411a0, 1988.
Yang, L., Du, X., Wei, S., Gu, L., Li, N., Gong, Y., and Li, S.: Genome-wide association analysis identifies potential regulatory genes for eumelanin pigmentation in chicken plumage, Anim. Genet., 48, 611–614, https://doi.org/10.1111/age.12573, 2017.
You, F. M., Xiao, J., Li, P., Yao, Z., Jia, G., He, L., Kumar, S., Soto-Cerda, B., Duguid, S. D., Booker, H. M., Rashid, K. Y., and Cloutier, S.: Genome-Wide Association Study and Selection Signatures Detect Genomic Regions Associated with Seed Yield and Oil Quality in Flax, Int. J. Mol. Sci., 19, 2303, https://doi.org/10.3390/ijms19082303, 2018.
Zeisberg, M., Bottiglio, C., Kumar, N., Maeshima, Y., Strutz, F., Muller, G. A., and Kalluri, R.: Bone morphogenic protein-7 inhibits progression of chronic renal fibrosis associated with two genetic mouse models, Am. J. Physiol. Renal. Physiol., 285, F1060-7, https://doi.org/10.1152/ajprenal.00191.2002, 2003.