
the Creative Commons Attribution 4.0 License.
the Creative Commons Attribution 4.0 License.
 | 16 Apr 2020
Assessment of methane emission traits in ewes using a laser methane detector: genetic parameters and impact on lamb weaning performance
Jessica Reintke
Kerstin Brügemann
Tong Yin
Petra Engel
Henrik Wagner
Axel Wehrend
Sven König
The aim of the present study was to derive individual methane (CH4) emissions in ewes separated in CH4 respiration and eructation traits. The generated longitudinal CH4 data structure was used to estimate phenotypic and genetic relationships between ewe CH4 records and energy efficiency indicator traits from same ewes as well as from their lambs (intergenerational perspective). In this regard, we recorded CH4 emissions via mobile laser methane detector (LMD) technique, body weight (EBW), backfat thickness (BFT) and body condition score (BCS) from 330 ewes (253 Merinoland (ML), 77 Rhön sheep (RH)) and their 629 lambs (478 ML, 151 RH). The interval between repeated measurements (for ewe traits and lamb body weight (LBW)) was 3 weeks during lactation. For methane concentration (µL L−1) determinations in the exhaled air, we considered short time measurements (3 min). Afterwards, CH4 emissions were portioned into a respiration and eructation fraction, based on a double normal distribution. Data preparation enabled the following CH4 trait definitions: mean CH4 concentration during respiration and eructation (), mean CH4 concentration during respiration (), mean CH4 concentration during eructation (), sum of CH4 concentrations per minute during respiration (), sum of CH4 concentrations per minute during eructation (), maximal CH4 concentration during respiration (), maximal CH4 concentration during eructation (), and eructation events per minute (). Large levels of ewe CH4 emissions representing energy losses were significantly associated with lower LBW (P<0.05), lower EBW (P<0.01) and lower BFT (P<0.05). For genetic parameter estimations, we applied single- and multiple-trait animal models. Heritabilities and additive genetic variances for CH4 traits were small, i.e., heritabilities in the range from <0.01 (, , , ) to 0.03 (). We estimated negative genetic correlations between CH4 traits and EBW in the range from −0.44 () to −0.05 (). Most of the CH4 traits were genetically negatively correlated with BCS (−0.81 for ) and with BFT (−0.72 for ), indicating same genetic mechanisms for CH4 output and energy efficiency indicators. Addressing the intergenerational aspect, genetic correlations between CH4 emissions from ewes and LBW ranged between −0.35 () and 0.01 (, ), indicating that breeding on reduced CH4 emissions (especially eructation traits) contribute to genetic improvements in lamb weaning performance.
- Article
(1386 KB) - Full-text XML
- BibTeX
- EndNote


Methane (CH4) is a by-product of microbial fermentation processes in ruminants (Henderson et al., 2015) and a potential greenhouse gas. Furthermore, CH4 emissions reflect an unused proportion of gross energy intake (Johnson and Ward, 1996; Baker, 1999). Fodder is the major cost factor in sheep production systems (Ellison et al., 2017). Hence, there is an increasing interest to breed animals with improved productivity and feed efficiency (i.e., feed intake in relation to body weight gain), possibly via selection on low individual CH4 emissions (Paganoni et al., 2017). Pickering et al. (2015) and Paganoni et al. (2017) indicated genetic variation and small to moderate heritabilities for CH4 traits in dairy cows and sheep, and Rösler et al. (2018) described an individual variation in enteric CH4 emissions in female goats. Furthermore, the economic benefits from selection scenarios including CH4 traits (Robinson and Oddy, 2016) suggest consideration of CH4 or of CH4 indicator traits into overall sheep breeding goals.
In this regard, respiration chamber calorimetry is the “golden standard” to determine CH4 emissions in sheep. Nevertheless, respiration chamber measurements imply strong efforts regarding logistics, associated with a substantial cost component. In consequence, only a small number of sheep can be phenotyped for CH4 using the respiration chamber technique. In addition, respiration chambers reflect an artificial environment, which is not representative of sheep kept in pasture-based production systems. Animals might show abnormal behavior (e.g., reduced dry matter intake, DMI) in the chamber, possibly influencing a CH4 emission pattern (Kabreab et al., 2006; Bickell et al., 2014). Thus, Knapp et al. (2014) and Huhtanen et al. (2015) requested alternative reliable and cost-efficient methods for CH4 recording, especially under field conditions. In such a context, approaches based on feed supplements were unsuitable under grazing conditions (Baker, 1999). Predictions of CH4 via deterministic modeling usually require a large amount of input data, e.g., DMI, dietary or milk components, which are difficult to record (Kabreab et al., 2006; Yin et al., 2015). Further indirect methods for CH4 emission predictions based on the ruminal microbiome composition but associations between CH4 production and microbiome characteristics were inconsistent (Shi et al., 2014; Ellison et al., 2017). The portable handheld laser methane detector (LMD) was suitable for CH4 recording in dairy cattle under field conditions, with low inter-observer variability (Chagunda et al., 2009b). In validations, correlations between LMD CH4 and CH4 measurements from the respiration calorimetric chamber were large (Chagunda and Yan, 2011).
With regard to associations between CH4 output and other breeding goal traits, Zetouni et al. (2018) estimated negative genetic correlations between CH4 production (g d−1) and body conformation traits in Danish Holstein cows. Nevertheless, there is a gap of knowledge addressing “across generation studies”, i.e., association analyses between indicators for energy balances of ewes (including CH4 emissions) and body weights of their lambs (LBW; also characterizing productivity of the ewe).
The objective of the present study was to focus on such intergenerational aspects, considering CH4 measurements from ewes (recorded via LMD) as energy balance indicators. The CH4 databases were used (i) to define and to evaluate different CH4 measurement characteristics, (ii) to estimate genetic parameters for CH4 measurements, and (iii) to correlate phenotypically and genetically ewe CH4 measurements with other breeding goal traits from a within- and transgenerational perspective.
2.1 Ethics statement
The housing and treatment of the animals were carried out in accordance with national and international laws. The study was restricted to routine on-farm observations. All presented methods were non-invasive. Therefore, they did not cause the included animals pain, suffering or harm, in compliance with the German Animal Welfare Act § 7. Nevertheless, the presented procedures have been approved for a subsample of ewes that were used for additional blood parameter analyses by the regional board of Giessen (V 54-19 c 20 15 h 01 GI 18/14 Nr. G 62/2017).
2.2 Production system
For trait recording, we focused on sheep from the University of Giessen research station “Oberer Hardthof”, reflecting a mixture of grazing (spring to fall) and high-input (fall to spring) sheep production system. The farm is located 200 m above sea level in the federal state Hesse in the middle of Germany. The average annual temperature is 8.8 ∘C, and the average precipitation amount is 695 mm per year. The farm comprises 70 ha for a flock including 630 ewes, 7 rams and 98 hoggets of Merinoland (ML) and Rhön sheep (RH). During the lambing season, the flock was fed hay ad libitum. The hay quality was as follows: 90.3 % dry matter (DM), 40.2 % crude fiber (CF), 6.8 % crude protein (CP), 1.3 % crude lipid (EE) and 7.8 MJ metabolizable energy (ME) per kg in DM. Ewes within the last third of gestation received additional concentrates up to 1 kg d−1. The concentrates were composed of barley, wheat, rapeseed meal extract, wheat bran and triticale (6.8 % CF, 18 % CP, 2.6 % EE, 10.8 ME MJ per kg DM). The calculated daily ration for a twin-suckling ewe with an average body weight of 85 kg contained 1.8 kg hay and 900 g concentrates (21.84 MJ ME per ewe and day). Lambs had ad libitum access to concentrates at an age of 21 to 28 d. They were weaned group-wise at a mean age of 65.35±5.35 d with an average body weight of 26.10±4.91 kg.
2.3 Animals and traits
Data recording spanned a period from 2017 to 2018. The study considered 330 ewes (253 ML, 77 RH) and their purebred 629 lambs (478 ML, 151 RH). The age of ewes ranged from 22.1 to 96.8 months (mean = 51.3±18.2 months). In a subset of 177 ewes (133 ML, 44 RH), the whole pattern of traits was recorded: ewe body weight (EBW) (digital scale: model 703, TRU-TEST Group, Auckland, New Zealand), ewe body condition score (BCS), ewe backfat thickness (BFT) in millimeters (mm), and the individual CH4 concentrations (µL L−1) in the exhaled air. Body condition score was assessed by palpating the transverse and spinous processes of the lumbar region around the backbone. Scores ranged on a scale from 1.0 (emaciated) to 5.0 (obese) with increments of 0.5 (Russel et al., 1969). Backfat thickness was measured on the right side directly behind the 13th rib (Silva et al., 2006; Gernand and Lenz, 2005), using a mobile ultrasound transducer (EasiScan ultrasound scanner, 4.5–8.5 MHz linear, BCF Technology Ltd., Bellshill, Scotland). Individual CH4 concentrations in the exhaled air were measured using an LMD (Crowcon LaserMethane Mini, Tokyo Gas Engineering Co Ltd., Tokyo, Japan). Lamb body weight was recorded from 281 offspring (216 ML, 65 RH). A further subset for genetic analyses considered only EBW and BCS of an additional 153 ewes (120 ML, 33 RH) and LBW of their 348 lambs (262 ML, 86 RH). We generated a longitudinal data structure, implying ewe trait and LBW recording on the same days in intervals of 3 weeks from parturition until weaning.
2.4 Laser methane detector method and CH4 data preparation
According to Ricci et al. (2014), the interval between feeding and LMD CH4 recording comprised 3–5 h. Ricci et al. (2014) identified substantial impact of meteorological data on individual CH4 emissions. Consequently, we selected a wind-still environment, and we accounted for temperature and humidity in genetic-statistical modeling. In order to guarantee standardized trait recording, ewe CH4 measurements were performed after weighing in the weighing facility, and additionally an assistant fixated the ewes during CH4 recording. Hence, we always had a distance of exactly 1 m between the operator (i.e., the LMD) and the sheep's nostrils, and we avoided noisy data because of an uncontrolled movement (Ricci et al., 2014; Huhtanen et al., 2015).
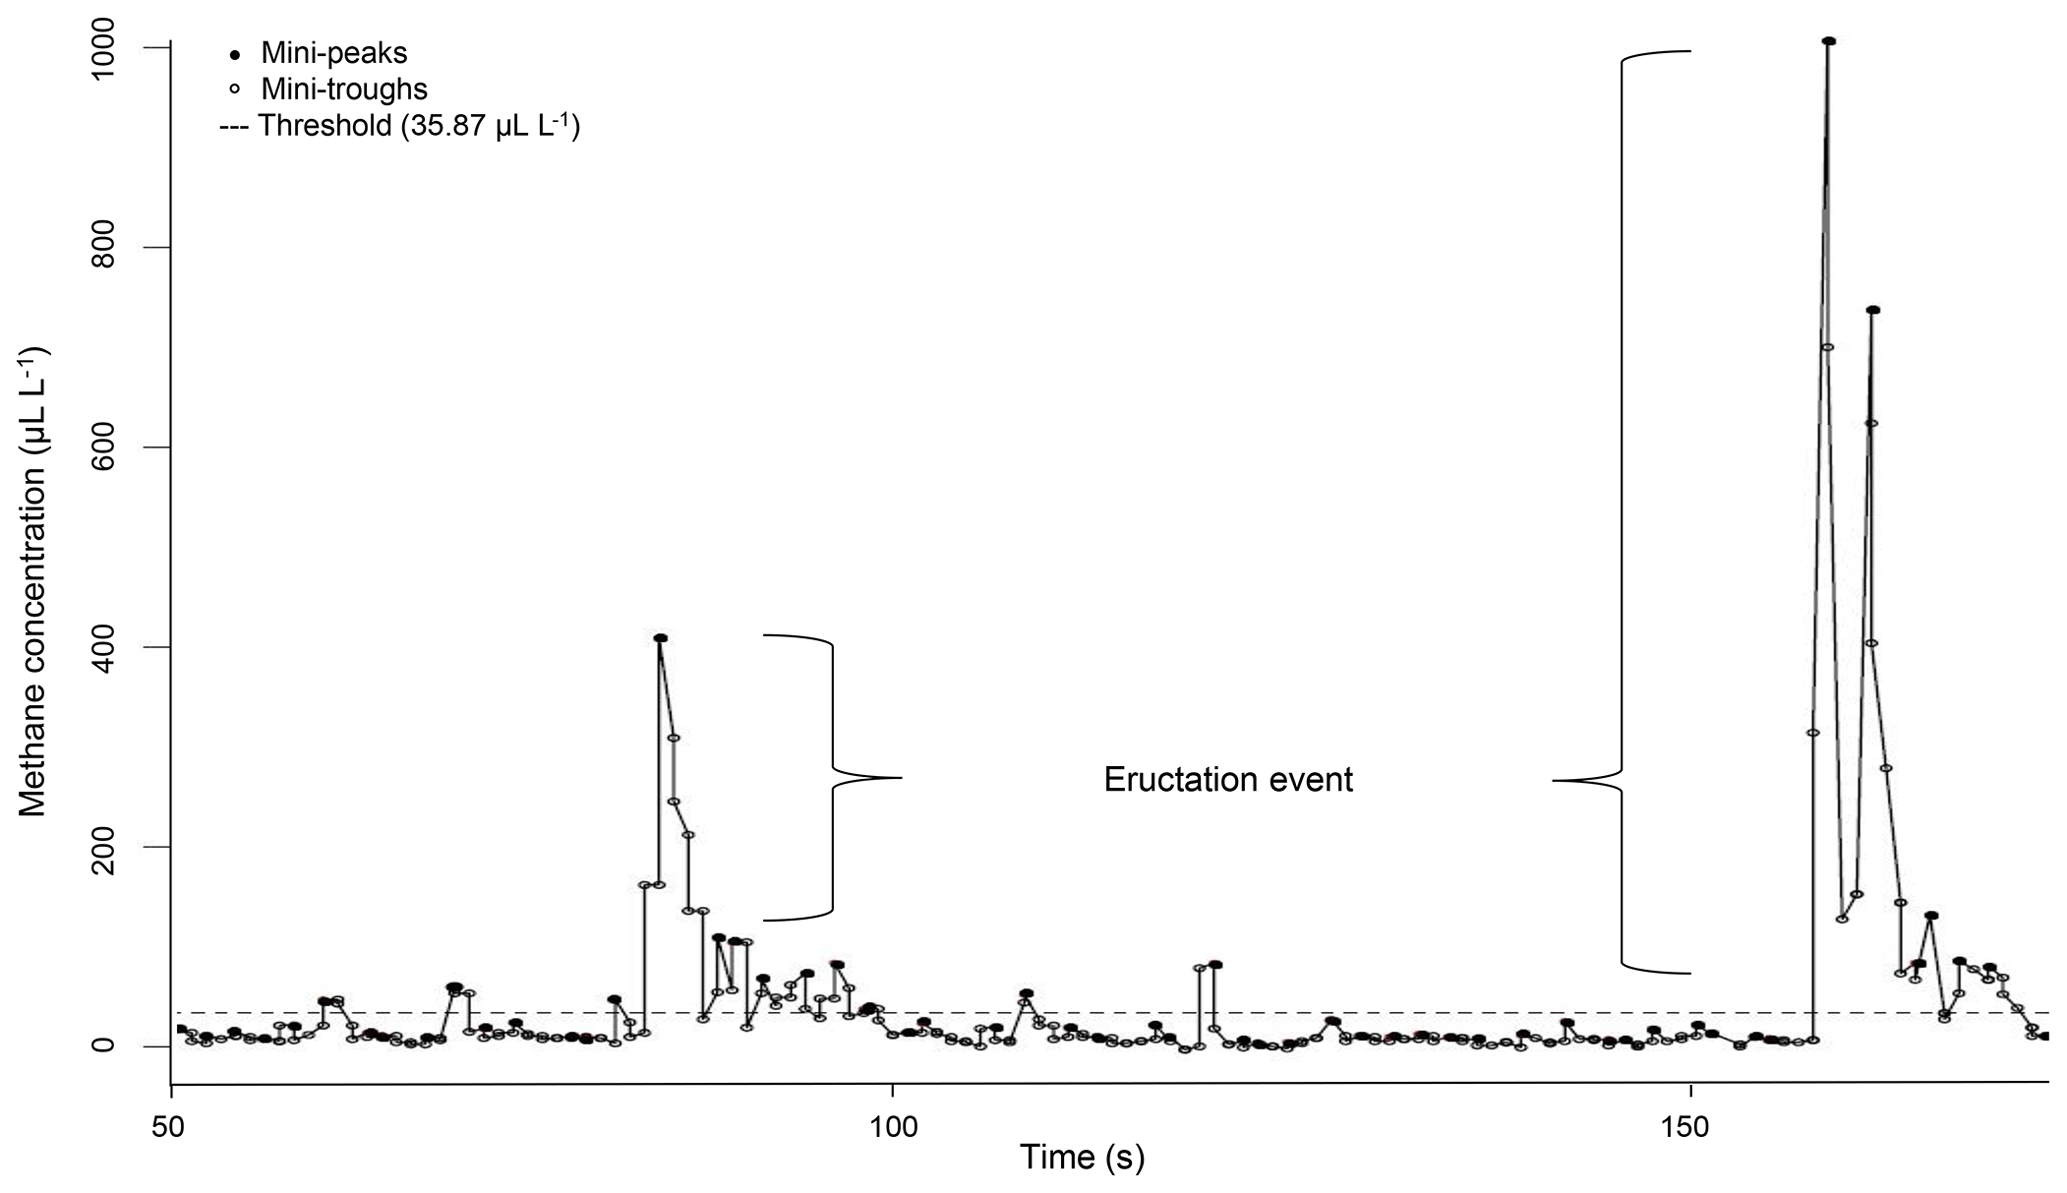
Figure 1Example for a CH4 measurement profile of one ewe recorded via laser methane detector (LMD) and corrected for background CH4. Values under the threshold describe CH4 emissions during respiration and values above the threshold describe CH4 emissions during eructation.
The LMD recorded CH4 concentrations in intervals of 0.5 s in the exhaled air. Methane concentrations were directly displayed in parts per million-meter (ppm-m) (Tokyo Gas Engineering Co. Ltd., 2013). Because the distance between the LMD and the ewe's nostrils was exactly 1 m in the present study, the CH4 concentration was expressed in microliters per liter (Ricci et al., 2014). Ongoing CH4 data preparation in R 3.3.2 (R Development Core Team, 2016) is based on the protocol as suggested by Ricci et al. (2014): the minimum CH4 concentration of each measurement was set as a background CH4 concentration, i.e., to reflect environmental CH4 influence (overall mean background CH4 = 6.82 µL L−1). Afterwards, background CH4 was subtracted from the remaining CH4 records. Because the LMD detection is based on CH4 in the exhaled air, we considered the dynamics of the respiratory cycle (Chagunda, 2013). In this regard, Fig. 1 illustrates the CH4 measurement profile for one ewe. Every dot represents a detected CH4 concentration in microliters per liter. The CH4 emission profile represents small increases in CH4 concentration (mini-peaks; solid dots) due to exhalation or eructation. Before and after one mini-peak, mini-troughs (open dots) represent small CH4 concentration decreases due to CH4 diffusions. Only mini-peak data (solid dots) were log-transformed (natural logarithm) and used for further analyses (Chagunda et al., 2009b). Because mini-peaks reflect two different possibilities of CH4 excretion – (i) CH4 absorption from the rumen or lower digestive tract and emission via the lungs (respiration) and (ii) CH4 emissions directly from the rumen (eructation) (Murray et al., 1976) – a double normal distribution for mini-peaks was assumed. The dashed line in Fig. 1 shows the defined threshold at 95 % cumulative probability (35.87 µL L−1) for the lower normal distribution from all CH4 mini-peak observations. Consequently, all mini-peaks (solid dots) under the dashed line belong to CH4 emitted during respiration. All mini-peaks (solid dots) above the threshold represent CH4 concentrations during eructation. A group of solid dots including more than two mini-peaks above the dashed line was defined as one eructation event. Each normal distribution (respiration CH4; eructation CH4) represents a separate CH4 dataset with separate mean and maximum. Based on the data preparation protocol, the following CH4 traits were defined:
-
: mean CH4 concentration during respiration and eructation,
-
: mean CH4 concentration during respiration,
-
: sum of CH4 concentrations per minute during respiration,
-
: maximum CH4 concentration during respiration,
-
: mean CH4 concentration during eructation,
-
: sum of CH4 concentrations per minute during eructation,
-
: maximum CH4 concentration during eructation,
: number of eructation events per minute.
Descriptive statistics for the defined CH4 traits are given in Table 1.
Table 1Descriptive statistics for ewe body weight (EBW), ewe body condition score (BCS), ewe backfat thickness (BFT) and CH4 traits in the breeds Merinoland (ML) and Rhön sheep (RH).
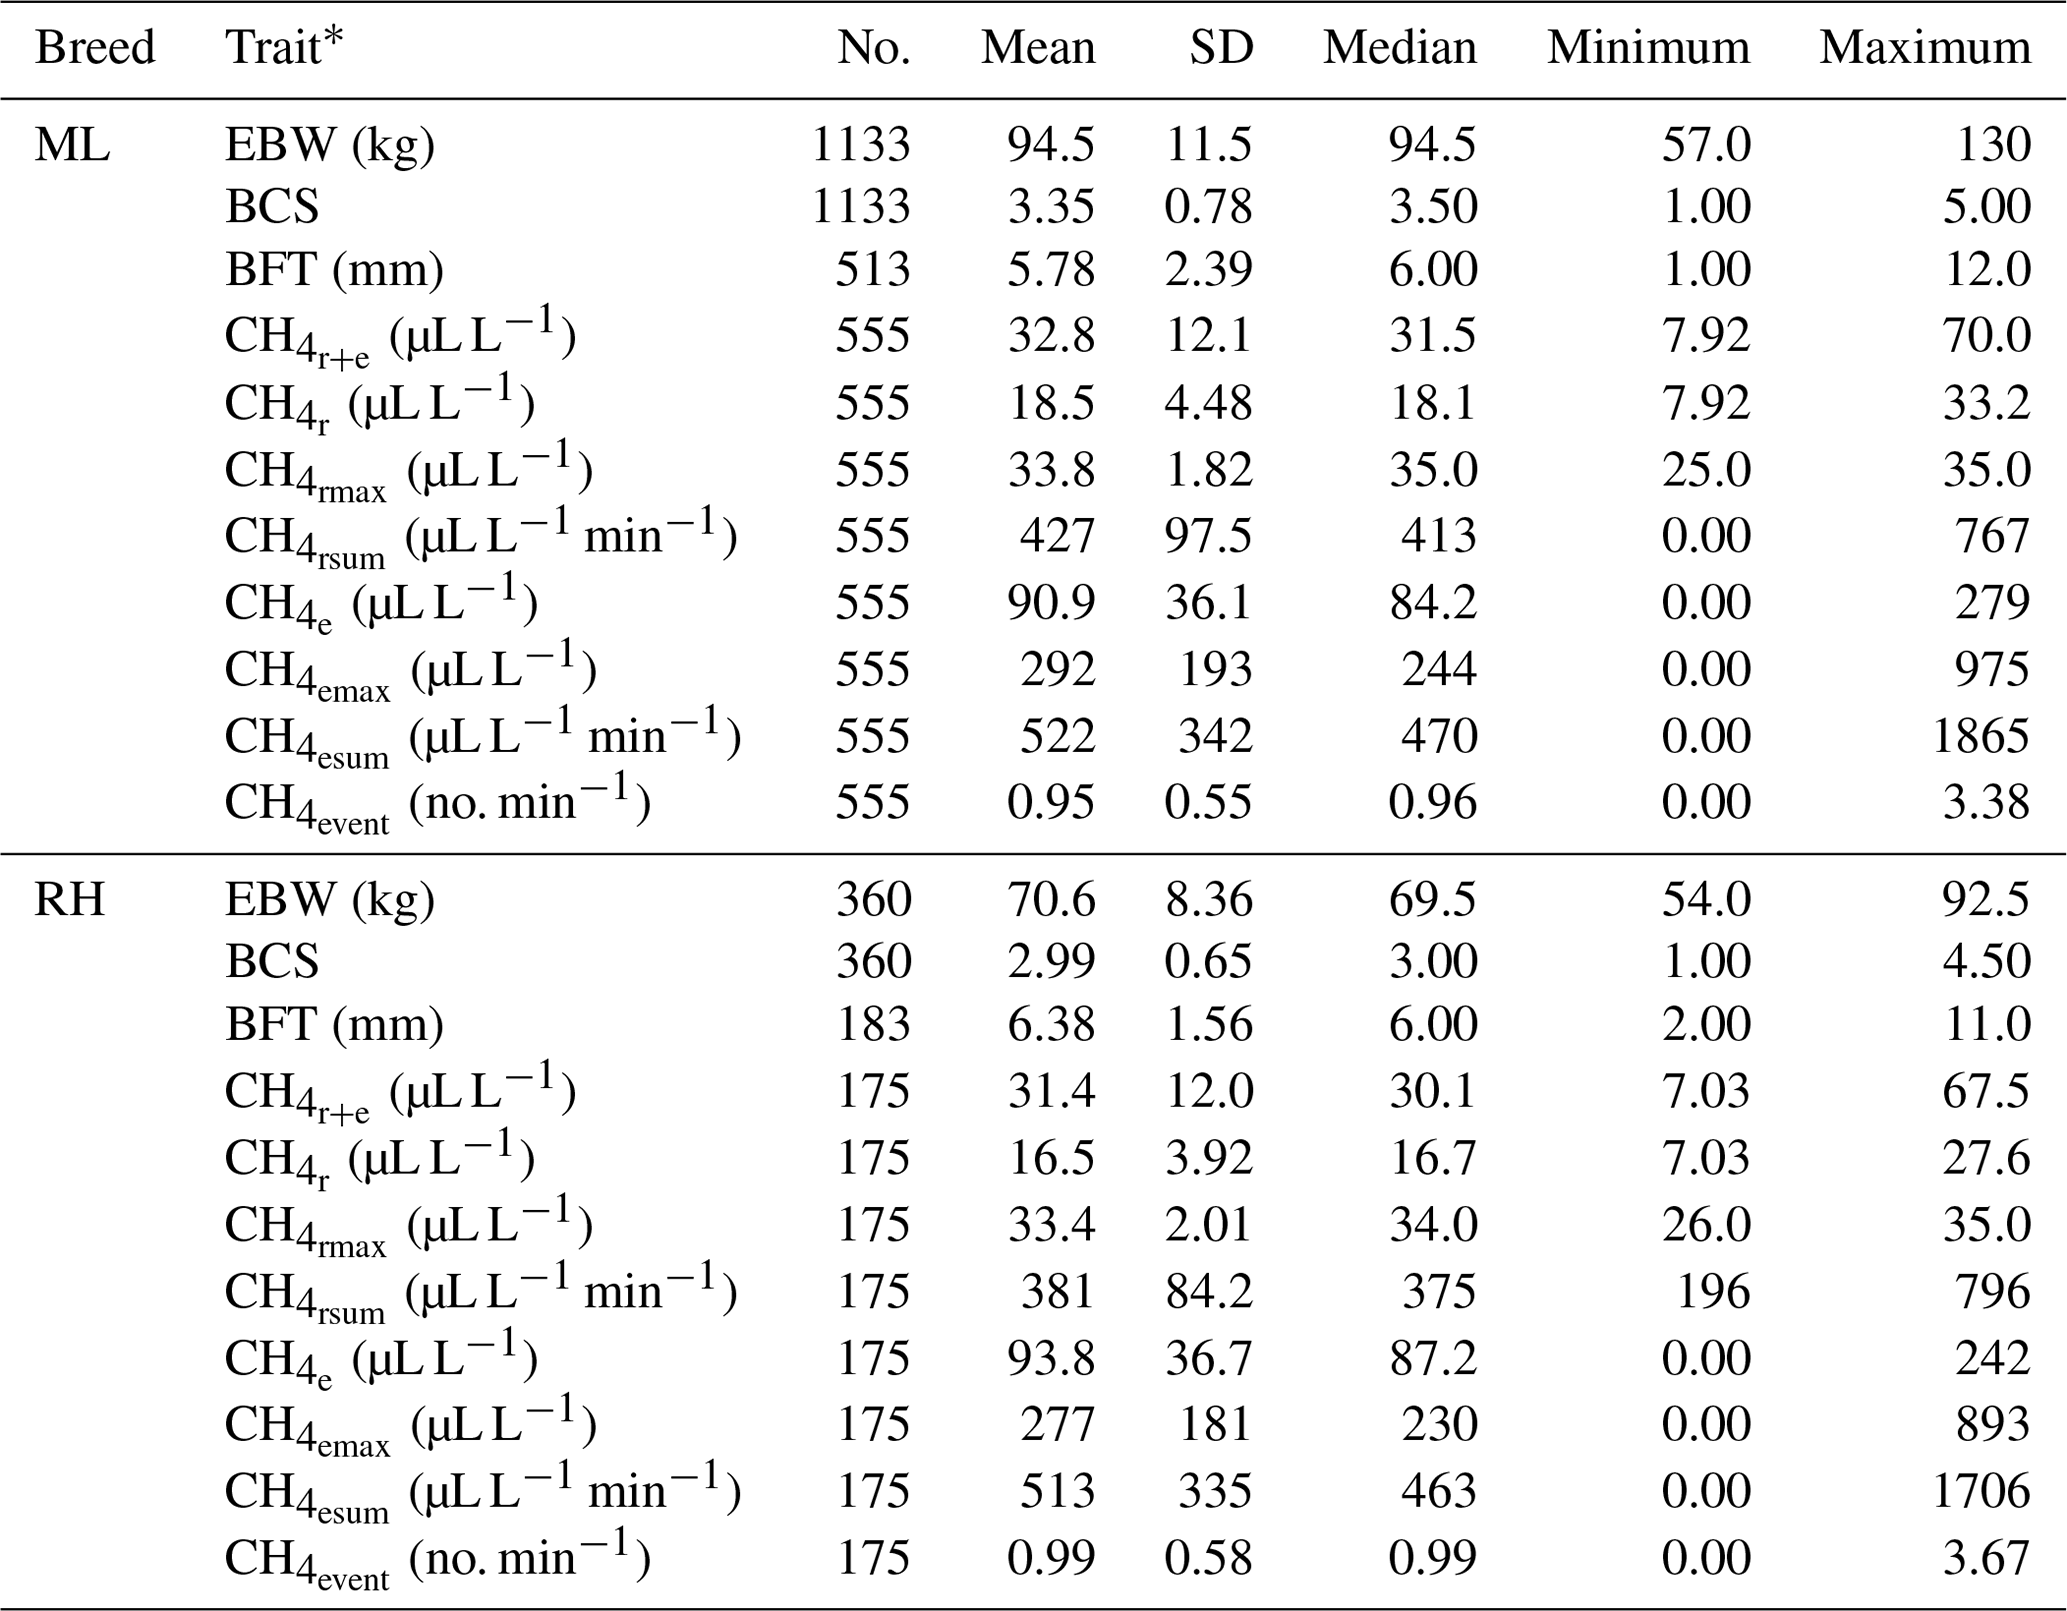
* : mean CH4 concentration during respiration and eructation; : mean CH4 concentration during respiration; : maximum CH4 concentration during respiration; : sum of CH4 concentrations per minute during respiration; : mean CH4 concentration during eructation; : maximum CH4 concentration during eructation; : sum of CH4 concentrations per minute during eructation; : number of eructation events per minute.
2.5 Phenotypic associations between ewe CH4 emissions with ewe and lamb body weight traits
The impact of ewe CH4 emissions on EBW, BFT, BCS and LBW was studied via mixed model applications as implemented in the software package SAS Studio Version 3.71 (SAS Institute Inc., 2017). In matrix notation, the statistical model Eq. (1) was defined as follows:
where y is a vector of observations for the traits EBW, BFT, BCS and LBW; b is a vector of fixed effects including the combined effect of birth type (single, twin, triplet) and sex of the lamb (male, female), breed (ML, RH), the combined month–of-the-year effect, ewe BCS (1–5) (apart from the models where BCS and BFT are the traits of interest), and the fixed regression of the lamb age (0 to 73 d) within breed modeled with Legendre polynomials of fourth order. Furthermore, vector b included in consecutive runs the different CH4 traits - (≤25 µL L−1; 26–35 µL L−1; ≥36 µL L−1), - (≤15.5 µL L−1; 15.6–19.5 µL L−1; > 19.5 µL L−1), - (≤360 µL L−1 min−1; 361–439 µL L−1 min−1; ≥440 µL L−1 min−1), - (≤34 µL L−1; > 34 µL L−1), - (≤72 µL L−1; 73–99 µL L−1; > 99 µL L−1), - (≤310 µL L−1 min−1; 311–620 µL L−1 min−1; > 620 µL L−1 min−1), - (≤170 µL L−1; 171–315 µL L−1; > 315 µL L−1), and class (≤0.96 min−1; > 0.96 min−1). u is a vector for the random ewe or lamb effect considering up to four repeated measurements per ewe and lamb, e is a vector of random residual effects, and X and Z are incidence matrices for b and u, respectively.
2.6 Genetic parameters for ewe CH4 emissions and body weight traits
Genetic (co)variance components for all trait combinations including EBW, BCS, BFT and LBW were estimated by applying the software package DMU (Madsen and Jensen, 2013) and using the AI-REML algorithm for multiple-trait animal models. For the CH4 traits , , , , , , and , single-trait animal models were applied. Multiple-trait models converged properly for EBW, BCS, BFT and LBW due to the larger dataset, but some convergence problems occurred when additionally including CH4 traits from the smaller subset of phenotyped ewes. This was the reason for the application of single-trait animal models for CH4 traits.
The statistical model Eq. (2) for genetic analyses in matrix notation was defined as follows:
where y is a vector of observations for EBW, BCS, BFT and LBW and CH4 traits; b is a vector of fixed effects including all effects as introduced in model (1) and the fixed effects for the temperature class (≤4, 4.1–8.5, 8.6–11, > 11 ∘C) and for the humidity class (≤43 %, 44 %–55 %, 56 %–64 %, > 64 %); a is a vector of random additive genetic effects considering the genetic relationships from an animal model; pe is a vector of random permanent environmental effects for repeated measurements; e is a vector of random residual effects; and X, Z and W are incidence matrices for b, a and pe, respectively.
Correlations among estimated breeding values (EBVs) for CH4 traits (EBV from the single-trait models), and between EBV for CH4 traits and EBV for EBW, BCS, BFT and LBW (EBV from the multiple-trait model) were transformed into genetic correlations according to Calo et al. (1973):
where R was the EBV reliability for an individual i in trait j. For the genetic correlation approximations, we only considered EBV from ewes with phenotypic records.
3.1 Strategies of CH4 trait definitions
The introduced CH4 data preparation strategy is very complex. Nevertheless, a separation of respiration and eructation CH4 is physiologically reasonable and considers environmental air movements. We identified a high agreement between statistically defined eructation events and ewe eructation during trait recording (own visual inspections of eructation events during CH4 recording). In our data, during the 3 min recording interval, 95 % of ewes eructated at least once. The eructation probability in the study by Ricci et al. (2014) was slightly lower (92 %), but they considered a 2 min recording interval. Hence, a minor disadvantage for specific CH4 eructation trait definitions is the small percentage of ewes (5 %) which had to be excluded from data processing. Chagunda et al. (2009b) introduced a further transformation of LMD output data (µL L−1) into daily CH4 production (g d−1) but without distinguishing into respiration and eructation. The data processing procedure by Chagunda et al. (2009b) also required complex equations including approximations for, for example, individual respiratory tidal volume or for the daily animal activity level. Methane traits as defined in our study reflect “pure” CH4 emissions, whereas CH4 predictions by Chagunda et al. (2009b) depend on body trait or physiological characteristics. Hence, in quantitative genetic studies, and following a deterministic CH4 prediction strategy, the estimated heritability does not fully reflect the individual CH4 genetic background (Yin et al., 2015). In genome-wide association studies, Manzanilla-Pech et al. (2016) found an overlap for 19 % of SNP markers being significantly associated with DMI, body weight and individual CH4 production in dairy cattle. In consequence, they suggested consideration of residual CH4 emissions that are additionally pre-corrected for CH4 indicator traits (e.g., for DMI and for body weight).
Moreover, our CH4 trait separation into respiration and eructation provides deeper insights into the different physiological mechanisms associated with CH4 output. The CH4 separation strategy allows studying the isolated influence of either respiration or eructation on ewe body condition traits and on LBW. Nevertheless, our approach depends on the individual threshold definition for the two normal distributions (respiration and eructation).
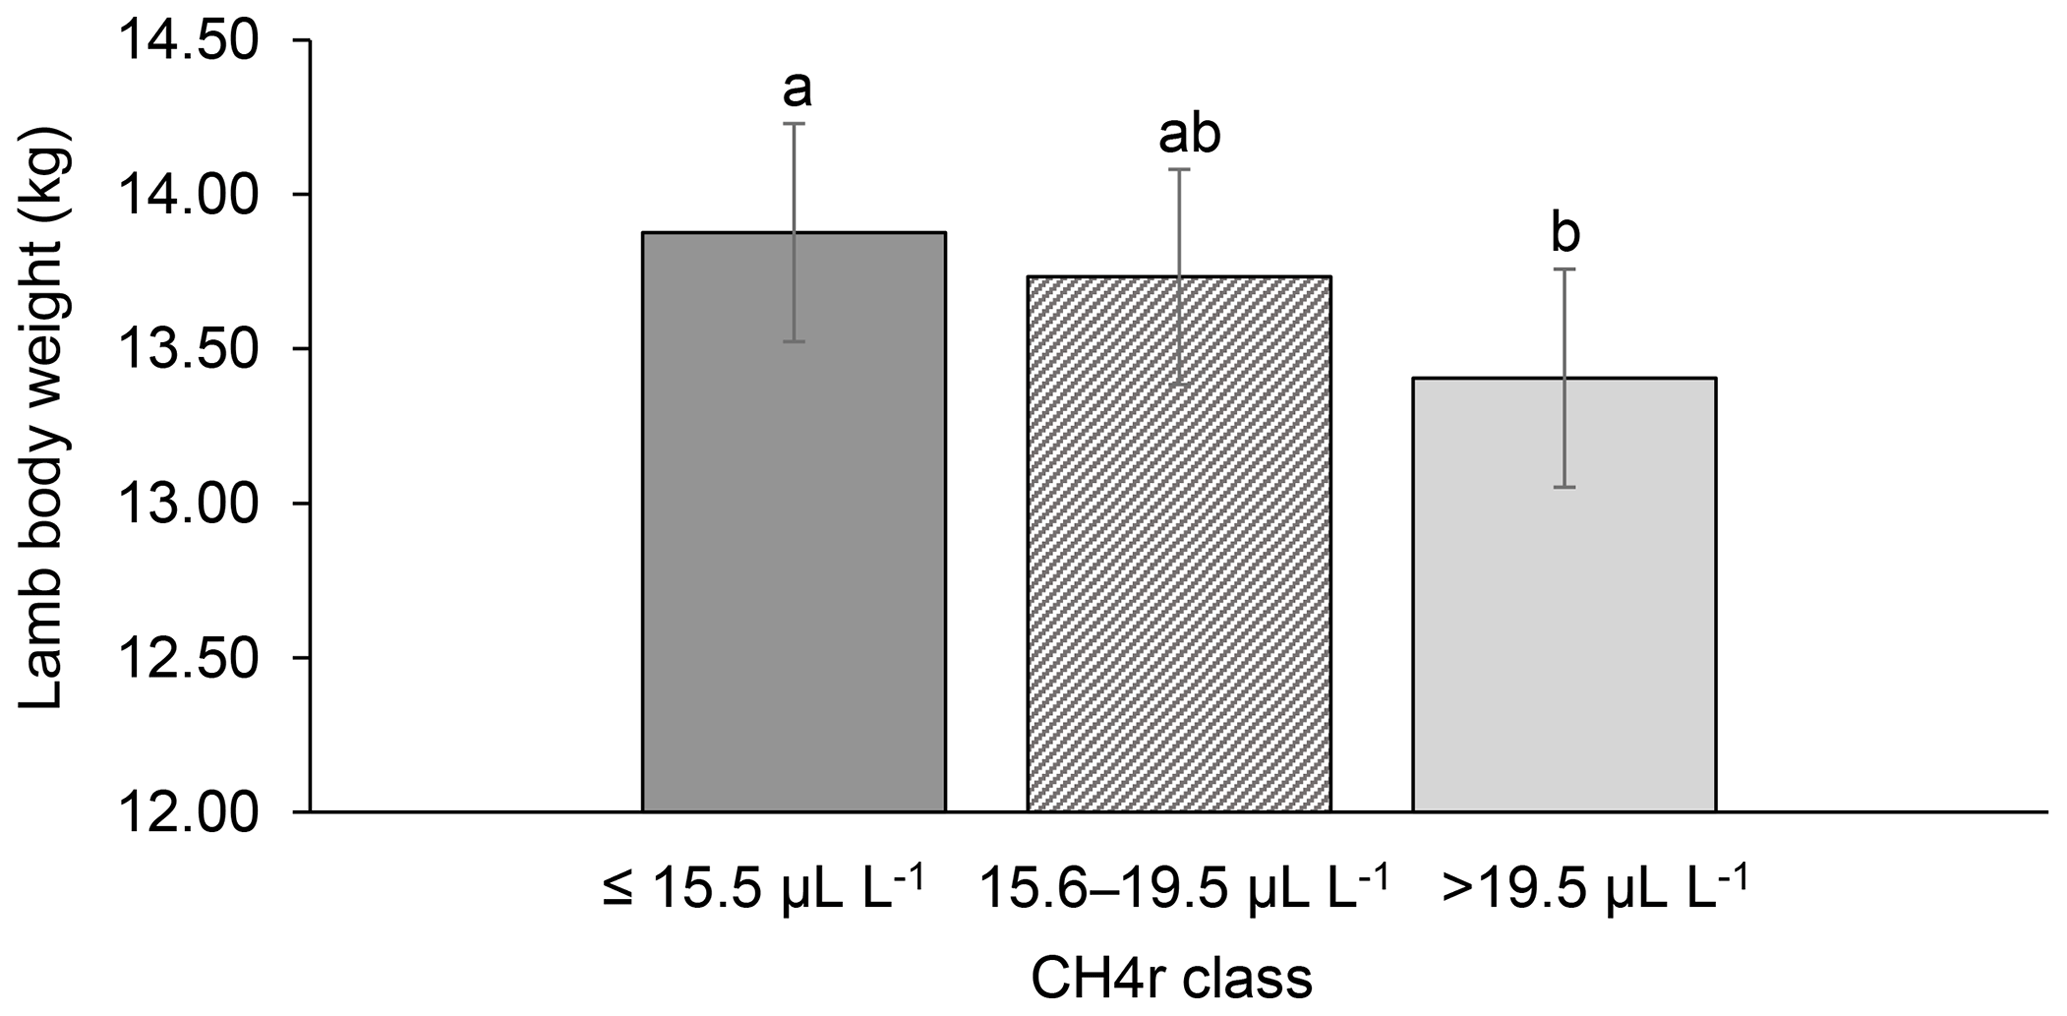
Figure 2Least-squares means for lamb body weight (LBW) depending on ewe mean CH4 concentration during respiration ( class; model 1). Different letters represent significant differences (P<0.01).
3.2 Phenotypic impact of CH4 traits on lamb body weight and ewe body condition
Among all CH4 traits, the inclusion of CH4 mean concentration during respiration () as class effect in model (1) gave the lowest value for the Akaike information criterion (Akaike, 1973) (Table 2). Hence, consideration indicated statistical modeling superiority. The class effect significantly influenced LBW (P<0.05) and EBW (P<0.01) (model 1). Ewes with low mean CH4 emissions during respiration reared heavier lambs than ewes with high CH4 emissions (P<0.001; Fig. 2). Simultaneously, low mean CH4 emissions during respiration were associated with larger estimates for EBW during lactation (P<0.001; Fig. 3). EBW during lactation for ewes from the low class was significantly higher (0.74 kg, P<0.05) compared to EBW from ewes with high emissions ( class > 34 µL L−1). In cattle, Johnson and Johnson (1995) identified high CH4 emissions as major contributors to energy losses, comprising 5 %–12 % of the gross energy intake. Consequently, limited energy is available for milk production, explaining the lower LBW of lambs from ewes with high CH4 output during lactation. Kandel et al. (2017) and Chagunda et al. (2009a) confirmed such unfavorable associations between CH4 emissions and milk yield in cattle. Interestingly, the CH4 eructation traits represent larger CH4 emissions than the respiration traits (Blaxter and Joyce, 1963), but only the respiration CH4 traits and significantly influenced LBW and EBW. An explanation for the significant impact of “low-level CH4” (, ) on LBW and EBW might be due to the short recording interval of only 3 min. For a small recording interval, the percentage of respiration in relation to eructation is larger, compared to, for example, accumulate 24 h measurements.
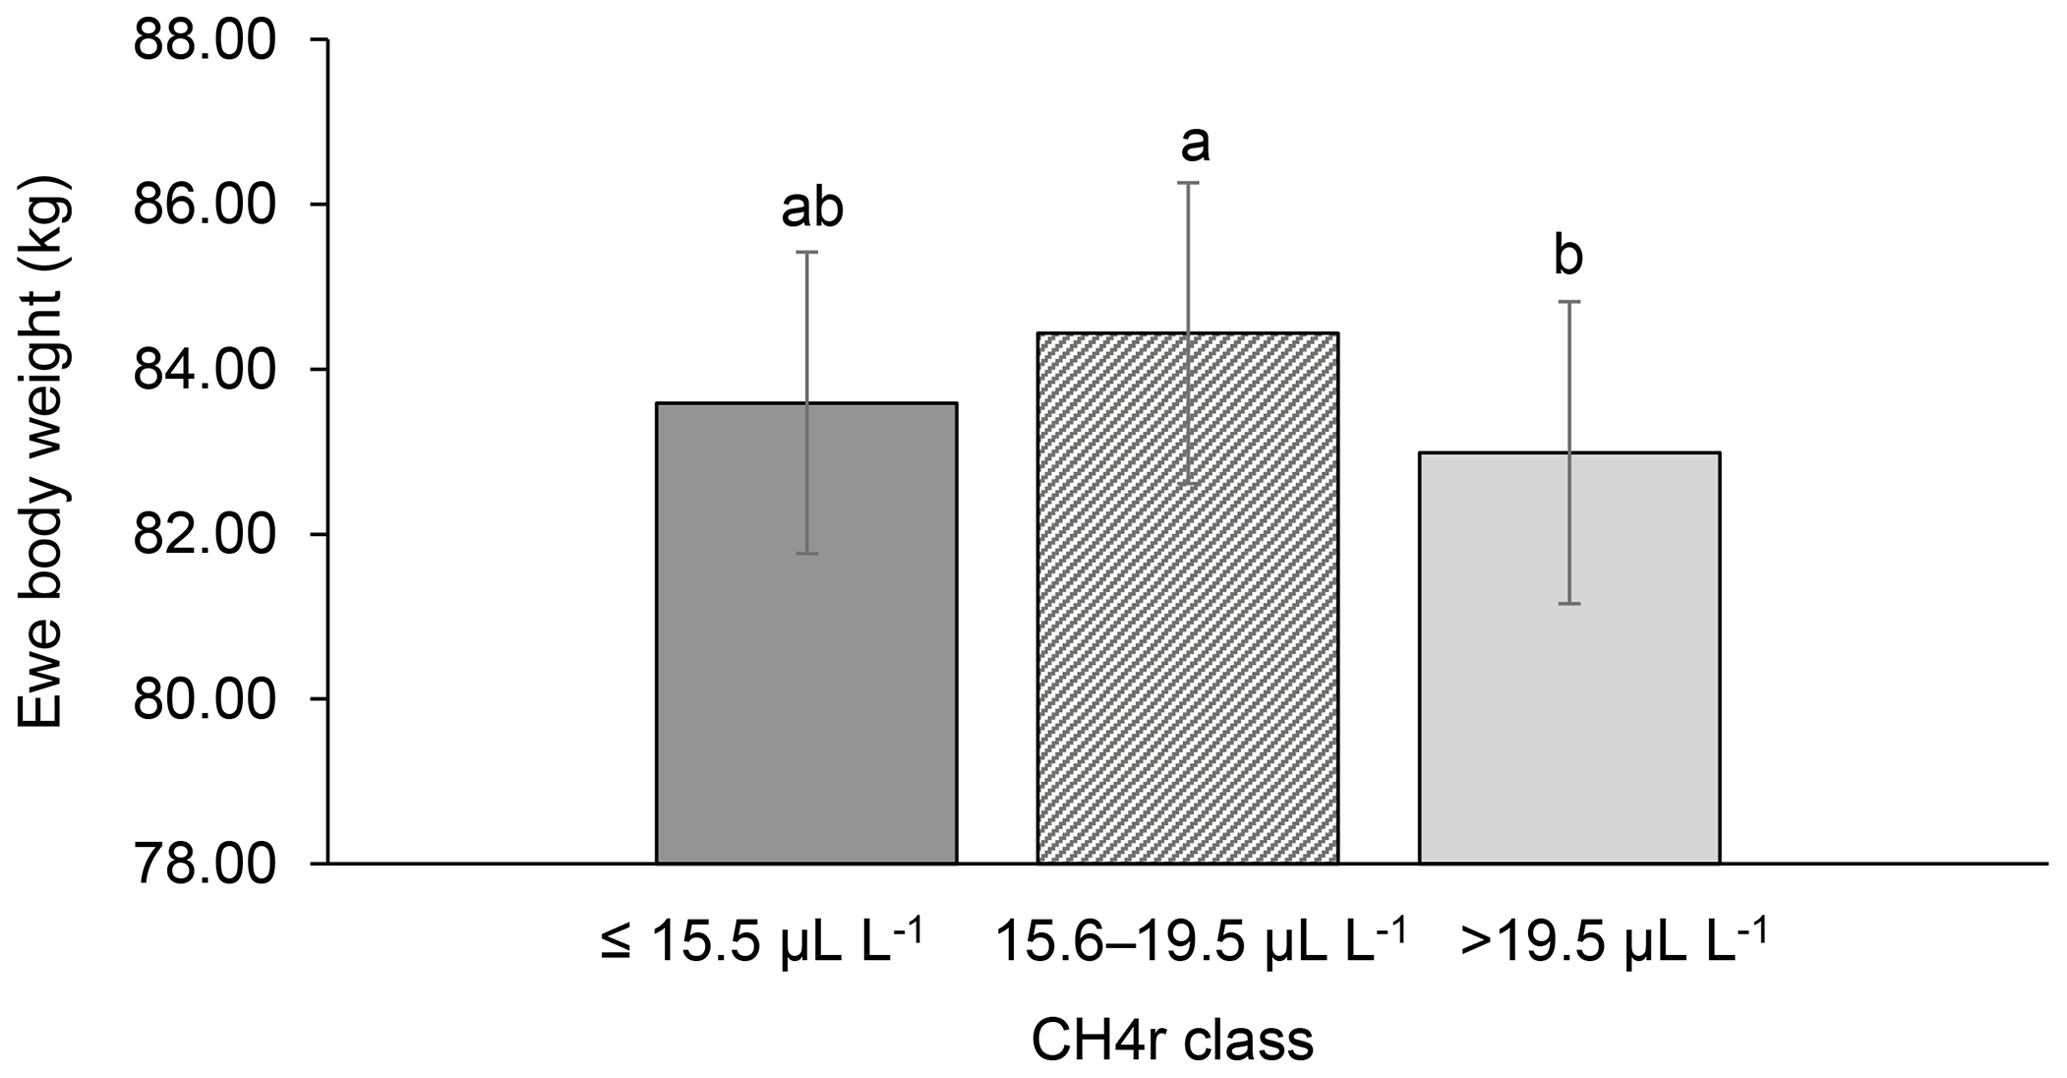
Figure 3Least-squares means for ewe body weight (EBW) depending on ewe mean CH4 concentration during respiration ( class; model 1). Different letters represent significant differences (P<0.01).
Table 2Akaike information criterion (AIC) for model (1) with the dependent traits of lamb body weight (LBW) or ewe body weight (EBW), considering different CH4 class effects.
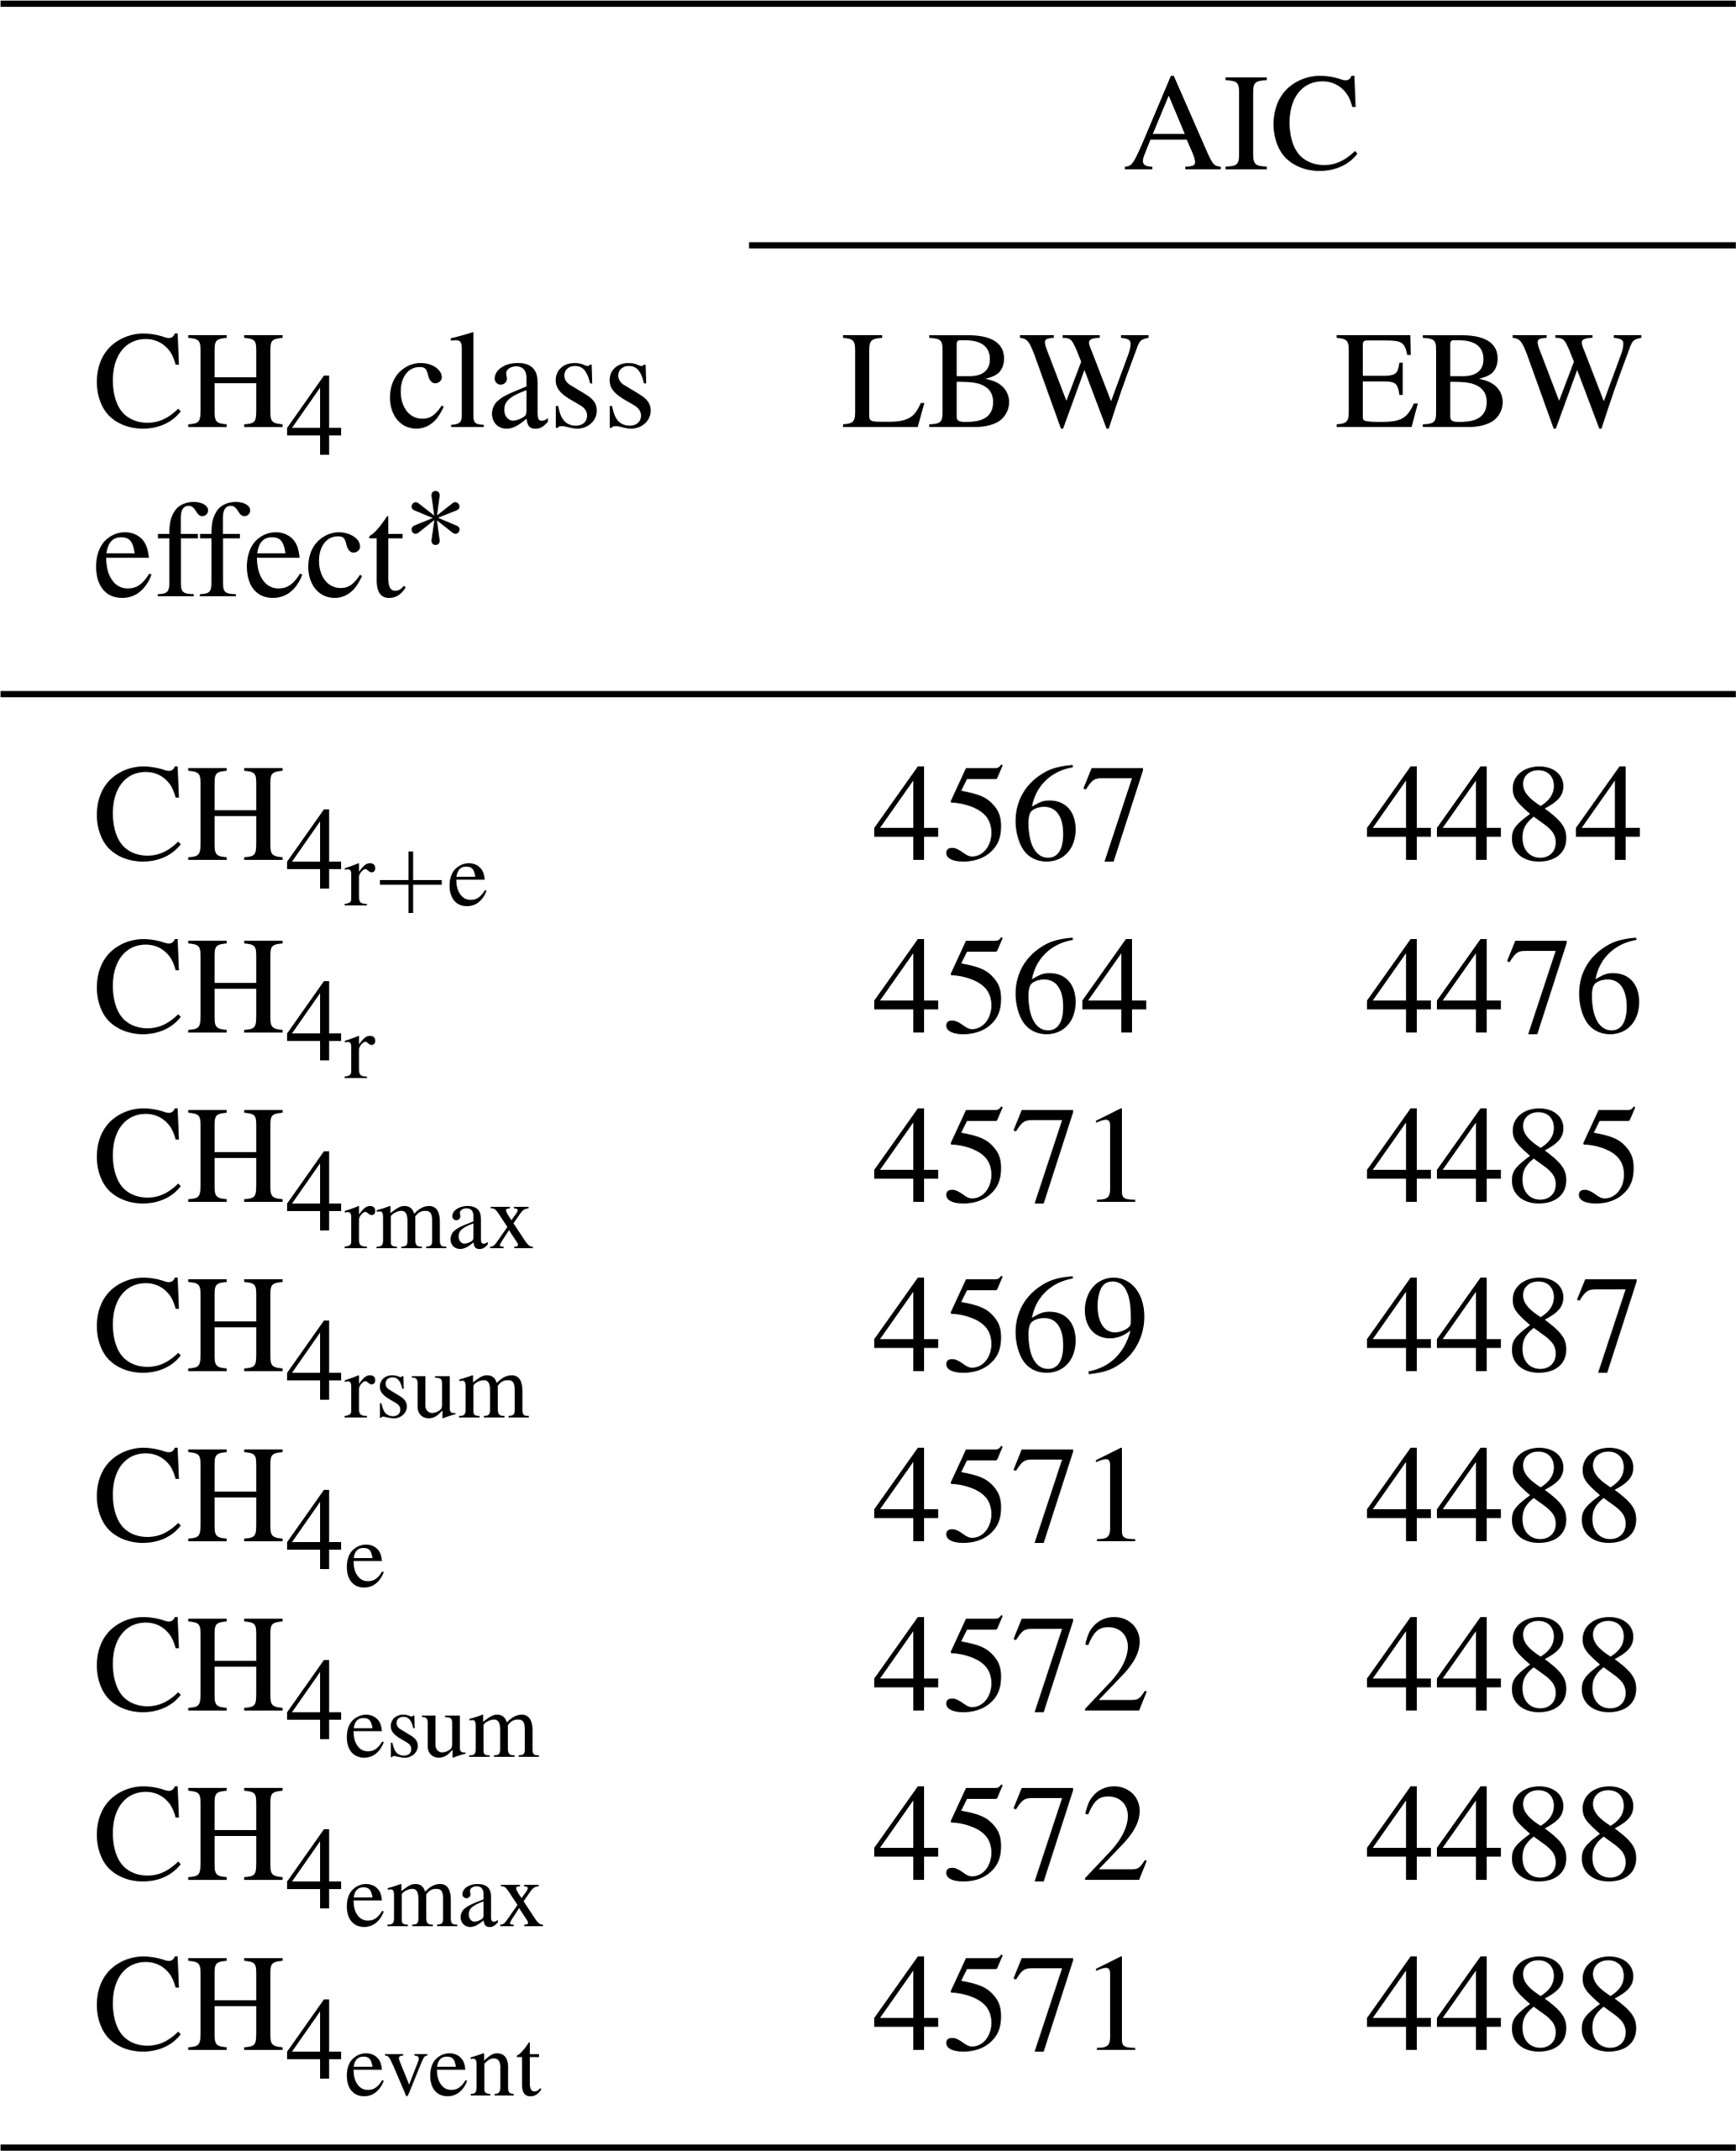
* : mean CH4 concentration during respiration and eructation; : mean CH4 concentration during respiration; : maximum CH4 concentration during respiration; : sum of CH4 concentrations per minute during respiration; : mean CH4 concentration during eructation; : maximum CH4 concentration during eructation; : sum of CH4 concentrations per minute during eructation; : number of eructation events per minute.
Least-squares means for BFT declined with increasing ewe CH4 emissions. In this regard, ewes representing the medium , and class had 0.38 to 0.43 mm less BFT than ewes from the low CH4 classes (P<0.05) (Fig. 4). An increase of CH4 emissions was associated with inefficient feed conversion, both contributing to energy deficiency during the early lactation stage (Hegarty et al., 2007; Paganoni et al., 2017). Hence, for energy deficiency compensation due to mammary requirements during lactation (intensified through CH4 emissions), ewes are forced to increase the mobilization rate of their own body fat depots (Bell, 1995), explaining the EBW and BFT decline. Such initiated catabolic processes depend on liver glycogen levels, which represent an important glucose (energy) body resource. Physiologically, catecholamine and glucagon blood levels are increasing, initiating the hydrolysis of body fat deposits (triglycerides) (Lawrence and Fowler, 2002). Ewes from the present study received concentrates but also responded with a BFT decline during lactation. Weston (1996) indicated the general problem of energy deficiency of lactating ewes, especially in pasture based production systems. Consequently, we suggest selection strategies on low CH4 emissions, in order to avoid further energy losses.
Bielak et al. (2016) suggested plasma levels of non-esterified fatty acids (NEFAs) as indicators for body fat mobilization. In lactating dairy cows, Bielak et al. (2016) identified a negative relationship between CH4 production per DMI and NEFA plasma levels. Nevertheless, intensified body fat mobilization with decreasing CH4 emissions in cows is in contradiction with the identified associations in the present study for sheep. Summarizing the phenotypic relationships, low values for , , , and in ewes were favorably associated with maternal body fat storage during lactation, and with increasing LBW.
3.3 Genetic parameters for CH4, ewe body condition traits and lamb body weight
In previous studies, variation of individual CH4 emissions was due to the diet composition and feeding system characteristics (Chagunda et al., 2009a; Pinares-Patiño et al., 2011; Bell et al., 2016), ruminal microbiome (Shi et al., 2014) and host genetic compositions (Pinares-Patiño et al., 2013). Genetic variation for CH4 emissions indicates the general possibilities for genetic selection, but this variation was only detected for and (Table 3). Correspondingly, heritabilities for CH4 traits (Table 3) were close to zero, with the largest estimate for (0.03). Pickering et al. (2015) and Paganoni et al. (2017) estimated heritabilities for CH4 in a comparable range from 0.05 to 0.14 in dairy cattle and sheep, respectively. For CH4 recordings, Paganoni et al. (2017) used portable accumulation chambers, and they applied the technique to lambs at post-weaning age and hoggets. Hence, CH4 heritabilities in ruminants are generally quite low, irrespective of the utilized measurement technology and the age of animals. Quite large residual variances (as also indicated in Table 3 for the traits in the present study) due to further environmental effects, which were not considered in statistical modeling, e.g., the individual stress level during measurement or the exhalation rate (Wu et al., 2018), might explain the generally small CH4 heritabilities in sheep. Large residual variances and small heritabilities indicate only minor selection response when aiming on reduced CH4 emissions. Besides, some ewes did not show any eructation during short time measurements. For the inclusion of eructation CH4 traits (, , , ) into overall breeding goals, it is imperative to consider repeated measurements per animal, in order to guarantee at least one eructation per measurement.
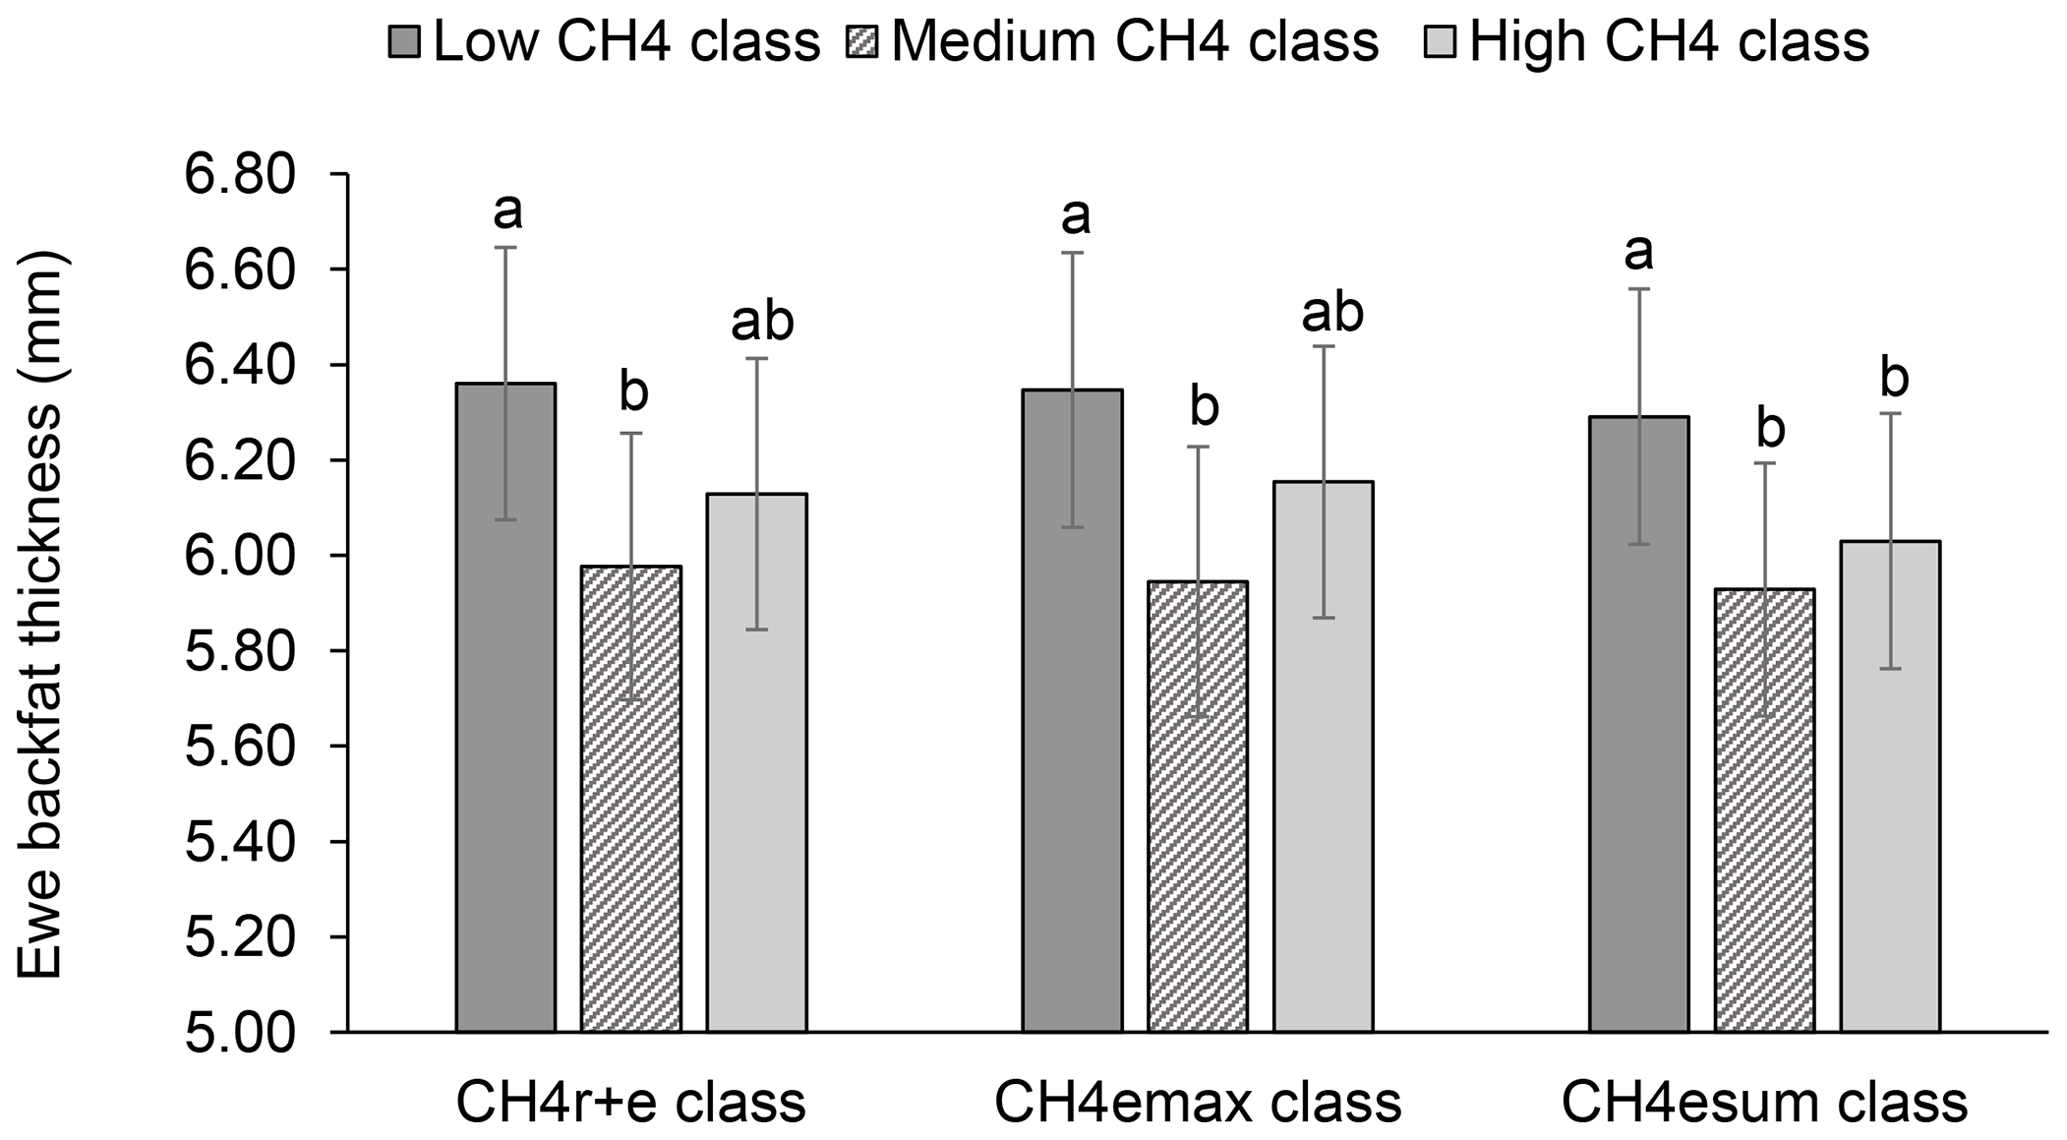
Figure 4Least-squares means for ewe backfat thickness (BFT) depending on ewe mean CH4 concentration during respiration and eructation ( class), maximal CH4 concentration during eructation ( class), and sum of CH4 concentrations per minute during eructation ( class) (model 1). Definition of CH4 classes: low CH4 class: ≤25 µL L−1; ≤170 µL L−1; ≤310 µL L−1 min−1; medium CH4 class: 26–35 µL L−1; 171–315 µ L L−1; 311–620 µL L−1 min−1; high CH4 class: ≥36 µL L−1; > 315 µL L−1; > 620 µL L−1 min−1. Different letters represent significant differences (P<0.01).
Table 3Heritabilities (h2) with standard errors (SE), additive genetic variances (), permanent environmental variances () and residual variances () for lamb body weight (LBW), ewe body weight (EBW), ewe body condition score (BCS), ewe backfat thickness (BFT) and CH4 traits.
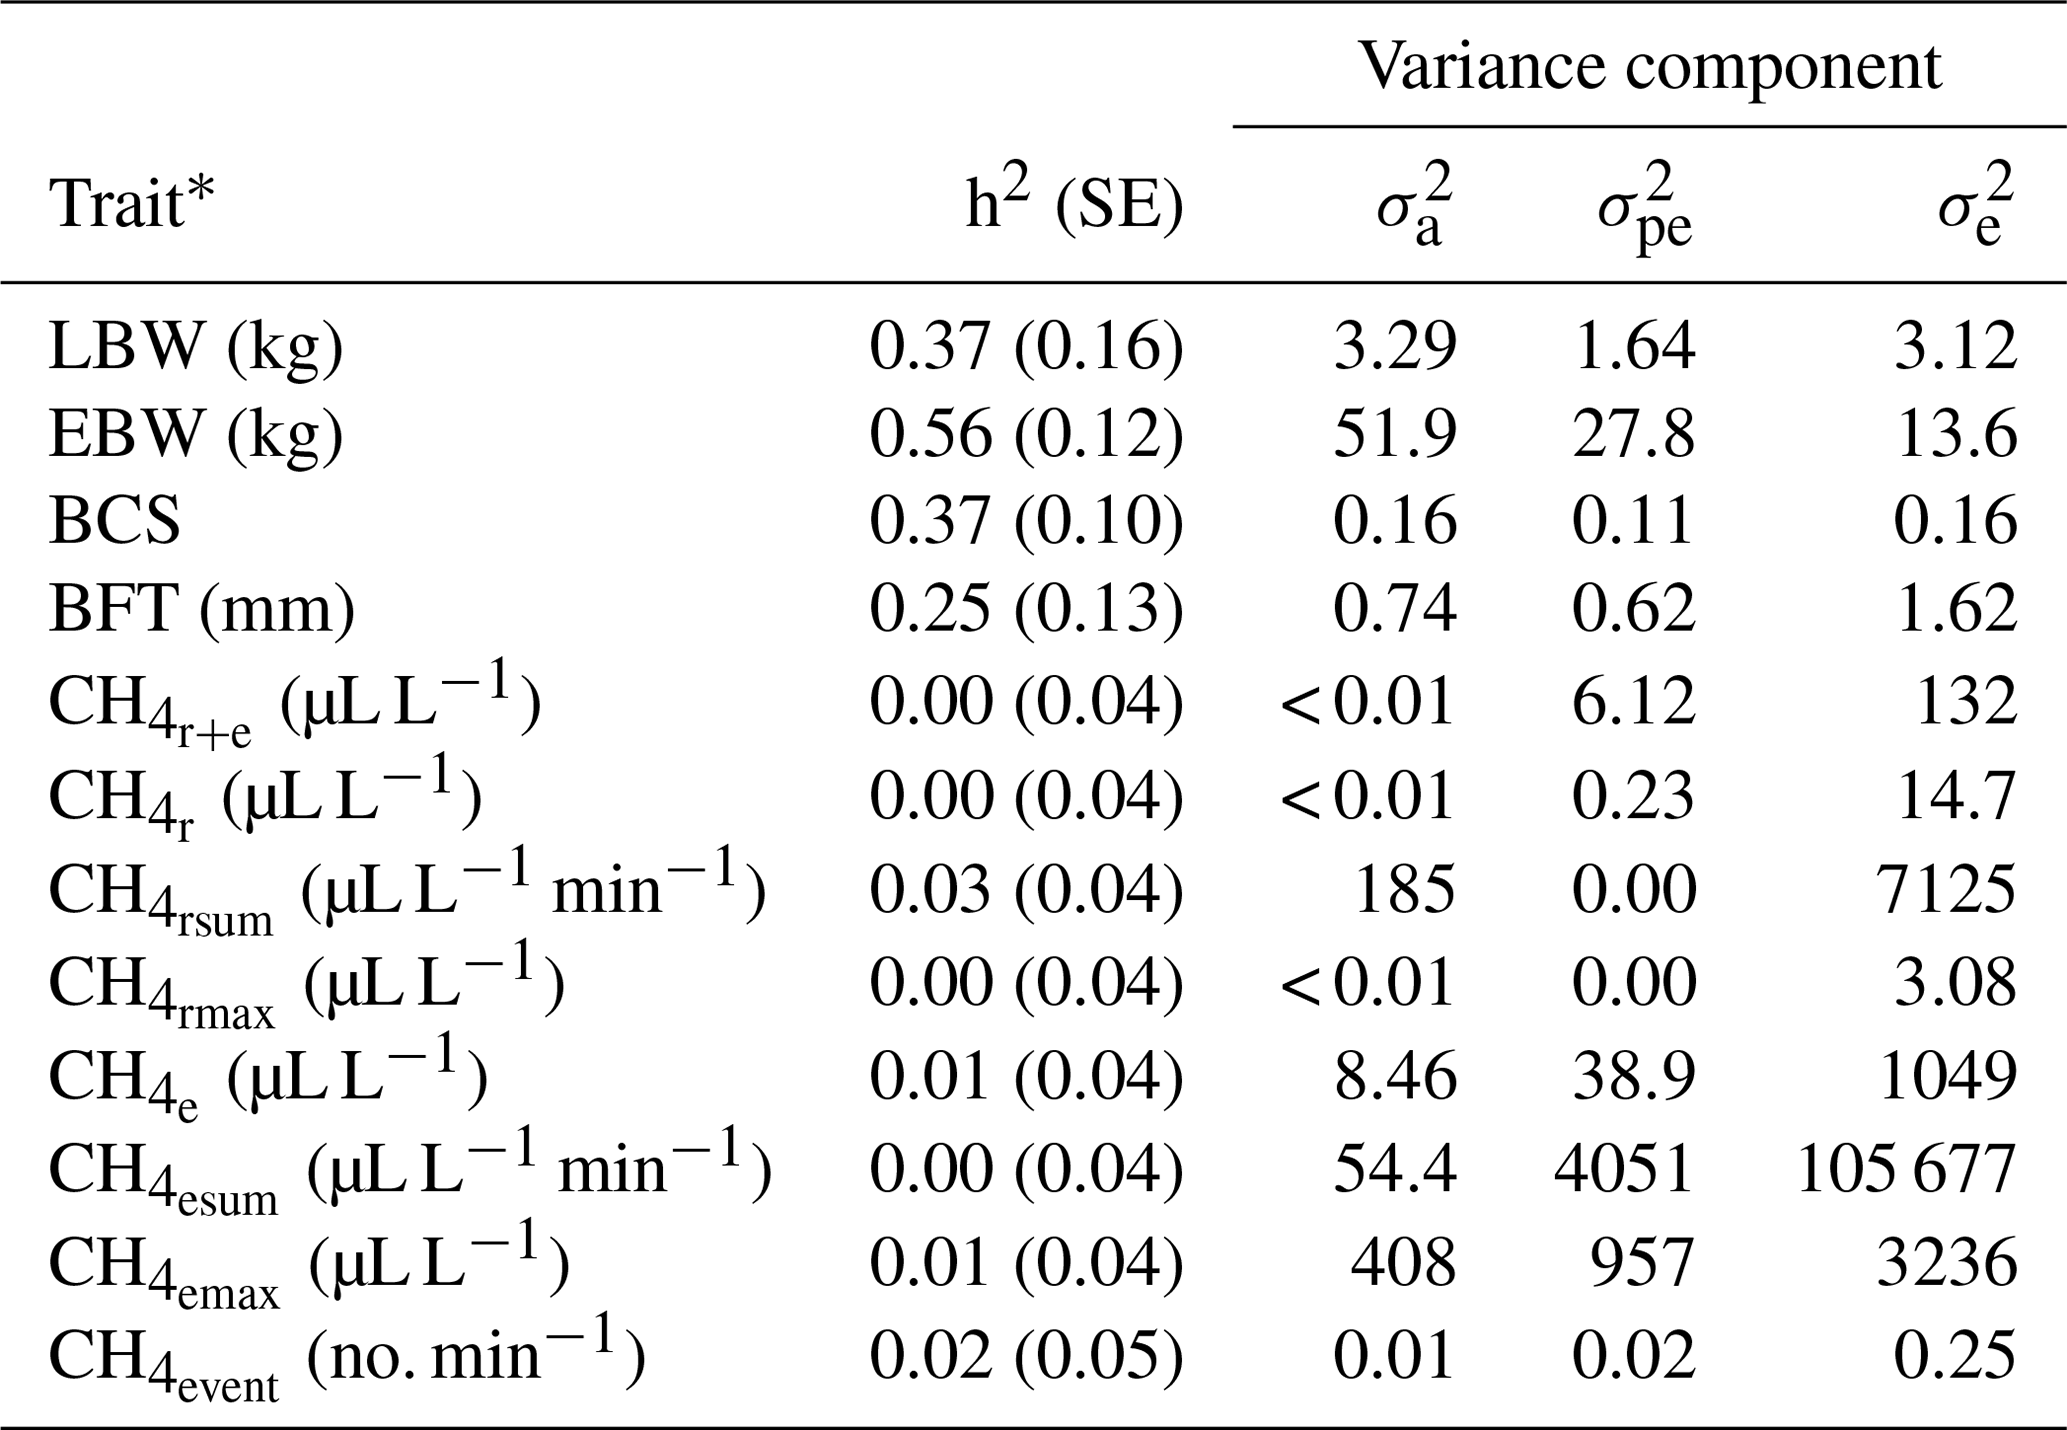
* : mean CH4 concentration during respiration and eructation; : mean CH4 concentration during respiration; : maximum CH4 concentration during respiration; : sum of CH4 concentrations per minute during respiration; : mean CH4 concentration during eructation; : maximum CH4 concentration during eructation; : sum of CH4 concentrations per minute during eructation; : number of eructation events per minute.
Heritabilities for body condition traits were 0.56 for EBW, 0.37 for BCS, 0.25 for BFT and 0.37 for LBW (Table 3). Pinares-Patiño et al. (2013) and Borg et al. (2009) estimated similar heritabilities for live weight of 0.46 and 0.38, respectively. Jonker et al. (2018) estimated a heritability of 0.35 for LBW at 4 to 13 months of age, confirming our estimate of 0.37. The BFT heritability reflects estimates by Gernand et al. (2008) and Brito et al. (2017), but in both studies, the authors considered records from lambs instead of ewe traits.
Table 4Genetic correlations between lamb body weight (LBW), ewe body weight (EBW), ewe body condition score (BCS) and ewe backfat thickness (BFT) with standard errors (in brackets), and approximated genetic correlations between LBW, EBW, BCS, BFT and CH4 traits.
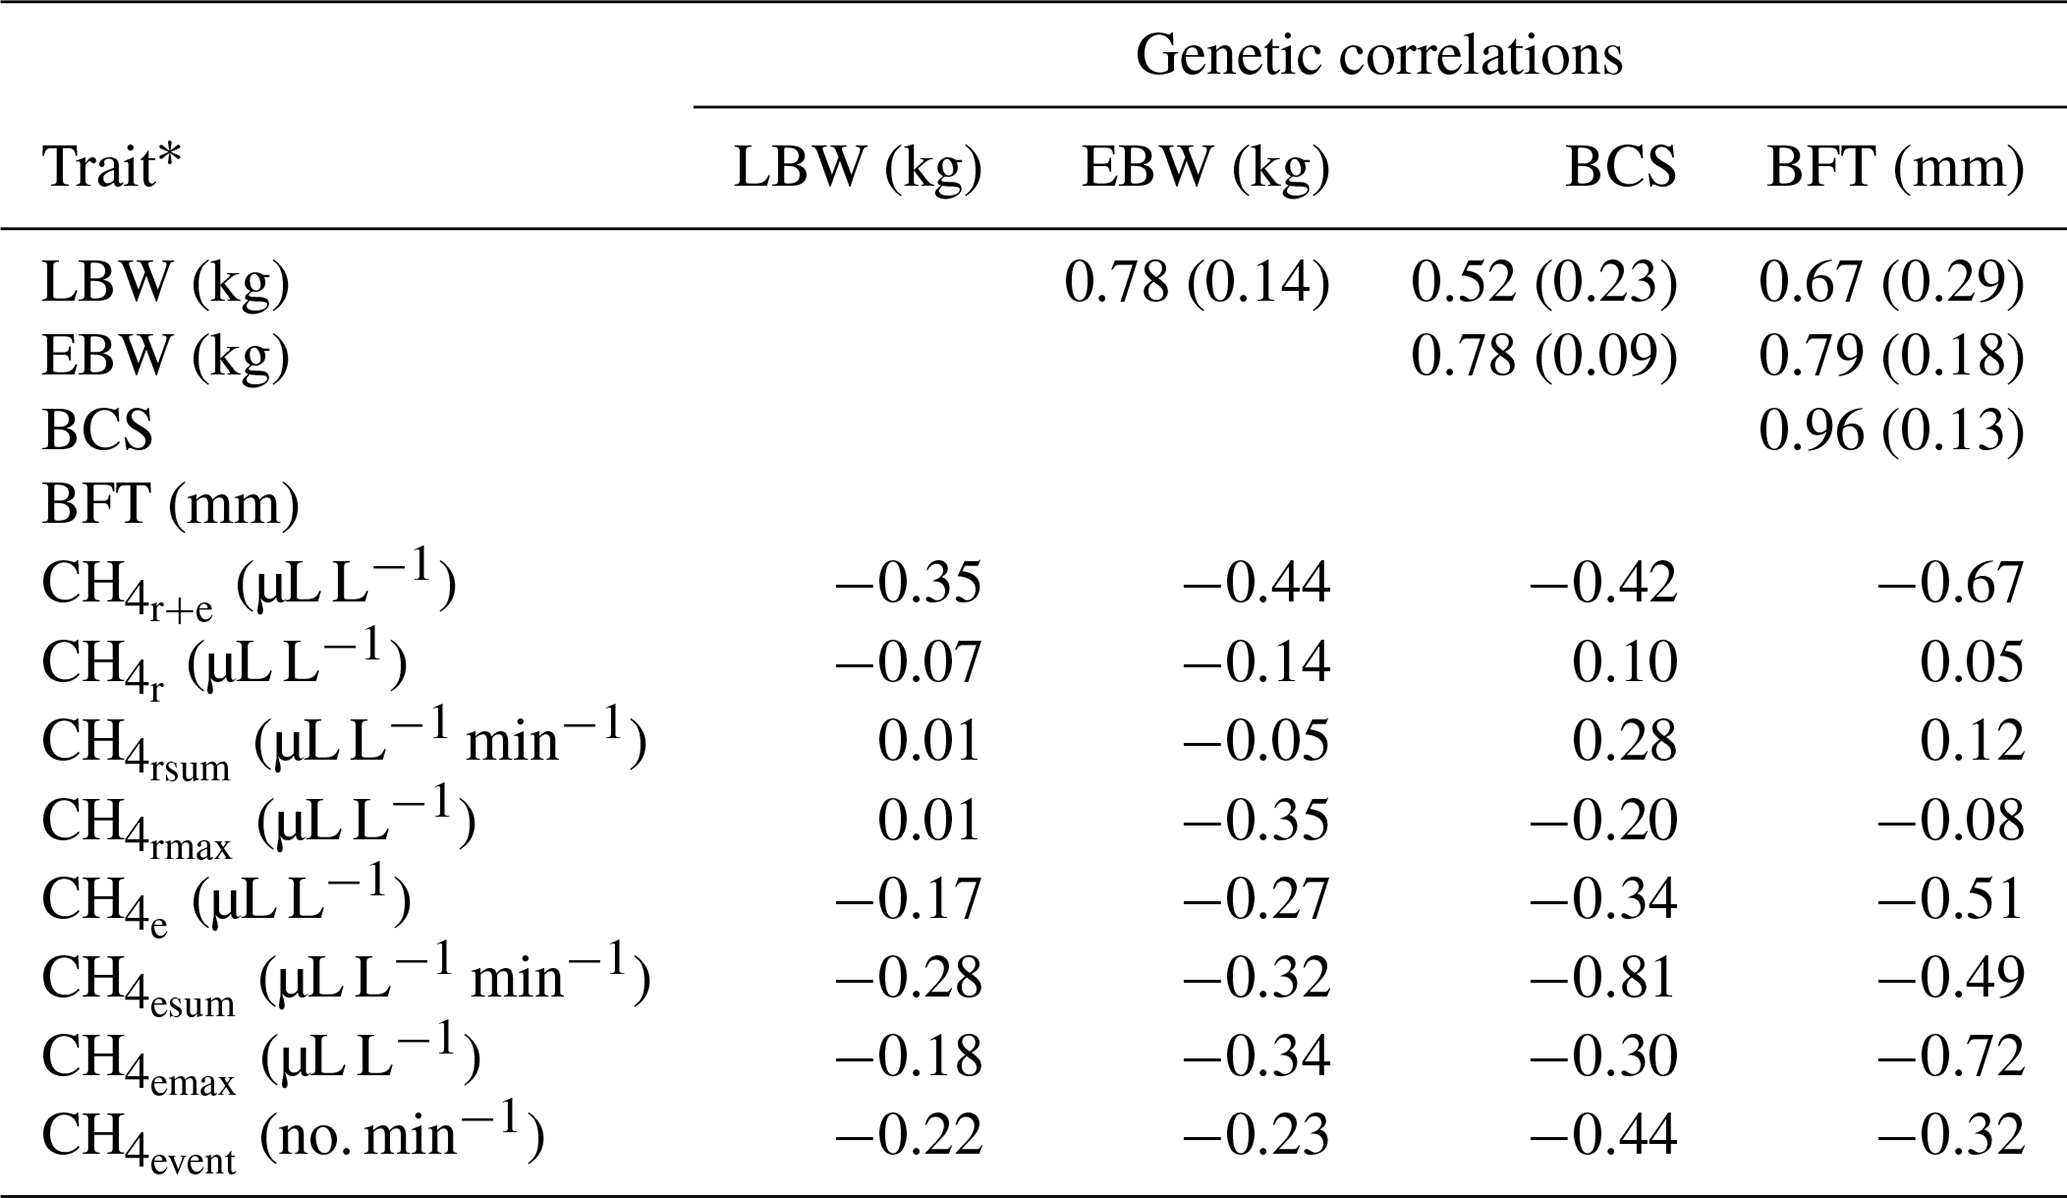
* : mean CH4 concentration during respiration and eructation; : mean CH4 concentration during respiration; : maximum CH4 concentration during respiration; : sum of CH4 concentrations per minute during respiration; : mean CH4 concentration during eructation; : maximum CH4 concentration during eructation; : sum of CH4 concentrations per minute during eructation; : number of eructation events per minute.
3.4 Genetic relationships between CH4 traits with ewe body condition traits and with lamb body weight
For the definition of overall sheep breeding goals including CH4, knowledge about genetic correlations and covariances with other economically important traits (e.g., LBW) is imperative. Genetic correlations between CH4 traits and EBW were slightly (, ) or moderately negative (, , , , , ), indicating that breeding on low CH4 emissions increases EBW and vice versa (Table 4). Generally, genetic correlation estimates between CH4 traits and EBW were in agreement with the phenotypic associations from model (1). In contrast to our results, Pinares-Patiño et al. (2013) estimated a differing genetic correlation of 0.80 between CH4 production (g d−1) and body weights of lambs at the age of 8 months. In the present study, BCS was moderately negatively correlated with all CH4 traits reflecting eructation (, , , ; Table 4). Also, genetic correlations between BCS with and were negative. Zetouni et al. (2018) estimated a similar genetic correlation of −0.28 between CH4 production and BCS in Danish Holstein cows. Regarding BFT, a decline in , , , and was genetically associated with an incline in BFT. The genetic correlations between the respiration CH4 traits (, , ) and BFT were close to zero. In contrast to the phenotypic associations, genetic relationships between respiration CH4 traits (, , ) and LBW were quite low in the range from −0.07 to 0.01. On a genetic basis, among all CH4 traits, had the strongest genetic correlation (−0.35) with LBW.
Genetic correlations among EBW, BCS, BFT and LBW were positive, indicating an incline in LBW when selecting heavy ewes with high values for BCS and BFT. However, a strict selection on increasing EBW, BCS and BFT for indirect improvements of LBW might be associated with insulin resistance and hormone dysregulation in the future F1 and F2 generations (Pankey et al., 2017). Furthermore, adipose ewes were susceptible for dystocia (Peel et al., 2012).
In summary, the CH4 traits , , , and were genetically favorably correlated with LBW, indicating an increase in LBW and simultaneously improvements of EBW, BCS and BFT when selecting on low CH4 emissions, particularly during eructation. Nevertheless, small CH4 heritabilities indicate only slight selection response. Hence, in breeding goals or selection indices, it is imperative to consider the low heritability CH4 traits with high economic values (König et al., 2009).
CH4 recording via LMD technique was successfully implemented in sheep under field conditions. On a longitudinal trait basis, we developed statistical strategies for distinguishing CH4 emissions in respiration and eructation. Large ewe CH4 emissions during respiration were associated with lower EBW as well as with impaired body weight development of their lambs. Additionally, a significant ewe BCS and BFT decrease after lambing was detected in ewes with high levels of CH4 emissions during eructation. Heritabilities for CH4 traits were close to zero (h2 <0.01 to 0.03). Nevertheless, the genetic correlations between CH4 traits , , , and and energy efficiency indicators (e.g., LBW) suggest consideration of ewe CH4 emissions in overall sheep breeding goals when aspiring to feed efficiency improvements. We proved that the utilization of LMD equipment is an appropriate non-invasive method to measure CH4 emissions in sheep rapidly, easily and cost-efficiently. Furthermore, the differentiation between respiration and eructation CH4 emissions provides insights into physiological dynamics of CH4 emissions. Nevertheless, environmental (e.g., micrometeorology) and physiological (e.g., respiratory volume, behavior) factors can influence results from the applied CH4 recording technique and should be considered in future statistical modeling approaches.
The data that support the findings of this study are available from the authors upon reasonable request.
SK, AW and HW designed the experiment and supervised the research. SK supported JR in writing and data validation. JR was responsible for phenotyping activities, supported by PE. JR, KB and TY were responsible for data preparation and genetic statistical analyses. All authors read and approved the manuscript.
The authors declare that they have no conflict of interest.
The authors are grateful to the H. Wilhelm Schaumann Stiftung for providing a scholarship to Jessica Reintke.
This open-access publication was funded
by Justus Liebig University Giessen.
This paper was edited by Manfred Mielenz and reviewed by Angela Schwarm and one anonymous referee.
Akaike, H.: Information theory and an extension of the maximum likelihood Principle, in: Proceedings of the 2nd International Symposium on Information Theory, edited by: Petrov, B. N. and Csaki, F., Akademiai Kiado, Budapest, 267–281, 1973.
Baker, S. K.: Rumen methanogens, and inhibition of methanogenesis, Aust. J. Agr. Res., 50, 1293–1298, https://doi.org/10.1071/AR99005, 1999.
Bell, A. W.: Regulation of organic nutrient metabolism during transition from late pregnancy to early lactation, J. Anim. Sci., 73, 2804–2819, https://doi.org/10.2527/1995.7392804x, 1995.
Bell, M., Eckard, R., Moate, P. J., and Yan, T.: Modelling the effect of diet composition on enteric methane emissions across sheep, beef cattle and dairy cows, Animals, 6, 1–16, https://doi.org/10.3390/ani6090054, 2016.
Bickell, S. L., Revell, D. K., Toovey, A. F., and Vercoe, P. E.: Feed intake of sheep when allowed ad libitum access to feed in methane respiration chambers, J. Anim. Sci., 92, 2259–2264, https://doi.org/10.2527/jas.2013-7192, 2014.
Bielak, A., Derno, M., Tuchscherer, A., Hammon, H. M., Susenbeth, A., and Kuhla, B.: Body fat mobilization in early lactation influences methane production of dairy cows, Sci. Rep., 6, 28135, https://doi.org/10.1038/srep28135, 2016.
Blaxter, K. L. and Joyce, J. P.: The accuracy and ease with which measurements of respiratory metabolism can be made with tracheostomized sheep, Brit. J. Nutr., 17, 523–537, https://doi.org/10.1079/BJN19630055, 1963.
Borg, R. C., Notter, D. R., and Kott, R. W.: Phenotypic and genetic associations between lamb growth traits and adult ewe body weights in western range sheep, J. Anim. Sci., 87, 3506–3514, https://doi.org/10.2527/jas.2008-1622, 2009.
Brito, L. F., McEwan, J. C., Miller, S., Bain, W., Lee, M., Dodds, K., Newman, S.-A., Pickering, N., Schenkel, F. S., and Clarke, S.: Genetic parameters for various growth, carcass and meat quality traits in a New Zealand sheep population, Small Rumin. Res., 154, 81–91, https://doi.org/10.1016/j.smallrumres.2017.07.011, 2017.
Calo, L. L., McDowell, R. E., van Dale Vleck, L., and Miller, P. D.: Genetic aspects of beef production among Holstein-Friesians pedigree selected for milk production, J. Anim. S., 37, 676–682, https://doi.org/10.2527/jas1973.373676x, 1973.
Chagunda, M. G. G.: Opportunities and challenges in the use of the Laser Methane Detector to monitor enteric methane emissions from ruminants, Animal, 7, 394–400, https://doi.org/10.1017/S1751731113000724, 2013.
Chagunda, M. G. G. and Yan, T.: Do methane measurements from a laser detector and an indirect open-circuit respiration calorimetric chamber agree sufficiently closely?, Anim. Feed Sci. Technol., 165, 8–14, https://doi.org/10.1016/j.anifeedsci.2011.02.005 2011.
Chagunda, M. G. G., Römer, D. A. M., and Roberts, D. J.: Effect of genotype and feeding regime on enteric methane, non-milk nitrogen and performance of dairy cows during the winter feeding period, Livest. Sci., 122, 323–332, https://doi.org/10.1016/j.livsci.2008.09.020, 2009a.
Chagunda, M. G. G., Ross, D., and Roberts, D. J.: On the use of a laser methane detector in dairy cows, Comput. Electron. Agr., 68, 157–160, https://doi.org/10.1016/j.compag.2009.05.008, 2009b.
Ellison, M. J., Conant, G. C., Lamberson, W. R., Cockrum, R. R., Austin, K. J., Rule, D. C., and Cammack, K. M.: Diet and feed efficiency status affect rumen microbial profiles of sheep, Small Rumin. Res., 156, 12–19, https://doi.org/10.1016/j.smallrumres.2017.08.009, 2017.
Gernand, E. and Lenz, H.: Using of ultrasound for estimation of carcass composition and prediction of breeding value for sheep, Arch. Anim. Breed., 48, 174–184, https://doi.org/10.5194/aab-48-174-2005, 2005.
Gernand, E., Wassmuth, R., Lenz, H., von Borstel, U. U., Gauly, M., and König, S.: Impact of energy supply of ewes on genetic parameters for fertility and carcass traits in Merino Long Wool sheep, Small Rumin. Res., 75, 80–89, https://doi.org/10.1016/j.smallrumres.2007.09.004, 2008.
Hegarty, R. S., Goopy, J. P., Herd, R. M., and McCorkell, B.: Cattle selected for lower residual feed intake have reduced daily methane production, J. Anim. Sci., 85, 1479–1486. https://doi.org/10.2527/jas.2006-236, 2007.
Henderson, G., Cox, F., Ganesh, S., Jonker, A., Young, W., and Janssen, P. H.: Rumen microbial community composition varies with diet and host, but a core microbiome is found across a wide geographical range, Sci. Rep., 5, 14567, https://doi.org/10.1038/srep14567, 2015.
Huhtanen, P., Cabezas-Garcia, E. H., Utsumi, S., and Zimmerman, S.: Comparison of methods to determine methane emissions from dairy cows in farm conditions, J. Dairy Sci., 98, 3394–3409, https://doi.org/10.3168/jds.2014-9118, 2015.
Johnson, D. E. and Ward, G. M.: Estimates of animal methane emissions, Environ. Monit. Assess., 42, 133–141, https://doi.org/10.1007/BF00394046, 1996.
Johnson, K. A. and Johnson, D. E.: Methane Emissions from Cattle, J. Anim. Sci., 73, 2483–2492, https://doi.org/10.2527/1995.7382483x, 1995.
Jonker, A., Hickey, S. M., Rowe, S. J., Janssen, P. H., Shackell, G. H., Elmes, S., Bain, W. E., Wing, J., Greer, G. J., Bryson, B., MacLean, S., Dodds, K. G., Pinares-Patiño, C. S., Young, E. A., Knowler, K., Pickering, N. K., and McEwan, J. C.: Genetic parameters of methane emissions determined using portable accumulation chambers in lambs and ewes grazing pasture and genetic correlations with emissions determined in respiration chambers, J. Anim. Sci., 96, 3031–3042, https://doi.org/10.1093/jas/sky187, 2018.
Kabreab, E., Clark, K., Wagner-Riddle, C., and France, J.: Methane and nitrous oxide emissions from Canadian animal agriculture: A review, Can. J. Anim. Sci., 86, 135–158, https://doi.org/10.4141/A05-010, 2006
Kandel, P. B., Vanrobays, M.-L., Vanlierde, A., Dehareng, F., Froidmont, E., Gengler, N., and Soyeurt, H.: Genetic parameters of mid-infrared methane predictions and their relationships with milk production traits in Holstein cattle, J. Dairy Sci., 100, 5578–5591, https://doi.org/10.3168/jds.2016-11954, 2017.
Knapp, J. R., Laur, G. L., Vadas, P. A., Weiss, W. P., and Tricarico, J. M.: Invited review: Enteric methane in dairy cattle production: Quantifying the opportunities and impact of reducing emissions, J. Dairy Sci., 97, 3231–3261, https://doi.org/10.3168/jds.2013-7234, 2014.
König, S., Simianer, H., and Willam, A.: Economic evaluation of genomic breeding programs, J. Dairy Sci., 92, 382–391, https://doi.org/10.3168/jds.2008-1310, 2009.
Lawrence, T. L. J. and Fowler, F. R.: Tissues: Basic structure and growth, in: Growth of farm animals, 2nd Edn., CABI Publishing, Wallingford, UK, 39–40, 2002.
Madsen, P. and Jensen, J.: A User's Guide to DMU, A Package for Analysing Multivariate Mixed Models, Version 6, release 5.2, 2013.
Manzanilla-Pech, C. I. V., de Haas, Y., Hayes, B. J., Veerkamp, R. F., Khansefid, M., Donoghue, K. A., Arthur, P. F., and Pryce, J. E.: Genomewide association study of methane emissions in Angus beef cattle with validation in dairy cattle, J. Anim. Sci., 94, 4151–4166, 2016.
Murray, R. M., Bryant, A. M., and Leng, R. A.: Rates of production of methane in the rumen and large intestine of sheep, Br. J. Nutr., 36, 1–14, https://doi.org/10.1079/BJN19760053, 1976.
Paganoni, B., Rose, G., Macleay, C., Jones, C., Brown, D. J., Kearney, G., Ferguson, M., and Thompson, A. N.: More feed efficient sheep produce less methane and carbon dioxide when eating high-quality pellets, J. Anim. Sci., 95, 3839–3850, https://doi.org/10.2527/jas2017.1499, 2017.
Pankey, C. L., Walton, M. W., Odhiambo, J. F., Smith, A. M., Ghnenis, A. B., Nathanielsz, P. W., and Ford, S. P.: Intergenerational impact of maternal overnutrition and obesity throughout pregnancy in sheep on metabolic syndrome in grandsons and granddaughters, Domest. Anim. Endocrinol., 60, 67–74, https://doi.org/10.1016/j.domaniend.2017.04.002, 2017.
Peel, R. K., Eckerle, G. J., and Anthony, R. V.: Effects of overfeeding naturally-mated adolescent ewes on maternal, fetal, and postnatal lamb growth, J. Anim. Sci., 90, 3698–3708, https://doi.org/10.2527/jas.2012-5140, 2012.
Pickering, N. K., Chagunda, M. G. G., Banos, G., Mrode, R., McEwan, J. C., and Wall, E.: Genetic parameters for predicted methane production and laser methane detector measurements, J. Anim. Sci., 93, 11–20, https://doi.org/10.2527/jas.2014-8302, 2015.
Pinares-Patiño, C. S., Ebrahimi, S. H., McEwan, J. C., Dodds, K. G., Clark, H., and Luo, D.: Is rumen retention time implicated in sheep differences in methane emission?, Proc. New Zeal. Soc. An., 71, 219–222, https://doi.org/10.13140/2.1.3309.5043, 2011.
Pinares-Patiño, C. S., Hickey, S. M., Young, E. A., Dodds, K. G., MacLean, S., Molano, G., Sandoval, E., Kjestrup, H., Harland, R., Hunt, C., Pickering, N. K., and McEwan, J. C.: Heritability estimates of methane emissions from sheep, Animal, 7, 316–321, https://doi.org/10.1017/S1751731113000864, 2013.
R Development Core Team: A language and environment for statistical computing, R Foundation for Statistical Computing, Vienna, Austria, available at: http://www.R-project.org, last access: 12 November 2016.
Ricci, P., Chagunda, M. G. G., Rooke, J., Houdijk, J. G. M., Duthie, C.-A., Hyslop, J., Roehe, R., and Waterhouse, A.: Evaluation of the laser methane detector to estimate methane emissions from ewes and steers, J. Anim. Sci., 92, 5239–5250, https://doi.org/10.2527/jas.2014-7676, 2014.
Robinson, D. L. and Oddy, V. H.: Benefits of including methane measurements in selection strategies, J. Anim. Sci., 94, 3624–3635, https://doi.org/10.2527/jas.2016-0503, 2016.
Rösler, R., Chefor, F., and Schlecht, E.: Using a portable laser methane detector in goats to assess diurnal, diet- and position-dependent variations in enteric methane emissions, Comput. Electron. Agr., 150, 110–117, https://doi.org/10.1016/j.compag.2018.04.010, 2018.
Russel, A. J. F., Doney, J. M., and Gunn, R. G.: Subjective assessment of body fat in live sheep, J. Agr. Sci., 72, 451–454, https://doi.org/10.1017/S0021859600024874, 1969.
SAS Institute Inc.: SAS® Studio 3.71, User's Guide: SAS Institute, Inc., Cary, NC, USA, 2017.
Shi, W., Moon, C. D., Leahy, S. C., Kang, D., Froula, J., Kittelmann, S., Fan, C., Deutsch, S., Gagic, D., Seedorf, H., Kelly, W. K., Atua, R., Sang, C., Soni, P., Li, D., Pinares-Patiño, C. S., McEwan, J. C., Janssen, P. H., Chen, F., Visel, A., Wang, Z., Attwood, G. T., and Rubin, E. M.: Methane yield phenotypes linked to differential gene expression in the sheep rumen microbiome, Genome Res., 24, 1517–1525, https://doi.org/10.1101/gr.168245.113, 2014.
Silva, S. R., Afonso, J. J., Santos, V. A., Monteiro, A., Guedes, C. M., Azevedo, J. M. T., and Dias-da-Silva, A.: In vivo estimation of sheep carcass composition using real-time ultrasound with two probes of 5 and 7.5 MHz and image analysis, J. Anim. Sci., 84, 3433–3439, https://doi.org/10.2527/jas.2006-154, 2006.
Tokyo Gas Engineering Co. Ltd.: SA3C50A LaserMethane mini-G Operation Manual First Edition, Tokyo Gas Engineering Co. Ltd., Tokyo, Japan, 2013.
Weston, R. H.: Some aspects of constraint to forage consumption by ruminants, Aust. J. Agr. Res., 47, 175–197, https://doi.org/10.1071/AR9960175, 1996.
Wu, L., Koerkamp, P. W. G. G., and Ogink, N.: Uncertainty assessment of the breath methane concentration method to determine methane production of dairy cows, J. Dairy Sci., 101, 1554–1564, https://doi.org/10.3168/jds.2017-12710, 2018.
Yin, T., Pinent, T., Brügemann, K., Simianer, H., and König, S.: Simulation, prediction, and genetic analyses of daily methane emissions in dairy cattle, J. Dairy Sci., 98, 5748–5762, https://doi.org/10.3168/jds.2014-8618, 2015.
Zetouni, L., Kargo, M., Norberg, E., and Lassen, J.: Genetic correlations between methane production and fertility, health, and body type traits in Danish Holstein cows, J. Dairy Sci., 101, 2273–2280, https://doi.org/10.3168/jds.2017-13402, 2018.