
the Creative Commons Attribution 4.0 License.
the Creative Commons Attribution 4.0 License.
 | 18 Nov 2026
Metabolic adaptations from late gestation to early postpartum in dairy sheep: integration of plasma biochemistry and untargeted metabolomics
Shuai Jiao
Yongheng Man
Tianxi Zhang
Tao Wang
Xiyun Zhang
Pengshan Zhao
Long Guo
Zhiyuan Ma
Xiuxiu Weng
Fei Li

Metabolic adaptations during the transition period, which encompasses approximately the last 3 weeks of gestation and the first 3 weeks postpartum, have been extensively investigated in dairy cows. However, corresponding information in dairy sheep remains limited, particularly at the metabolome level. This study aimed to characterize metabolic adaptations occurring from late gestation (LG) to early postpartum (EP) in dairy sheep by integrating plasma biochemical indicators, mineral profiles, and untargeted metabolomics. Paired blood samples were collected from the same 10 healthy dairy ewes during LG (21 d before parturition) and EP (1 d after parturition). Compared with LG, EP ewes had lower concentrations of high-density lipoprotein (HDL), albumin (ALB), calcium (Ca), phosphorus (P), and iron (Fe), higher immunoglobulin M (IgM) concentrations, and higher activities of aspartate aminotransferase (AST), lactate dehydrogenase (LDH), superoxide dismutase (SOD), and glutathione peroxidase (GSH-Px) (P < 0.05). Untargeted metabolomics identified 85 differential metabolites, including 53 upregulated and 32 downregulated metabolites in EP relative to LG. Among the metabolite classes identified, lipids and lipid-like molecules were predominant, accounting for 78.2 % of all differential metabolites. Pathway enrichment analysis further showed that these metabolic adaptations were primarily associated with lipid metabolism, particularly glycerophospholipid metabolism, linoleic acid metabolism, α-linolenic acid metabolism, and arachidonic acid metabolism. Within the glycerophospholipid pathway, lysophosphatidylcholine species were generally decreased, whereas phosphatidylethanolamine species were increased during the postpartum period. Network analysis further identified five hub lipid metabolites that formed a highly interconnected metabolic cluster. Metabolite set enrichment analysis indicated a significant downregulation of the biosynthesis of unsaturated fatty acids pathway in EP ewes. In conclusion, integrated biochemical and metabolomic analyses revealed that lipid metabolic remodeling, particularly within glycerophospholipid metabolism, is a prominent feature of the transition from LG to EP in dairy ewes.
- Article
(4282 KB) - Full-text XML
-
Supplement
(421 KB) - BibTeX
- EndNote


The periparturient period, encompassing late gestation (LG) and early postpartum (EP), represents a critical stage of physiological and metabolic adaptation in dairy ruminants (Drackley, 1999). During LG, rapid fetal growth substantially increases maternal nutrient and glucose requirements, whereas parturition and the initiation of milk production further elevate demands for energy, amino acids, and lipids (Bell, 1995; McFadden, 2020). To accommodate these changing requirements, animals undergo coordinated metabolic adjustments characterized by nutrient repartitioning, mobilization of body reserves, endocrine adaptations, and enhanced hepatic gluconeogenesis (Ingvartsen and Andersen, 2000). These responses are generally considered normal physiological adaptations that support the transition from pregnancy to the postpartum state. However, when metabolic adjustments are insufficient or excessive, disturbances in energy metabolism and immune function may arise, increasing susceptibility to metabolic and infectious disorders during the periparturient period (Ha et al., 2017; Trevisi and Minuti, 2018). Therefore, a better understanding of metabolic adaptations during this transition is important for improving animal health, welfare, and productivity.
Conventional blood biochemical indicators, including glucose, non-esterified fatty acids (NEFA), β-hydroxybutyrate (BHB), and triglycerides, are widely used to evaluate the metabolic status of dairy ruminants during the periparturient period (Ingvartsen and Andersen, 2000). These parameters provide valuable information on energy balance, liver function, and nutritional status. However, because they represent downstream physiological outcomes, they provide only limited insight into the underlying metabolic pathways involved in the adaptive response to parturition. Metabolomics has emerged as a powerful tool for the comprehensive profiling of small-molecule metabolites, enabling pathway-level characterization of metabolic alterations (Wishart, 2019). Both targeted and untargeted metabolomic strategies have been successfully applied to investigate alterations in amino acid, carbohydrate, lipid, and bile acid metabolism during physiological and pathological transitions in ruminants (Imhasly et al., 2015). Consequently, integrating conventional biochemical measurements with metabolomic profiling can provide complementary information on both physiological status and metabolic pathway activity, allowing a more comprehensive assessment of metabolic adaptation during. parturition. Recent metabolomic and multi-omics studies in ruminants have further demonstrated the value of this integrative approach for improving our understanding of metabolic physiology, and supporting nutritional and health management strategies (Jiao et al., 2025; Yang et al., 2022).
Although metabolic adaptations during the periparturient period have been extensively investigated in dairy cows, corresponding information in dairy sheep remains relatively limited. Most available studies in dairy sheep have focused on a restricted set of biochemical indicators, such as energy metabolites, mineral concentrations, or liver function enzymes, providing only a partial view of the metabolic adaptations occurring during parturition. For example, alterations in circulating biochemical parameters during the periparturient period have been reported in Lacaune ewes, but the underlying metabolic pathways remain poorly characterized (Chagas et al., 2023). Untargeted metabolomics has been successfully applied to characterize metabolic alterations during the transition period in dairy cows (Luo et al., 2019), demonstrating its utility for identifying pathway-level metabolic adaptations. However, dairy sheep differ substantially from dairy cows in terms of body size, energy reserves, prolificacy, and lactational characteristics. These physiological differences may influence nutrient partitioning, metabolic flexibility, and susceptibility to metabolic disorders during the periparturient period, limiting the direct extrapolation of bovine findings to dairy sheep (Pesántez-Pacheco et al., 2019). Therefore, dedicated studies are needed to characterize species-specific metabolic adaptations in dairy sheep during the transition from LG to EP.
We hypothesized that the transition from LG to EP in dairy ewes would be accompanied by coordinated alterations in circulating biochemical characteristics and the plasma metabolome. Therefore, this study aimed to compare plasma biochemical, immune and antioxidant, and mineral profiles between 21 d before parturition and 1 d postpartum in the same dairy ewes, and to identify the differential plasma metabolites and metabolic pathways associated with this physiological transition using untargeted metabolomics.
2.1 Experimental design and sample collection
The experiment was conducted at the Yuansheng First Ecological Ranch (Gansu Yuansheng Agricultural Technology Co., Ltd.) located in Yongchang County, Gansu Province, China (38°27′ N, 102°07′ E). The experimental animals were crossbred dairy ewes produced by mating East Friesian rams with Hu ewes. A total of 122 dairy ewes were monitored throughout the periparturient period. Lambing dates and related production records were collected for all animals. Blood samples were obtained during the study period, and the physiological stage corresponding to each sampling event was retrospectively determined according to the actual lambing date of each ewe, assuming an average gestation length of approximately 150 d. To establish a paired dataset representing LG and EP, ewes were retrospectively screened for the availability of plasma samples collected at approximately 21 d before parturition and 1 d after parturition. To minimize biological variation unrelated to physiological stage, only clinically healthy ewes with a parity of 2, twin pregnancies, similar postpartum body weight (90.55 ± 3.28 kg), and comparable lamb birth weight (3.75 ± 0.95 kg) were included. Based on these criteria, 10 ewes were selected for subsequent analyses. For these selected animals, paired plasma samples representing LG (21 d before parturition) and EP (1 d after parturition) were used for biochemical, mineral, and metabolomic analyses. All blood samples were collected before the morning feeding. During the experimental period, all ewes were group-housed in naturally ventilated indoor pens with earthen floors, with approximately 40 ewes per pen, under the same management conditions. Each pen was connected to an outdoor exercise yard that the ewes could access freely, and the housing areas were regularly cleaned and disinfected. Ewes were fed the same total mixed ration (TMR; Table 1) twice daily at 07:00 and 18:00 h (China Standard Time, UTC+8) to allow ad libitum intake. Jugular blood was collected into EDTA-containing vacuum tubes at 07:00 h (China Standard Time, UTC+8). Blood samples were transported immediately for processing and centrifuged within 30 min of collection at 3000 × g for 15 min at 4 °C. The harvested plasma was immediately snap-frozen in liquid nitrogen and stored at −80 °C until analysis.
Table 1Ingredient and chemical composition of experiment diets.
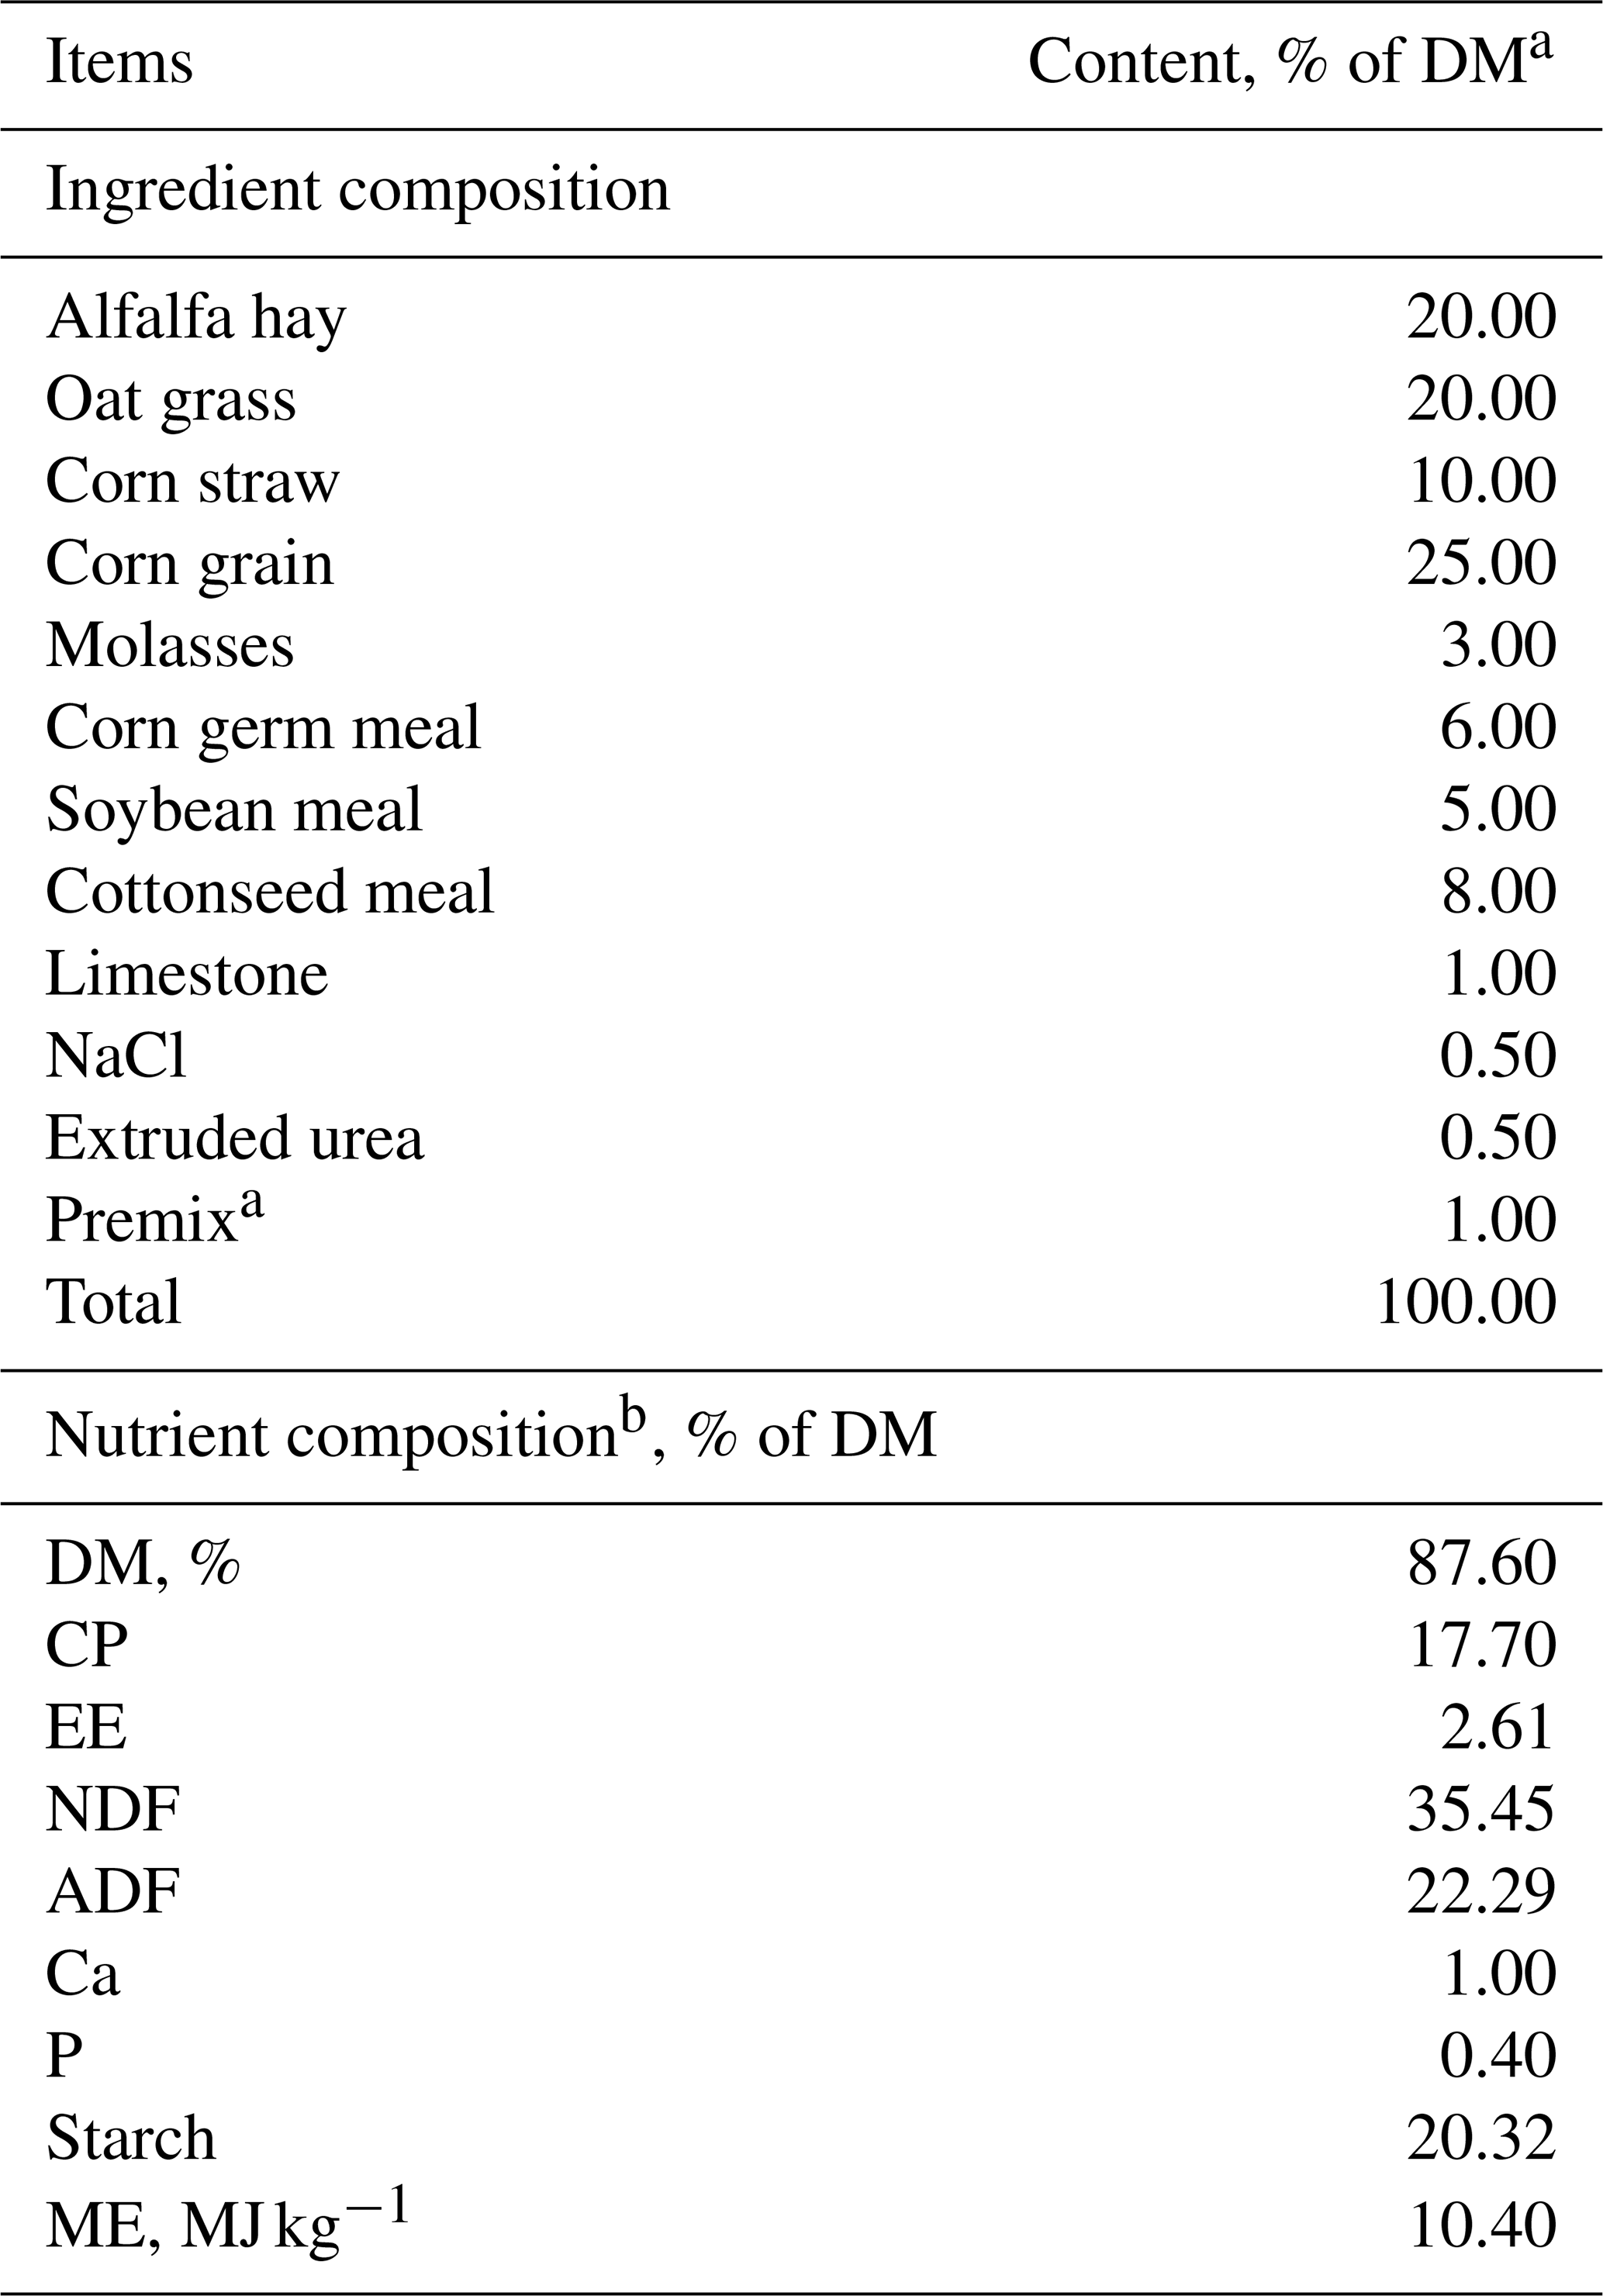
a Premix provided per kg of premix: vitamin A, 100 000 IU; vitamin D, 30 000 IU; vitamin E, 500 IU; Fe, 1500 mg; Zn, 2000 mg; Mn, 1000 mg; Cu, 800 mg; Se, 8 mg; Co, 8 mg; I, 15 mg. b DM = dry matter, CP = crude protein, EE = ether extract, NDF = neutral detergent fiber, ADF = acid detergent fiber, Ca = calcium, P = phosphorus, ME = metabolizable energy.
2.2 Plasma parameter measurement
Plasma biochemical parameters were determined using an automatic biochemical analyzer (Mindray BS-420; Shenzhen Mindray Biomedical Electronics Co., Ltd., Shenzhen, China) according to previously described procedures (Jiao et al., 2025). Concentrations of total protein (TP), blood urea nitrogen (BUN), creatinine (CREA), glucose (GLU), total cholesterol (TC), high-density lipoprotein (HDL), low-density lipoprotein (LDL), triglycerides (TG), cholinesterase (ChE), albumin (ALB), alanine aminotransferase (ALT), aspartate aminotransferase (AST), total bilirubin (TBIL), creatine kinase (CK), alkaline phosphatase (ALP), and lactate dehydrogenase (LDH) were measured using commercial assay kits (Zhongsheng Beikong Bio-Technology and Science Inc., Beijing, China). Plasma BHB was quantified using a WST-1 coupled enzymatic assay based on BHB dehydrogenase-mediated reduced nicotinamide adenine dinucleotide (NADH) formation, with the resulting formazan product measured at 450 nm. NEFA was quantified using an ACS-ACOD enzymatic colorimetric assay, in which NEFA are sequentially converted to acyl-coenzyme A (acyl-CoA) and oxidized to generate H2O2 for colorimetric detection. Concentrations of immunoglobulin A (IgA), immunoglobulin G (IgG), and immunoglobulin M (IgM) were measured using commercial kits (Beijing SINO-UK Institute of Biological Technology, Beijing, China). Oxidative stress and antioxidant indices, including total antioxidant capacity (T-AOC), superoxide dismutase (SOD), catalase (CAT), glutathione peroxidase (GSH-Px), and malondialdehyde (MDA), were determined using commercial kits (Nanjing Jiancheng Bioengineering Institute, Nanjing, China) according to the manufacturers' instructions.
2.3 Plasma mineral determination
Plasma mineral concentrations were determined by inductively coupled plasma optical emission spectrometry (ICP-OES; 5800 ICP-OES, Agilent Technologies Inc., Santa Clara, CA, USA). Briefly, thawed plasma samples (1 mL) were digested with 6 mL nitric acid and 2 mL hydrogen peroxide using a microwave digestion system (Tank 40, Xinyi Microwave Chemical Technology Co., Ltd., Shanghai, China). Digestion was performed by increasing the temperature to 180 °C over 12 min and maintaining it for 10 min. After digestion, excess acid was removed using an acid expeller (BHW-09A45, Botong Chemical Technology Co., Ltd., Shanghai, China). The digested samples were diluted to 50 mL with ultrapure water, filtered through 0.22 µm membranes, and stored at 4 °C prior to analysis. Calibration standards for calcium (Ca), copper (Cu), iron (Fe), potassium (K), magnesium (Mg), sodium (Na), and zinc (Zn) were prepared from a mixed inorganic element reference material (GBW(E)081531; National Institute of Metrology, Beijing, China), whereas phosphorus (P) was quantified using a single-element standard solution (GSB 04-1741-2004; National Center for Analysis and Testing of Nonferrous Metals and Electronic Materials, Beijing, China).
2.4 Non-targeted metabolomics
Plasma samples were thawed on ice, and metabolites were extracted using ice-cold 80 % methanol. Briefly, 100 µL of plasma was mixed with 400 µL of methanol, incubated at −20 °C for 30 min to precipitate proteins, and centrifuged at 20 000 × g for 15 min. The resulting supernatants were collected for ultra-performance liquid chromatography–high-resolution mass spectrometry (UPLC–HRMS) analysis. Quality control (QC) samples were prepared by pooling equal aliquots (15 µL) from each extract. The pooled QC sample was injected at the beginning of the LC–MS run and subsequently after every five study samples to monitor instrument stability and analytical reproducibility throughout the analytical sequence. Chromatographic separation was performed using an UltiMate 3000 UPLC system (Thermo Fisher Scientific, Bremen, Germany) equipped with an ACQUITY UPLC T3 column (100 × 2.1 mm, 1.8 µm; Waters, Milford, MA, USA). Mass spectrometric detection was conducted on a Q Exactive mass spectrometer (Thermo Fisher Scientific, Bremen, Germany) operating in both positive and negative electrospray ionization modes. Raw LC–MS data were converted to mzXML format and processed using the XCMS package for peak detection, retention time correction, and peak alignment (Smith et al., 2006). Subsequent annotation of isotopes and adducts was performed using CAMERA, and data normalization and statistical analyses were conducted using the metaX package in R (Kuhl et al., 2012; Wen et al., 2017). Metabolite features were defined by retention time (RT) and mass-to-charge ratio (). Metabolite annotation was performed against the Kyoto Encyclopedia of Genes and Genomes (KEGG) and Human Metabolome Database (HMDB), with annotations accepted when the mass error was ≤ 10 ppm.
2.5 Statistical analysis
Statistical analyses of plasma biochemical parameters, mineral concentrations, and antioxidant indices were performed using GraphPad Prism 8.0 (GraphPad Software Inc., La Jolla, CA, USA). Because measurements were obtained from the same ewes during LG and EP, the data were analyzed as paired observations. Normality of the within-ewe differences between EP and LG was assessed using the Shapiro–Wilk test, and all variables satisfied the assumption of normality. Therefore, differences between the two physiological stages were evaluated using a paired Student's t-test. The statistical model was expressed as , where Yi and Xi represent the paired observations for ewe i at the two physiological stages, respectively; μ represents the mean paired difference between the two stages; and ϵi represents the random error. The null hypothesis was H0: μ = 0. Statistical significance was declared at P < 0.05.
Statistical analyses of untargeted metabolomics data were performed using R software (version 4.0.0). Partial least squares-discriminant analysis (PLS-DA) and orthogonal partial least squares-discriminant analysis (OPLS-DA) were conducted using the metaX package to evaluate metabolic differences between LG and EP, and were visualized using the ggplot2 package. Model validity and the risk of overfitting were assessed using 200 permutation tests, in which the class labels were randomly permuted and the resulting R2 and Q2 values were compared with those of the original models. Negative Q2 intercepts in the permutation tests were considered evidence that the observed group separation was unlikely to result from model overfitting. Differential metabolites were identified based on a variable importance in projection (VIP) score > 1 and a paired Student's t-test (P < 0.05). Metabolites with log2 fold change (log2FC) > 0 were considered upregulated, whereas those with log2FC < 0 were considered downregulated. Volcano plots were generated based on log2FC and −log10(P) values. Correlation networks of differential metabolites were constructed using Spearman's rank correlation analysis in the Hmisc package (version 4.6.0), and significant correlations (|r| > 0.70 and adjusted P < 0.05) were visualized using Cytoscape (version 3.8.2). KEGG pathway enrichment analysis was performed using a hypergeometric test, and pathways with P < 0.05 were considered significantly enriched. Hierarchical clustering analysis and heatmap visualization were performed using the pheatmap package in R. Metabolite set enrichment analysis (MSEA) was conducted based on the abundance profiles of all detected metabolites, and pathway significance was determined by permutation testing.
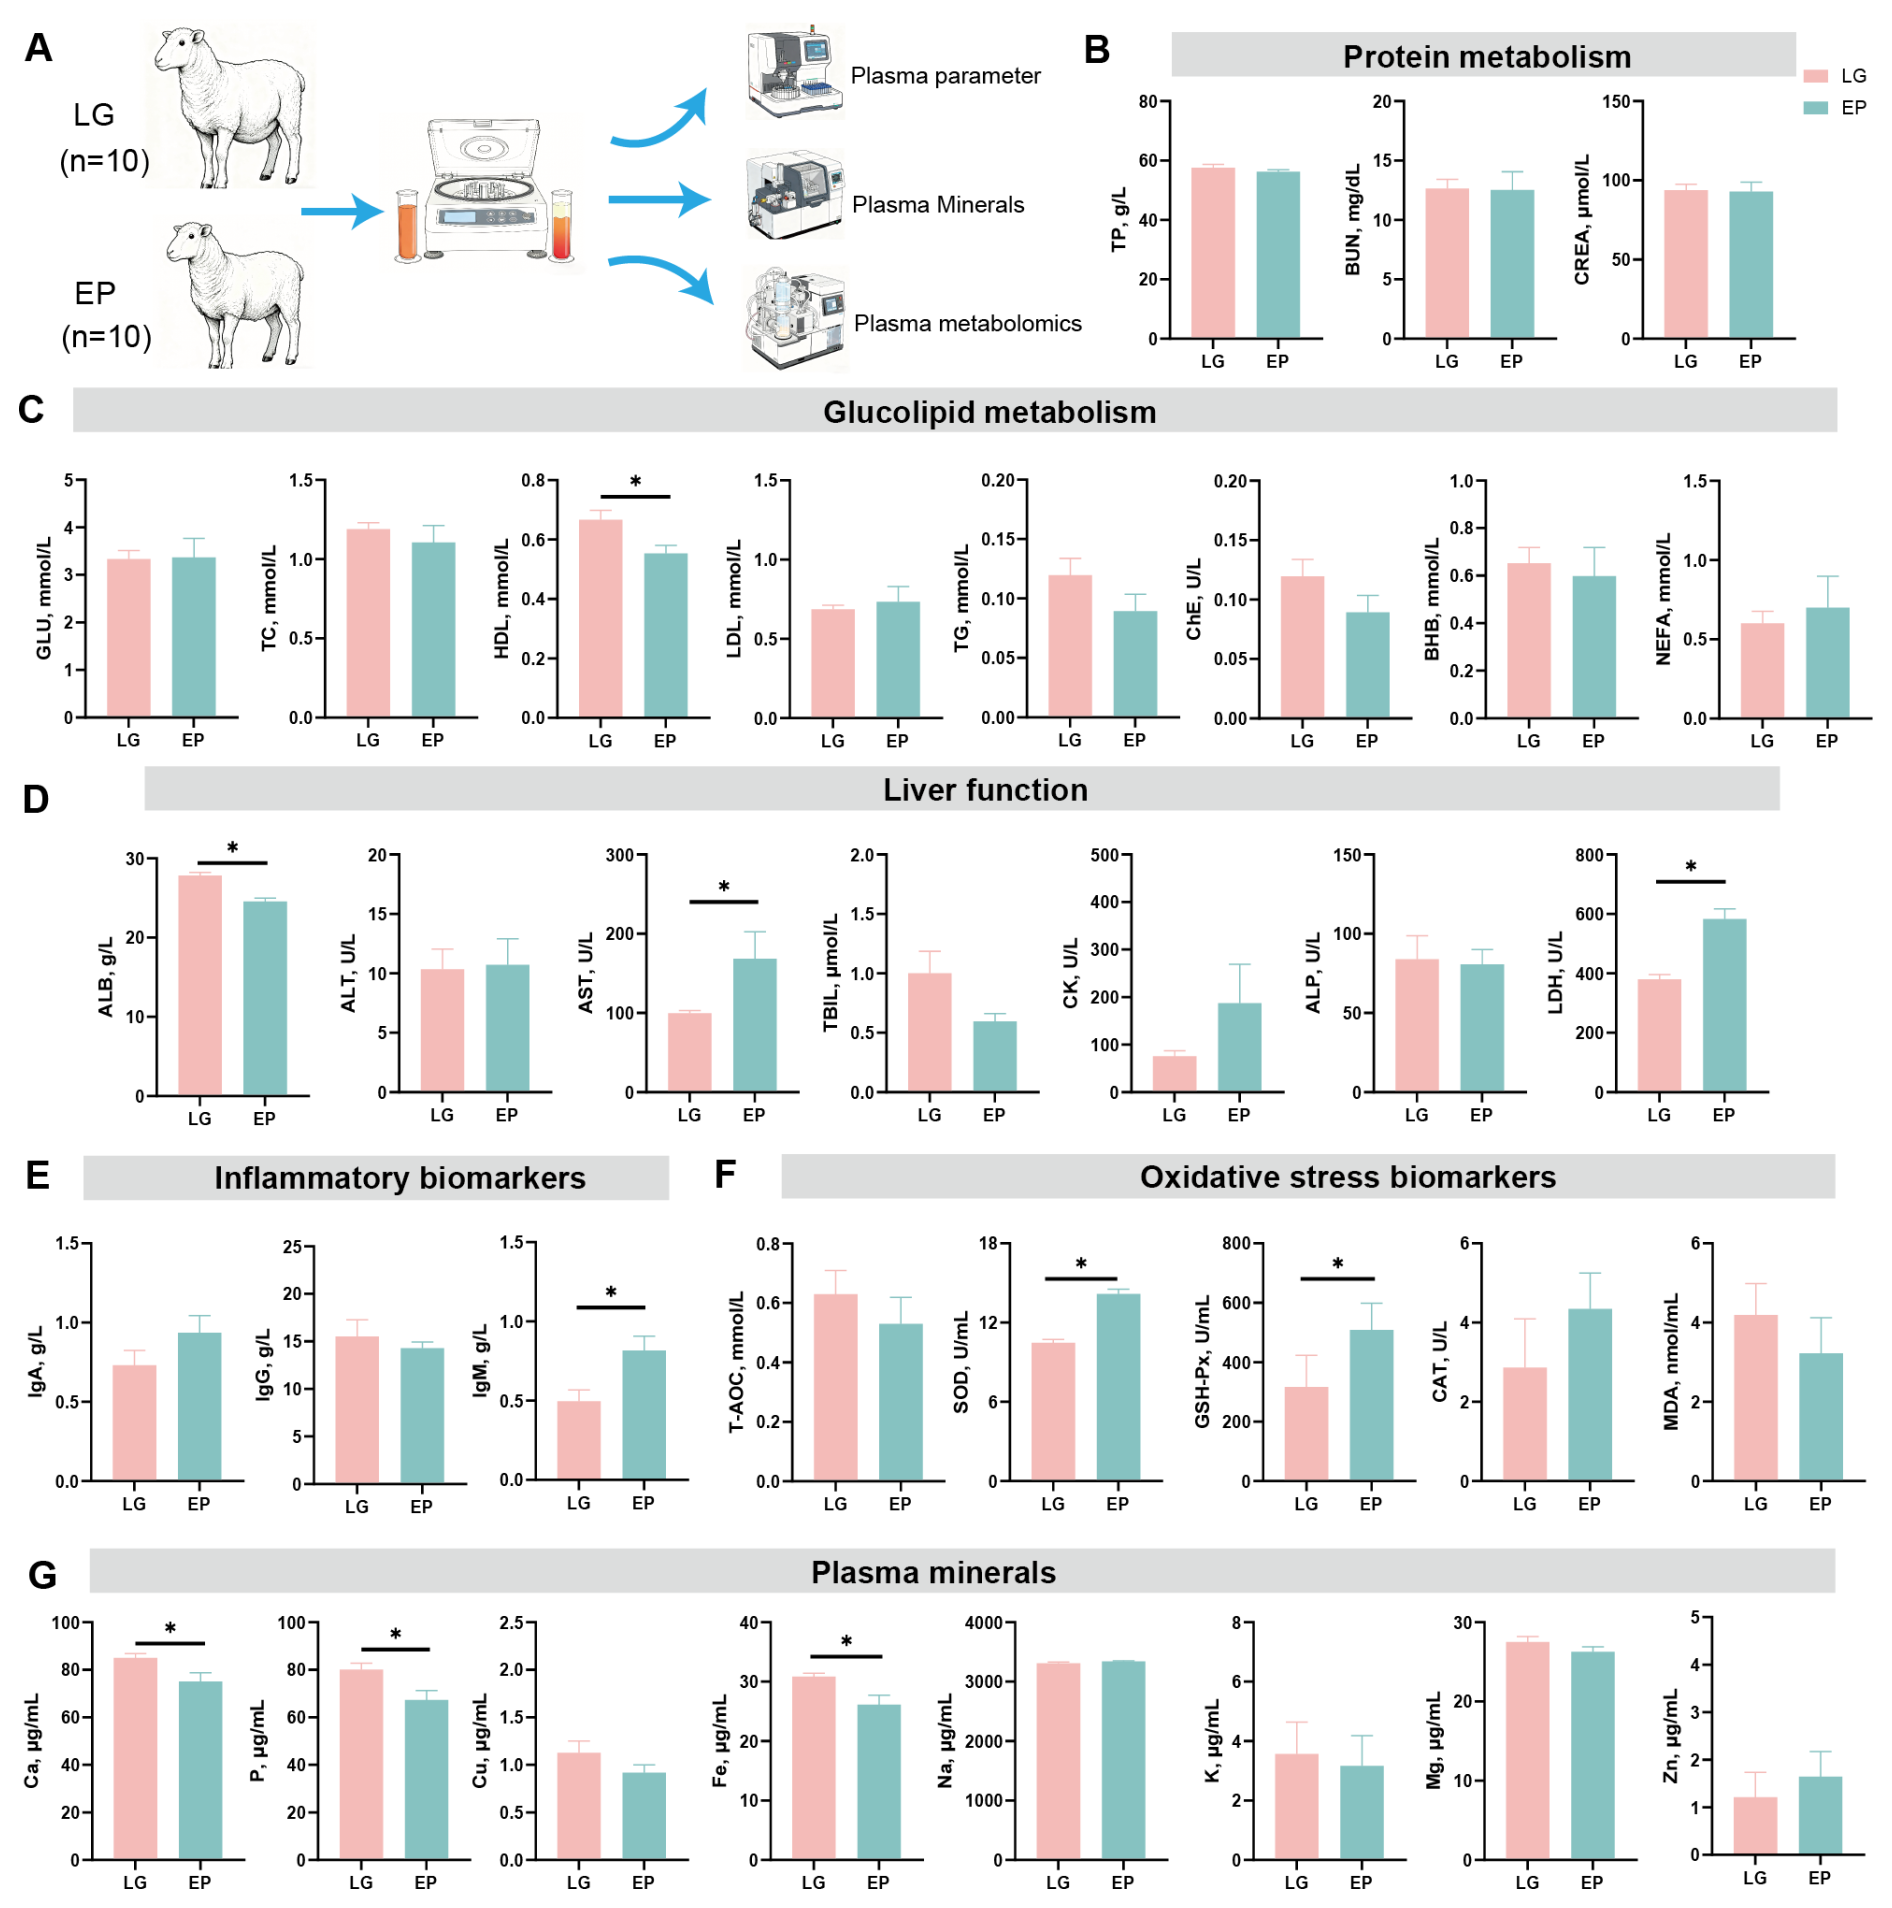
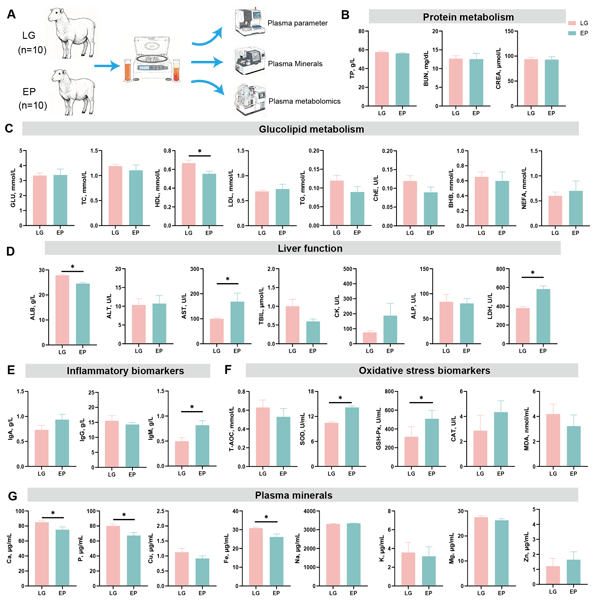
Figure 1Metabolic phenotypes between late gestation (LG) and early postpartum (EP) in dairy ewes. (A) The workflow of this experiment. (B) Protein metabolism. TP, total protein; BUN, blood urea nitrogen; CREA, creatinine. (C) Glucolipid metabolism. GLU, glucose; TC, total cholesterol; HDL, high-density lipoprotein; LDL, low-density lipoprotein; TG, triglyceride; ChE, cholinesterase; BHB, β-hydroxybutyrate; NEFA, non-esterified fatty acids. (D) Liver function. ALB, albumin; ALT, alanine aminotransferase; AST, aspartate aminotransferase; TBIL, total bilirubin; CK, creatine kinase; ALP, alkaline phosphatase; LDH, lactate dehydrogenase. (E) Inflammatory biomarkers. IgA, immunoglobulin A; IgG, immunoglobulin G; IgM, immunoglobulin M. (F) Oxidative stress biomarkers. T-AOC, total antioxidant capacity; SOD, superoxide dismutase; GSH-Px, glutathione peroxidase; CAT, catalase; MDA, malondialdehyde. (G) Plasma minerals. Ca, calcium; P, phosphorus; Cu, copper; Fe, iron; Na, sodium; K, potassium; Mg, magnesium; Zn, zinc. ∗ Significantly different between the two groups (P < 0.05).
3.1 Protein metabolism, glucolipid metabolism, and liver function markers
Plasma biochemical parameters were compared between dairy ewes during LG and EP (Fig. 1A). Indicators of protein metabolism, including TP, BUN, and CREA, were not affected by physiological stage (P > 0.05; Fig. 1B). For glucolipid metabolism, plasma HDL concentration was lower in EP than in LG (P < 0.05; Fig. 1C), whereas GLU, TC, LDL, TG, ChE, BHB, and NEFA remained unchanged (P > 0.05). Among liver-function-related parameters, plasma AST and LDH activities were elevated in EP compared with LG (P < 0.05; Fig. 1D), whereas ALB concentration was reduced (P < 0.05). No differences were detected in ALT, TBIL, CK, or ALP between the two physiological stages (P > 0.05).
3.2 Immunoglobulin concentrations and oxidative stress status
Among the immunological indicators, plasma IgM concentration was higher in EP than in LG (P < 0.05; Fig. 1E), whereas IgA and IgG concentrations were unaffected by physiological stage (P > 0.05). For oxidative-stress-related parameters, activities of SOD and GSH-Px were elevated in EP compared with LG (P < 0.05; Fig. 1F). In contrast, T-AOC, CAT, and MDA concentrations did not differ between the two periods (P > 0.05).
3.3 Plasma mineral profile
Plasma concentrations of eight minerals were measured to evaluate changes in mineral homeostasis across the periparturient period (Fig. 1G). Compared with LG, EP ewes had lower plasma concentrations of Ca, P, and Fe (P < 0.05), whereas Cu, Na, K, Mg, and Zn concentrations remained unchanged (P > 0.05).
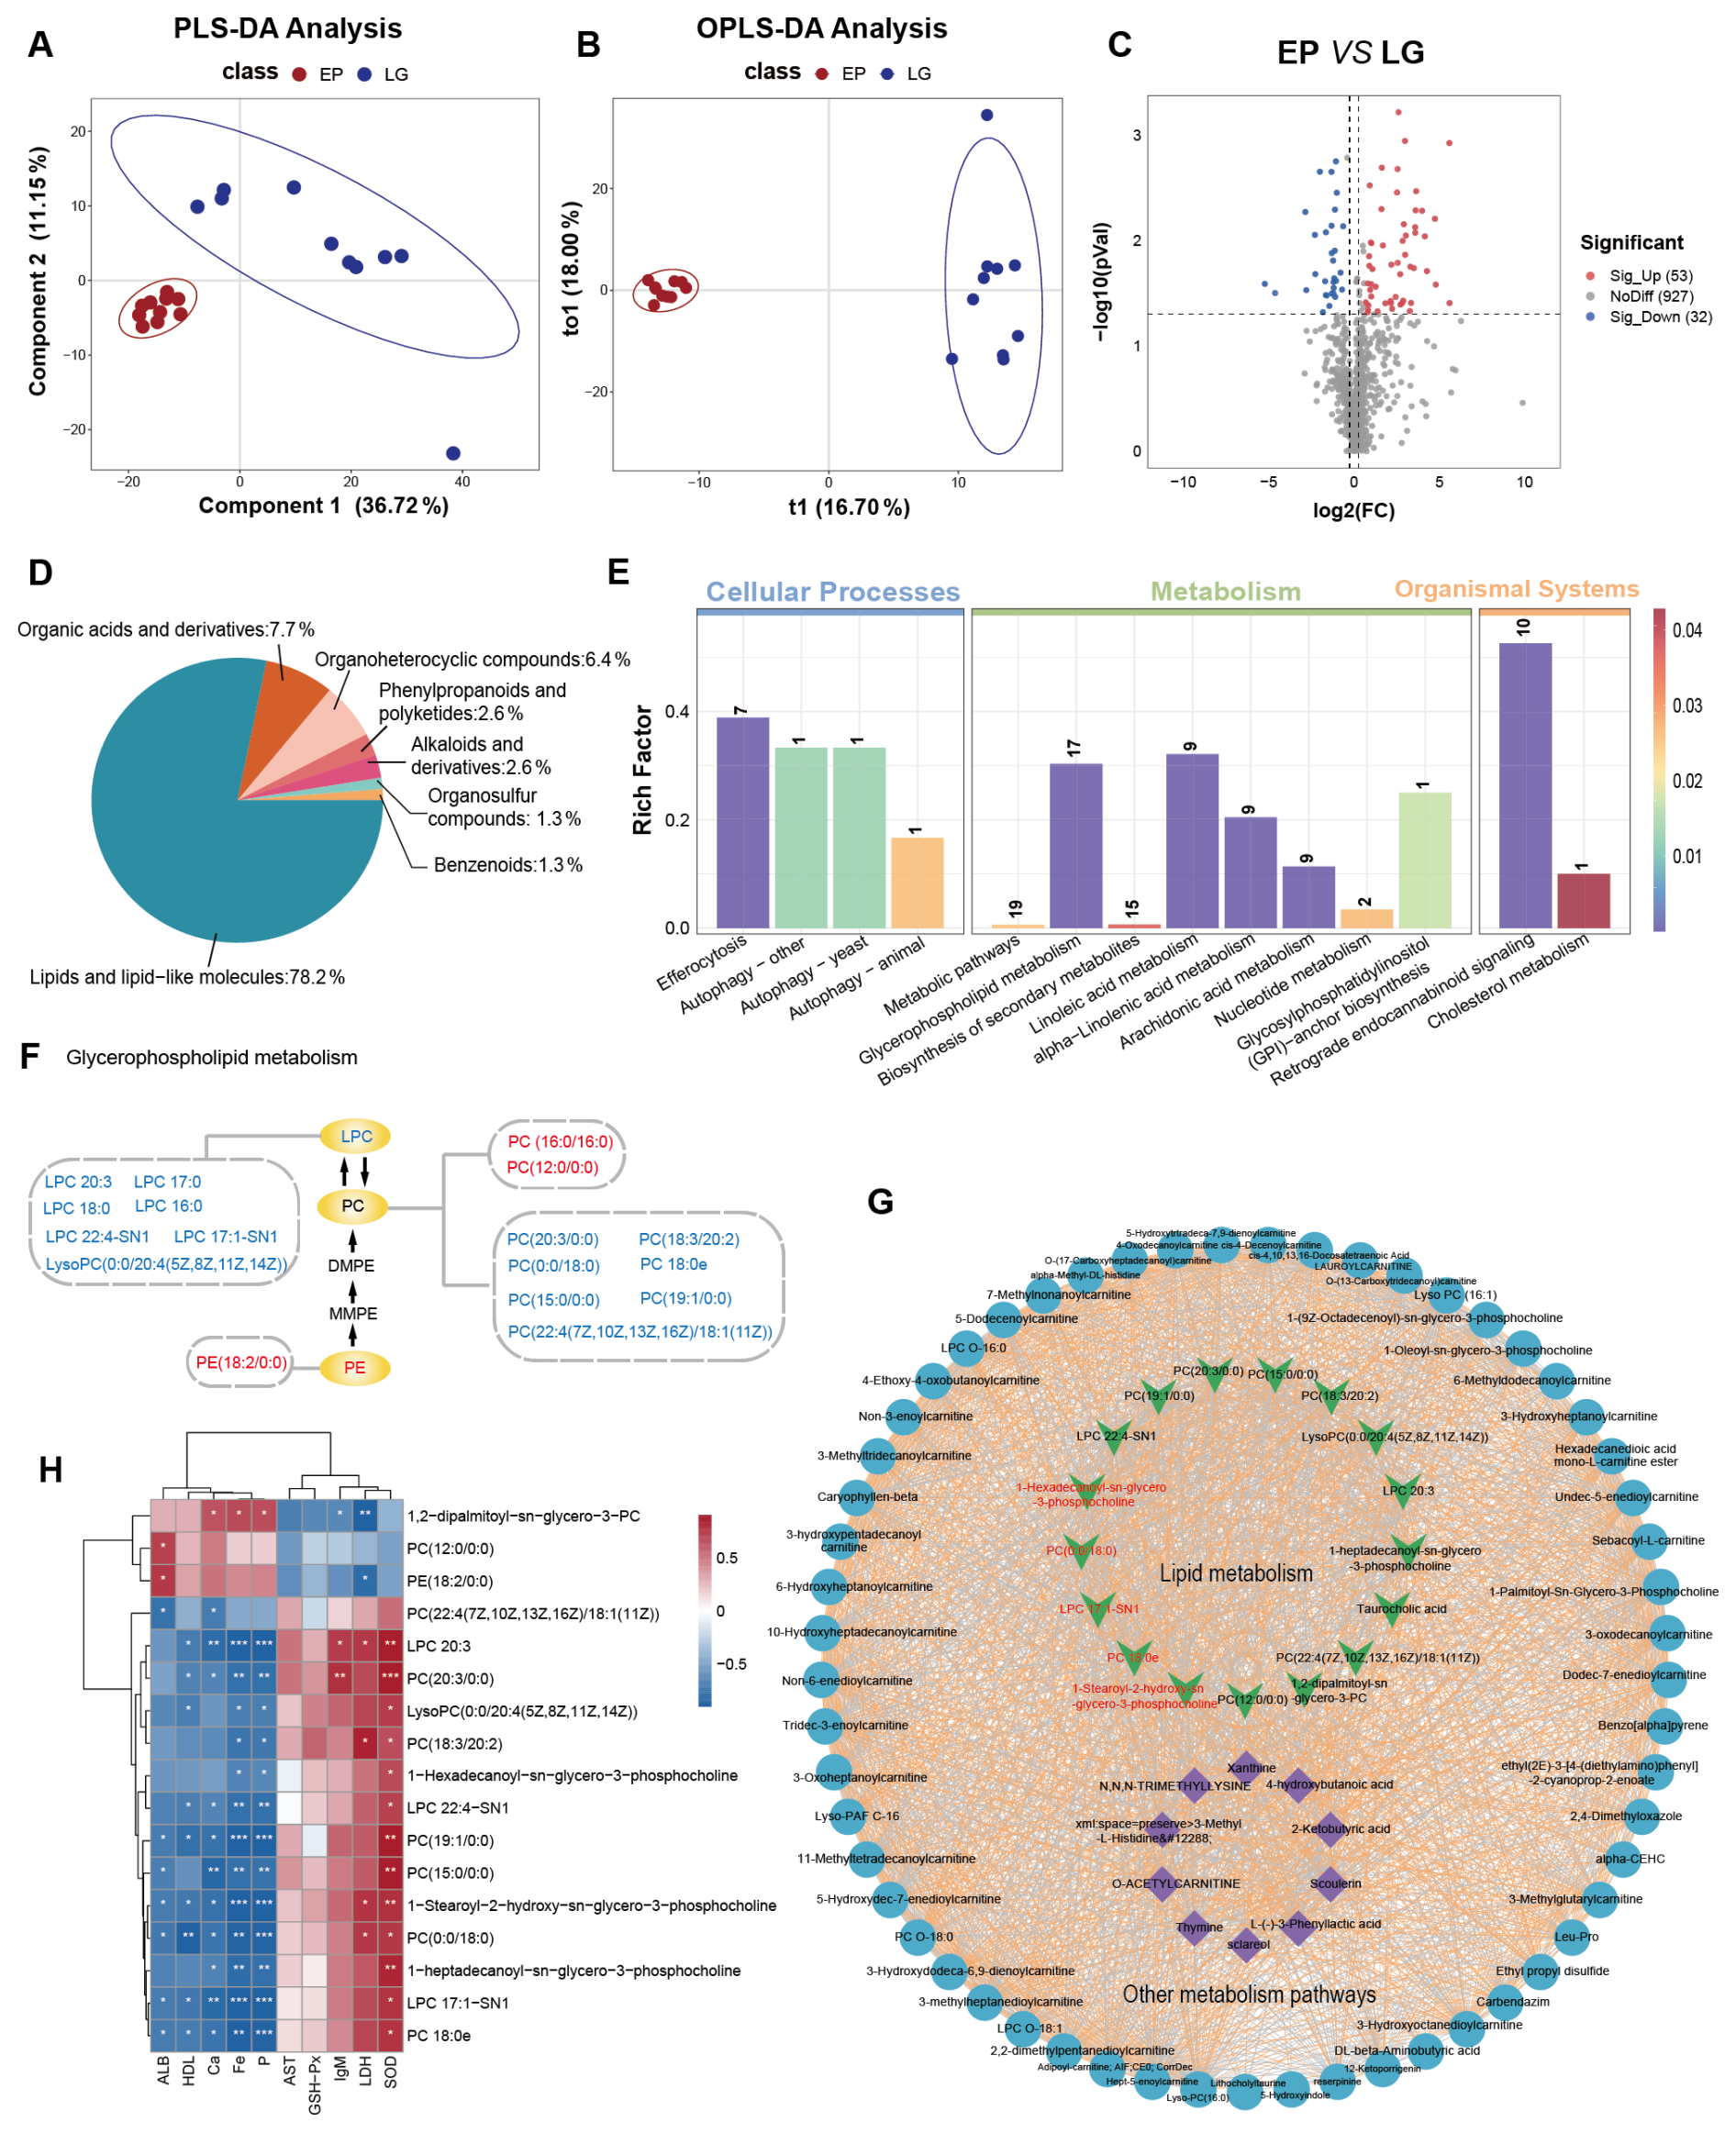
Figure 2Metabolic characteristics between late gestation (LG) and early postpartum (EP) in dairy ewes. (A) Partial least squares-discriminant analysis (PLS-DA) score chart between LG and EP. (B) Orthogonal partial least squares-discriminant analysis (OPLS-DA) score chart between LG and EP. (C) Volcano maps of differential metabolites. (D) Differential metabolite HMDB Super class classification map. (E) KEGG pathway analysis of metabolite differences. (F) The metabolites of glycerophospholipid metabolism pathway. Red labels and upward arrows indicate metabolites that are upregulated, whereas blue labels and downward arrows indicate metabolites that are downregulated. PE, phosphatidylethanolamine; MMPE, monomethyl-phosphatidyl-ethanolamine; DMPE, dimethyl-phosphatidyl-ethanolamine; PC, phosphatidylcholine; LPC, lysophosphatidylcholine. (G) Correlation network in plasma differential metabolites (Spearman's |r| > 0.7 and adjusted P < 0.05). Lines between two nodes represent the correlation, with an orange line indicating a positive correlation and a blue line indicating a negative correlation. (H) The Spearman correlations among the significantly differential physiological parameters and the differential metabolites enriched in lipid metabolism. ∗ indicates P < 0.05, indicates P < 0.01, indicates P < 0.001.

Figure 3Identification of differential metabolites in plasma between late gestation (LG) and early postpartum (EP) in dairy ewes. From the outer to the inner ring: the first layer shows the names of the differential metabolites; the second layer displays the log2FC between the two groups; the third layer represents the absolute values of log2FC using dot size; the fourth layer shows the VIP scores (in red) and P values (in blue); and the innermost layer illustrates the difference in the mean metabolite levels between the two groups, expressed as log2-transformed values and visualized by area size.
3.4 Identification of differential metabolites
Plasma metabolomic profiles were compared between dairy ewes during LG and EP using untargeted LC–MS/MS analysis in both positive and negative ionization modes. After removing redundant ions and low-quality features, a total of 1150 metabolites were retained for subsequent analyses. The robustness of the PLS-DA (R2 intercept = 0.7542, Q2 intercept = −0.6008) and OPLS-DA (R2 intercept = 0.9666, Q2 intercept = −0.1572) models was confirmed by 200 permutation tests, indicating no evidence of model overfitting (Figs. S1 and S2 in the Supplement). Both PLS-DA and OPLS-DA score plots showed a clear separation between LG and EP samples, suggesting distinct plasma metabolic profiles between the two physiological stages (Fig. 2A and B). Based on the criteria of VIP > 1 and P < 0.05, a total of 85 differential metabolites were identified, of which 53 showed higher and 32 showed lower relative abundances in EP compared with LG (Fig. 2C). According to HMDB classification, these metabolites were assigned to seven major chemical categories, including lipids and lipid-like molecules, organic acids and derivatives, organoheterocyclic compounds, phenylpropanoids and polyketides, alkaloids and derivatives, organosulfur compounds, and benzenoids (Fig. 2D). Among these categories, lipids and lipid-like molecules predominated, accounting for 78.2 % of all differential metabolites. The abundance, log2 fold change (log2FC), VIP values, and statistical significance of the differential metabolites are summarized in Fig. 3. Representative metabolites altered during the transition from LG to EP included xanthine, taurocholic acid, Lyso-PC (16:0), and lauroylcarnitine.
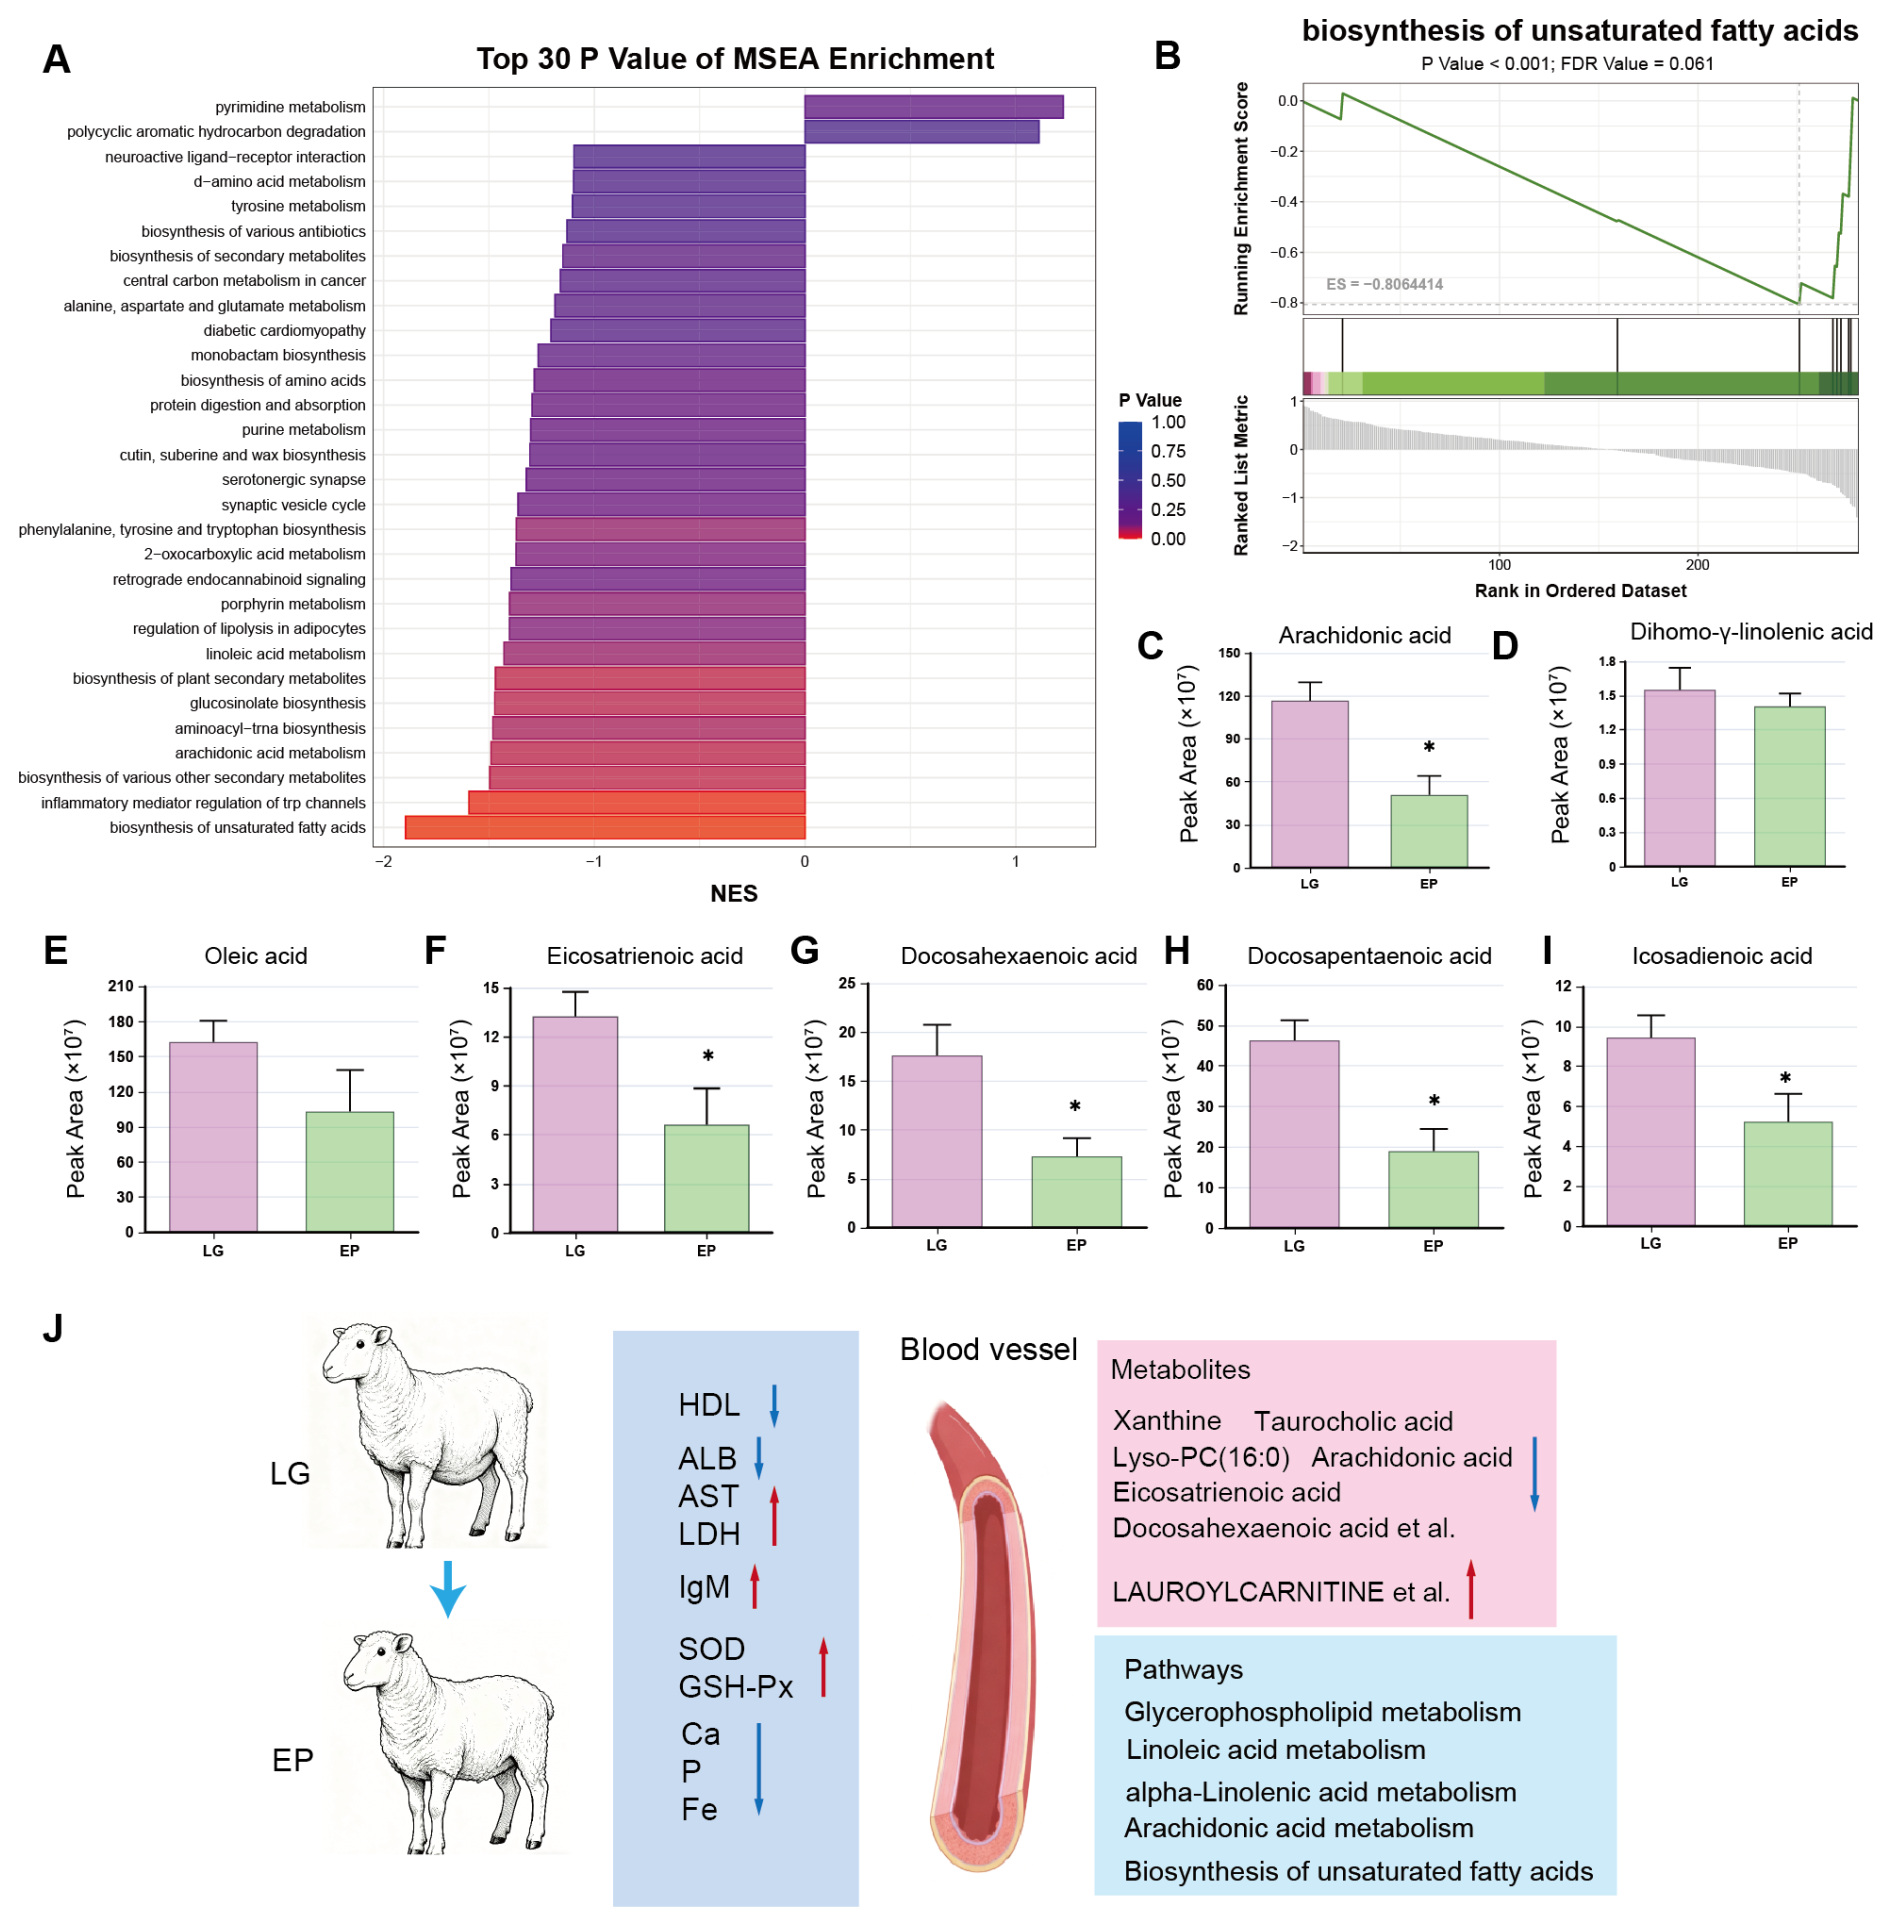
Figure 4Metabolite set enrichment analysis (MSEA) between late gestation (LG) and early postpartum (EP) in dairy ewes. (A) Bar chart of top 30 metabolic pathways with minimum P values in MSEA analysis. (B) MSEA enrichment plot of biosynthesis of unsaturated fatty acids. (C–I) Metabolites enriched in biosynthesis of unsaturated fatty acids pathway. (J) The synthesis figure of conclusions. HDL, high-density lipoprotein; ALB, albumin; AST, aspartate aminotransferase; LDH, lactate dehydrogenase; IgM, immunoglobulin M; SOD, superoxide dismutase; GSH-Px, glutathione peroxidase; Ca, calcium; P, phosphorus; Fe, iron. ∗ indicates P < 0.05.
3.5 Metabolic pathways and correlation analysis
KEGG pathway enrichment analysis revealed that lipid metabolism was the most prominently affected metabolic category during the transition from LG to EP, with significant enrichment of glycerophospholipid metabolism, linoleic acid metabolism, α-linolenic acid metabolism, and arachidonic acid metabolism (Fig. 2E). Among these pathways, glycerophospholipid metabolism contained the largest number of differential metabolites (n = 17) and was therefore examined in greater detail (Fig. 2F). Within this pathway, lysophosphatidylcholine (LPC) species were generally decreased, whereas phosphatidylethanolamine (PE) species were increased in EP relative to LG. To further characterize the relationships among differential metabolites, a correlation network was constructed (Fig. 2G). Most lipid-related metabolites formed a distinct and highly interconnected cluster, indicating coordinated regulation of lipid metabolism during the periparturient period. Network topology analysis identified 1-stearoyl-2-hydroxy-sn-glycero-3-phosphocholine, PC 18:0e, LPC 17:1-SN1, PC (0:0/18:0), and 1-hexadecanoyl-sn-glycero-3-phosphocholine as the five metabolites with the highest degree values, suggesting that they represent key metabolic hubs within the network. Spearman correlation analysis further demonstrated significant associations between lipid-related metabolites and altered plasma biochemical parameters (Fig. 2H). ALB, HDL, Ca, Fe, and P were negatively correlated with several phosphocholine-related metabolites, whereas positive correlations were observed with PE (18:2/0:0), PC (12:0/0:0), and 1,2-dipalmitoyl-sn-glycero-3-PC. In contrast, IgM, LDH, and SOD exhibited opposite correlation patterns. Metabolite set enrichment analysis (MSEA) was subsequently performed to evaluate coordinated pathway-level alterations (Fig. 4A). Among the enriched pathways, biosynthesis of unsaturated fatty acids was significantly downregulated in EP compared with LG (Fig. 4B). Consistent with this result, five metabolites assigned to this pathway showed lower abundances in EP, including arachidonic acid, eicosatrienoic acid, docosahexaenoic acid, docosapentaenoic acid, and icosadienoic acid (Fig. 4C–I).
The transition from LG to EP represents one of the most metabolically demanding phases in dairy sheep. During this period, nutrients must be repartitioned to support fetal growth, parturition, colostrum production, and the onset of lactation. Consequently, ewes are particularly vulnerable to metabolic disturbances during this period, including negative energy balance, hypocalcemia, ketosis, and excessive lipid mobilization (Simões and Margatho, 2024). Consistent with this concept, significant differences in plasma biochemical parameters, mineral concentrations, and metabolite profiles were observed between LG and EP ewes in the present study. Together, these findings indicate substantial physiological adaptations involving liver function, lipid metabolism, immune status, antioxidant defense, and mineral homeostasis during the transition from LG to EP.
4.1 Changes in plasma biochemical profiles during the transition from LG to EP
In the present study, conventional indicators of protein metabolism, including TP, BUN, and CREA, remained unchanged between LG and EP, suggesting that overall protein metabolic status was relatively stable during this transition. Likewise, plasma glucose, NEFA, and BHB concentrations did not differ significantly between periods. In dairy cows, the onset of lactation is often accompanied by decreased dry matter intake, particularly during the period immediately before and after parturition (Cheong et al., 2016). Because energy intake frequently fails to meet the increasing demands of lactation, cows typically experience negative energy balance, resulting in enhanced adipose tissue mobilization and increased endogenous glucose production to maintain glucose homeostasis (Wankhade et al., 2017). Consequently, alterations in circulating glucose, NEFA, and BHB concentrations are commonly observed during the transition period, although the direction and magnitude of these changes may vary among studies. For example, Zhang et al. (2024) reported decreased plasma glucose concentrations together with elevated NEFA and BHB levels postpartum, whereas Salin et al. (2017) observed increased blood glucose concentrations after parturition. In contrast, our findings are consistent with observations in Lacaune ewes maintained under positive energy balance, where plasma glucose, NEFA, and BHB remained relatively stable during parturition (Bouvier-Muller et al., 2016). These results suggest that the metabolic adaptations occurring in the present study were not characterized by pronounced energy deficiency or excessive lipid mobilization. However, significant alterations were observed in lipid-related and liver-function-associated indicators. Plasma HDL concentration decreased during the EP period, consistent with previous observations in periparturient sheep (Singh et al., 2022). Similar changes in transition dairy cows have been associated with reduced activities of lecithin acyltransferase (LCAT) and phospholipid transfer protein during parturition (Kessler et al., 2014). Reduced LCAT activity may impair cholesterol esterification and HDL maturation, thereby contributing to lower circulating HDL concentrations. Concurrently, albumin concentration declined, whereas AST and LDH activities increased. Similar changes have been reported in periparturient dairy cows and are generally considered indicators of increased hepatic metabolic workload associated with the onset of lactation (Bionaz et al., 2007; Zhang et al., 2015, 2024). Albumin is synthesized exclusively by the liver and is often reduced during periods of metabolic challenge or inflammatory activation (Bertoni et al., 2008; Trevisi and Minuti, 2018). Elevated AST and LDH activities may further reflect increased tissue and hepatic metabolic activity. Notably, ALT and TBIL remained unchanged in the present study, suggesting that these alterations were more likely associated with physiological metabolic adaptation rather than overt liver injury. Similar patterns have been reported in small ruminants experiencing metabolic stress during the periparturient period (Chagas et al., 2023; Guo et al., 2019). Because EP samples were collected 1 d after parturition, when lactation had already commenced, the present design cannot distinguish the individual contributions of parturition and early lactation.
Inflammatory activation and oxidative stress are common physiological features of the periparturient period in dairy ruminants (Contreras et al., 2010; Trevisi et al., 2012; Turk et al., 2005). Even in the absence of overt infection, parturition is often accompanied by a transient systemic inflammatory response characterized by increased production of pro-inflammatory mediators, including tumor necrosis factor-α, IL-1, and IL-6 (Bionaz et al., 2007). Concurrently, the marked increase in metabolic activity during parturition elevates oxygen consumption and reactive oxygen species (ROS) generation. When ROS production exceeds antioxidant defense capacity, oxidative stress may develop (Sordillo and Aitken, 2009). In the present study, plasma IgM concentrations and the activities of SOD and GSH-Px were higher in EP than in LG. Similarly, Santarosa et al. (2021) reported increased SOD activity at parturition and 24 h postpartum, and generally elevated SOD and GSH-Px activities during the periparturient period in Dorper ewes. Increased antioxidant enzyme activity during EP has also been reported in dairy cows (Sayiner et al., 2021), suggesting that the elevations in SOD and GSH-Px observed here may represent an adaptive antioxidant response to the increased oxidative challenge associated with parturition and the onset of lactation.
Significant reductions in plasma Ca, P, and Fe concentrations were also observed during the EP period. Similar changes have been widely reported in periparturient sheep and goats, and are generally attributed to the increased mineral demands associated with rapid fetal growth during LG, colostrum synthesis, and the onset of milk secretion (Chagas et al., 2023; Simões and Margatho, 2024). In particular, calcium plays a central role in numerous physiological processes, including neuromuscular function, intracellular signaling, and immune regulation. Reduced circulating calcium concentrations during parturition have been associated with impaired immune cell function and increased susceptibility to metabolic disorders in dairy ruminants (Martinez et al., 2012). Consistent with our findings, Brugger and Liesegang (2025) reported that serum calcium concentrations in dairy sheep and goats were lower at 1 d postpartum than at 21 d prepartum. In contrast, plasma concentrations of Mg, Zn, Cu, Na, and K remained stable in the present study, suggesting that homeostatic regulation of these minerals was largely maintained under the prevailing management and nutritional conditions.
4.2 Plasma metabolomic remodeling during the transition from LG to EP
Lipid metabolism undergoes substantial adaptation during the transition from pregnancy to lactation to accommodate changes in nutrient partitioning and tissue demands (McFadden, 2020). In the present study, untargeted metabolomics identified 85 differential plasma metabolites between LG and EP, of which 78 % were classified as lipids or lipid-like molecules, indicating that lipid metabolism was the predominant component of the metabolic response. This finding is consistent with Luo et al. (2019), who reported marked alterations in lipid and energy metabolism in dairy cows between approximately 21 d prepartum and parturition, and with Ghaffari et al. (2024), who demonstrated extensive remodeling of circulating acylcarnitines, phosphatidylcholines (PC), LPC, and bile acids across calving. Notably, plasma NEFA and BHB remained unchanged in our ewes. As a result, the lipid-dominant metabolomic changes observed here appear to reflect qualitative remodeling of lipid transport and utilization rather than the pronounced lipomobilization and ketogenesis typically associated with severe negative energy balance.
Among the altered lipid-related metabolites, lauroylcarnitine increased in EP ewes. Acylcarnitines are generated during mitochondrial fatty acid trafficking and may accumulate when fatty acid influx and β-oxidation are not fully matched by downstream oxidative capacity, thereby contributing to the maintenance of the mitochondrial acyl-CoA/free CoA balance (Ghaffari et al., 2020). Alterations in circulating acylcarnitines during parturition have similarly been reported in dairy cows and have been associated with the remodeling of mitochondrial fatty acid metabolism during the transition to lactation (Ghaffari et al., 2020, 2024). The abrupt increase in energy demand at the onset of lactation may increase fatty acid flux toward mitochondria, resulting in greater formation of acylcarnitine intermediates while downstream oxidative metabolism is still adapting. This may partly explain the increased plasma lauroylcarnitine concentration observed in EP ewes. In contrast, plasma taurocholic acid decreased in EP. As a taurine-conjugated primary bile acid, circulating taurocholic acid is determined by several interconnected processes, including hepatic bile acid synthesis and conjugation, biliary secretion, and enterohepatic recycling (Hofmann, 2009). Previous studies have shown pronounced temporal changes in circulating bile acids across calving, although the direction of individual bile acid species varies among studies (Fan et al., 2025; Ghaffari et al., 2024). Consequently, the lower taurocholic acid concentration observed in EP may reflect the redistribution of the circulating bile acid pool through alterations in hepatic secretion and enterohepatic recycling during the transition to lactation.
The most prominent metabolic alteration involved glycerophospholipid metabolism. Several LPC species decreased, PE species generally increased, and individual PC species changed in different directions in EP ewes. Rico et al. (2021) reported that most plasma phospholipid classes, including LPC, PC, and PE, reached their lowest concentrations during parturition, whereas Ghaffari et al. (2024) observed decreases in PC and lysoPC around calving followed by recovery as lactation progressed. In contrast to the generalized decrease reported in cows, the opposite patterns of LPC and PE observed here may be associated with class-specific remodeling of circulating phospholipids in dairy ewes. LPC, PC, and PE are major components of cellular membranes and circulating lipoproteins, and are closely involved in membrane remodeling and lipid transport (Knuplez and Marsche, 2020; McFadden, 2020). PC is a major phospholipid component of circulating lipoproteins, particularly HDL, and serves as an acyl donor for lecithin:cholesterol acyltransferase-mediated cholesterol esterification (Kontush et al., 2013). Notably, Kessler et al. (2014) reported that the postpartum nadir in HDL and plasma phospholipids in dairy cows coincided with marked changes in lecithin acyltransferase and phospholipid transfer protein activities. Therefore, the concurrent decrease in HDL and remodeling of LPC, PC, and PE in the present study may reflect altered lipoprotein-associated phospholipid trafficking during the onset of lactation. Nevertheless, the tissue origin and metabolic destination of these phospholipids cannot be determined from plasma metabolomics alone.
Alterations in linoleic acid, α-linolenic acid, and arachidonic acid metabolism further indicate remodeling of the fatty acid composition of circulating lipids. MSEA showed coordinated decreases in arachidonic acid, eicosatrienoic acid, docosahexaenoic acid, docosapentaenoic acid, and icosadienoic acid in EP. Consistent with our findings, Contreras et al. (2010) reported a reduction in long-chain PUFA within leukocyte phospholipids during the periparturient period, particularly during the first 2 weeks postpartum. Long-chain PUFA are important constituents of membrane phospholipids and provide substrates for the synthesis of bioactive lipid mediators involved in the initiation and resolution of inflammatory responses (Mavangira and Sordillo, 2018; Raphael et al., 2014; Sordillo, 2018). The lower abundance of these PUFA in EP may be related to their redistribution during membrane remodeling and, potentially, their use as substrates for lipid-mediator synthesis during parturition. These changes occurred concurrently with increased IgM, SOD, and GSH-Px, further supporting an association between lipid remodeling and the immune-oxidative adaptations during parturition. Finally, the identification of several LPC and PC species as highly connected metabolites in the correlation network further supports coordinated remodeling of circulating lipid metabolism. Collectively, the metabolomic results indicate that glycerophospholipid remodeling and altered PUFA availability represent major features of the metabolic transition from LG to EP in dairy ewes.
A limitation of the present study is the relatively small sample size used for untargeted metabolomics analysis. Although the paired design reduced between-animal variation and improved statistical efficiency, analysis of only 10 biological replicates may increase the risk of false-positive findings when screening a large number of metabolites. Therefore, the differential metabolites identified in this study should be considered exploratory and require validation in larger independent populations using targeted metabolomics.
This study demonstrates that dairy ewes undergo substantial metabolic adaptations from LG to EP (Fig. 4J). We identified 85 differential metabolites between LG and EP. Furthermore, the most prominent metabolic adaptations involved lipid metabolism, particularly glycerophospholipid remodeling, accompanied by shifts in liver function markers, mineral concentrations, immunity, and oxidative responses. These metabolic changes provide candidate indicators for monitoring the physiological status of dairy ewes during the transition period and may help to identify metabolic pathways that could be targeted through nutritional management. Future studies should validate these candidate biomarkers using targeted metabolomics and investigate the regulatory mechanisms underlying the identified pathways.
The data and materials that support the findings of this study are available from the corresponding author upon reasonable request. The raw datasets generated from the non-targeted metabolomics analysis are currently undergoing further processing and quality assessment before potential deposition in a public repository.
The supplement related to this article is available online at https://doi.org/10.5194/aab-69-681-2026-supplement.
Shuai Jiao: conceptualization, methodology, investigation, data curation, formal analysis, software, validation, and writing (original draft). Yongheng Man and Tianxi Zhang: data curation and writing (review and editing). Tao Wang: formal analysis and writing (review and editing). Xiyun Zhang and Pengshan Zhao: investigation and writing (review and editing). Long Guo and Zhiyuan Ma: validation and writing (review and editing). Xiuxiu Weng: methodology and writing (review and editing). Fei Li: conceptualization, methodology, supervision, project administration, and writing (review and editing). All authors read and approved the final article.
The contact author has declared that none of the authors has any competing interests.
Publisher's note: Copernicus Publications remains neutral with regard to jurisdictional claims made in the text, published maps, institutional affiliations, or any other geographical representation in this paper. The authors bear the ultimate responsibility for providing appropriate place names. Views expressed in the text are those of the authors and do not necessarily reflect the views of the publisher.
The animal sampling procedures were approved by the Animal Ethics Committee of Lanzhou University (protocol no. LZU 202303003), and all animal handling and sample collection were conducted in accordance with the approved guidelines and regulations.
The authors thank colleagues at Gansu Yuansheng Agriculture and Animal Husbandry Technology Co., Ltd., for providing kind assistance in the animal experiments, sample processing, and data collection.
This study was funded by the Central Guidance for Local Science and Technology Development Fund Project (25ZYJA022), the Tianchi Talent Introduction Program of Xinjiang Uygur Autonomous Region, and the Research Project on Elite Germplasm Breeding and Precision Nutrition Technologies for Dairy Sheep.
This paper was edited by Steffen Maak and reviewed by Yangchun Cao and one anonymous referee.
Bell, A. W.: Regulation of organic nutrient metabolism during transition from late pregnancy to early lactation, J. Anim. Sci., 73, 2804–2819, https://doi.org/10.2527/1995.7392804x, 1995.
Bertoni, G., Trevisi, E., Han, X., and Bionaz, M.: Effects of inflammatory conditions on liver activity in puerperium period and consequences for performance in dairy cows, J. Dairy Sci., 91, 3300–3310, https://doi.org/10.3168/jds.2008-0995, 2008.
Bionaz, M., Trevisi, E., Calamari, L., Librandi, F., Ferrari, A., and Bertoni, G.: Plasma paraoxonase, health, inflammatory conditions, and liver function in transition dairy cows, J. Dairy Sci., 90, 1740–1750, https://doi.org/10.3168/jds.2006-445, 2007.
Bouvier-Muller, J., Allain, C., Enjalbert, F., Tabouret, G., Portes, D., Caubet, C., Tasca, C., Foucras, G., and Rupp, R.: Response to dietary-induced energy restriction in dairy sheep divergently selected for resistance or susceptibility to mastitis, J. Dairy Sci., 99, 480–492, https://doi.org/10.3168/jds.2015-9785, 2016.
Brugger, D. and Liesegang, A.: Antepartum high dietary supply of calcium affects bone homeostasis and offspring growth in dairy sheep and dairy goats, J. Dairy Sci., 108, 5786–5802, https://doi.org/10.3168/jds.2024-25587, 2025.
Chagas, D. W., de Oliveira Feijó, J., Corrêa, M. N., Furtado, M., Gueretz, J. S., Peripolli, V., Bianchi, I., Moreira, F., and Schwegler, E.: Metabolic profile of transition period in ewes and its influence on passive immunity transference in lambs, Trop. Anim. Health Prod., 55, 112, https://doi.org/10.1007/s11250-023-03531-5, 2023.
Cheong, S. H., Sá Filho, O. G., Absalón-Medina, V. A., Pelton, S. H., Butler, W. R., and Gilbert, R. O.: Metabolic and endocrine differences between dairy cows that do or do not ovulate first postpartum dominant follicles, Biol. Reprod., 94, 18, https://doi.org/10.1095/biolreprod.114.127076, 2016.
Contreras, G. A., O'Boyle, N. J., Herdt, T. H., and Sordillo, L. M.: Lipomobilization in periparturient dairy cows influences the composition of plasma nonesterified fatty acids and leukocyte phospholipid fatty acids, J. Dairy Sci., 93, 2508–2516, https://doi.org/10.3168/jds.2009-2876, 2010.
Drackley, J. K.: ADSA foundation scholar award. Biology of dairy cows during the transition period: The final frontier?, J. Dairy Sci., 82, 2259–2273, https://doi.org/10.3168/jds.s0022-0302(99)75474-3, 1999.
Fan, F., Chen, L., Sun, H., Liu, J., Yang, K., and Gu, F.: Longitudinal dynamics of plasma bile acids and their associations with physiological parameters and fecal microbiome during the transition period in dairy cows, Anim. Biosci., 38, 1194–1205, https://doi.org/10.5713/ab.24.0628, 2025.
Ghaffari, M. H., Sadri, H., Schuh, K., Dusel, G., Prehn, C., Adamski, J., Koch, C., and Sauerwein, H.: Alterations of the acylcarnitine profiles in blood serum and in muscle from periparturient cows with normal or elevated body condition, J. Dairy Sci., 103, 4777–4794, https://doi.org/10.3168/jds.2019-17713, 2020.
Ghaffari, M. H., Daniel, J. B., Sadri, H., Schuchardt, S., Martín-Tereso, J., and Sauerwein, H.: Longitudinal characterization of the metabolome of dairy cows transitioning from one lactation to the next: investigations in blood serum, J. Dairy Sci., 107, 1263–1285, https://doi.org/10.3168/jds.2023-23841, 2024.
Guo, C., Xue, Y., Seddik, H., Yin, Y., Hu, F., and Mao, S.: Dynamic changes of plasma metabolome in response to severe feed restriction in pregnant ewes, Metabolites, 9, 112, https://doi.org/10.3390/metabo9060112, 2019.
Ha, N.-T., Drögemüller, C., Reimer, C., Schmitz-Hsu, F., Bruckmaier, R. M., Simianer, H., and Gross, J. J.: Liver transcriptome analysis reveals important factors involved in the metabolic adaptation of the transition cow, J. Dairy Sci., 100, 9311–9323, https://doi.org/10.3168/jds.2016-12454, 2017.
Hofmann, A. F.: The enterohepatic circulation of bile acids in mammals: form and functions, Front. Biosci., 14, 2584–2598, https://doi.org/10.2741/3399, 2009.
Imhasly, S., Bieli, C., Naegeli, H., Nyström, L., Ruetten, M., and Gerspach, C.: Blood plasma lipidome profile of dairy cows during the transition period, BMC Vet. Res., 11, 252, https://doi.org/10.1186/s12917-015-0565-8, 2015.
Ingvartsen, K. L. and Andersen, J. B.: Integration of metabolism and intake regulation: a review focusing on periparturient animals, J. Dairy Sci., 83, 1573–1597, https://doi.org/10.3168/jds.S0022-0302(00)75029-6, 2000.
Jiao, S., Li, F., Zhang, T., Yang, G., Lu, R., Li, F., Guo, L., Ma, Z., Zhao, P., and Liu, B.: Integrated multi-omics identifies dysregulated lipid metabolism of paresis in dairy sheep during the early transition period, Microbiol. Spectrum, 13, e01544-25, https://doi.org/10.1128/spectrum.01544-25, 2025.
Kessler, E. C., Gross, J. J., Bruckmaier, R. M., and Albrecht, C.: Cholesterol metabolism, transport, and hepatic regulation in dairy cows during transition and early lactation, J. Dairy Sci., 97, 5481–5490, https://doi.org/10.3168/jds.2014-7926, 2014.
Knuplez, E. and Marsche, G.: An updated review of pro- and anti-inflammatory properties of plasma lysophosphatidylcholines in the vascular system, Int. J. Mol. Sci., 21, 4501, https://doi.org/10.3390/ijms21124501, 2020.
Kontush, A., Lhomme, M., and Chapman, M. J.: Unraveling the complexities of the HDL lipidome, J. Lipid Res., 54, 2950–2963, https://doi.org/10.1194/jlr.R036095, 2013.
Kuhl, C., Tautenhahn, R., Böttcher, C., Larson, T. R., and Neumann, S.: CAMERA: An integrated strategy for compound spectra extraction and annotation of liquid chromatography/mass spectrometry data sets, Anal. Chem., 84, 283–289, https://doi.org/10.1021/ac202450g, 2012.
Luo, Z. Z., Shen, L. H., Jiang, J., Huang, Y. X., Bai, L. P., Yu, S. M., Yao, X. P., Ren, Z. H., Yang, Y. X., and Cao, S. Z.: Plasma metabolite changes in dairy cows during parturition identified using untargeted metabolomics, J. Dairy Sci., 102, 4639–4650, https://doi.org/10.3168/jds.2018-15601, 2019.
Martinez, N., Risco, C. A., Lima, F. S., Bisinotto, R. S., Greco, L. F., Ribeiro, E. S., Maunsell, F., Galvão, K., and Santos, J. E. P.: Evaluation of peripartal calcium status, energetic profile, and neutrophil function in dairy cows at low or high risk of developing uterine disease, J. Dairy Sci., 95, 7158–7172, https://doi.org/10.3168/jds.2012-5812, 2012.
Mavangira, V. and Sordillo, L. M.: Role of lipid mediators in the regulation of oxidative stress and inflammatory responses in dairy cattle, Res. Vet. Sci., 116, 4–14, https://doi.org/10.1016/j.rvsc.2017.08.002, 2018.
McFadden, J. W.: Review: lipid biology in the periparturient dairy cow: contemporary perspectives, Animal, 14, s165–s175, https://doi.org/10.1017/S1751731119003185, 2020.
Pesántez-Pacheco, J. L., Heras-Molina, A., Torres-Rovira, L., Sanz-Fernández, M. V., García-Contreras, C., Vázquez-Gómez, M., Feyjoo, P., Cáceres, E., Frías-Mateo, M., Hernández, F., Martínez-Ros, P., González-Martin, J. V., González-Bulnes, A., and Astiz, S.: Maternal metabolic demands caused by pregnancy and lactation: association with productivity and offspring phenotype in high-yielding dairy ewes, Animals, 9, 295, https://doi.org/10.3390/ani9060295, 2019.
Raphael, W., Halbert, L., Contreras, G. A., and Sordillo, L. M.: Association between polyunsaturated fatty acid-derived oxylipid biosynthesis and leukocyte inflammatory marker expression in periparturient dairy cows, J. Dairy Sci., 97, 3615–3625, https://doi.org/10.3168/jds.2013-7656, 2014.
Rico, J. E., Saed Samii, S., Zang, Y., Deme, P., Haughey, N. J., Grilli, E., and McFadden, J. W.: Characterization of the plasma lipidome in dairy cattle transitioning from gestation to lactation: identifying novel biomarkers of metabolic impairment, Metabolites, 11, 290, https://doi.org/10.3390/metabo11050290, 2021.
Salin, S., Vanhatalo, A., Elo, K., Taponen, J., Boston, R. C., and Kokkonen, T.: Effects of dietary energy allowance and decline in dry matter intake during the dry period on responses to glucose and insulin in transition dairy cows, J. Dairy Sci., 100, 5266–5280, https://doi.org/10.3168/jds.2016-11871, 2017.
Santarosa, B. P., Dantas, G. N., Ferreira, D. O. L., Hooper, H. B., Sinzato, Y. K., Damasceno, D. C., Polizel, D. M., da Silva, A. A., and Gonçalves, R. C.: Comparison of oxidative stress markers between single and twin gestations in dorper ewes during pregnancy, delivery and postpartum, Small Ruminant Res., 197, 106333, https://doi.org/10.1016/j.smallrumres.2021.106333, 2021.
Sayiner, S., Darbaz, I., Ergene, O., and Aslan, S.: Changes in antioxidant enzyme activities and metabolic parameters in dairy cows during different reproductive periods, Theriogenology, 159, 116–122, https://doi.org/10.1016/j.theriogenology.2020.10.024, 2021.
Simões, J. and Margatho, G.: Metabolic periparturient diseases in small ruminants: an update, Appl. Sci., 14, 10073, https://doi.org/10.3390/app142110073, 2024.
Singh, R., Singh, A., Beigh, S. A., Sharma, N., and Singh, V.: Effect of physiological status and parity on metabolic and trace element profile of crossbred rambouillet sheep of himalayan region, Trop. Anim. Health Prod., 54, 63, https://doi.org/10.1007/s11250-022-03068-z, 2022.
Smith, C. A., Want, E. J., O'Maille, G., Abagyan, R., and Siuzdak, G.: XCMS: Processing mass spectrometry data for metabolite profiling using nonlinear peak alignment, matching, and identification, Anal. Chem., 78, 779–787, https://doi.org/10.1021/ac051437y, 2006.
Sordillo, L. M.: Symposium review: oxylipids and the regulation of bovine mammary inflammatory responses, J. Dairy Sci., 101, 5629–5641, https://doi.org/10.3168/jds.2017-13855, 2018.
Sordillo, L. M. and Aitken, S. L.: Impact of oxidative stress on the health and immune function of dairy cattle, Vet. Immunol. Immunopathol., 128, 104–109, https://doi.org/10.1016/j.vetimm.2008.10.305, 2009.
Trevisi, E. and Minuti, A.: Assessment of the innate immune response in the periparturient cow, Res. Vet. Sci., 116, 47–54, https://doi.org/10.1016/j.rvsc.2017.12.001, 2018.
Trevisi, E., Amadori, M., Cogrossi, S., Razzuoli, E., and Bertoni, G.: Metabolic stress and inflammatory response in high-yielding, periparturient dairy cows, Res. Vet. Sci., 93, 695–704, https://doi.org/10.1016/j.rvsc.2011.11.008, 2012.
Turk, R., Juretić, D., Gereš, D., Turk, N., Rekić, B., Simeon-Rudolf, V., Robić, M., and Svetina, A.: Serum paraoxonase activity in dairy cows during pregnancy, Res. Vet. Sci., 79, 15–18, https://doi.org/10.1016/j.rvsc.2004.09.010, 2005.
Wankhade, P. R., Manimaran, A., Kumaresan, A., Jeyakumar, S., Ramesha, K. P., Sejian, V., Rajendran, D., and Varghese, M. R.: Metabolic and immunological changes in transition dairy cows: a review, Vet. World, 10, 1367–1377, https://doi.org/10.14202/vetworld.2017.1367-1377, 2017.
Wen, B., Mei, Z., Zeng, C., and Liu, S.: metaX: A flexible and comprehensive software for processing metabolomics data, BMC Bioinf., 18, 183, https://doi.org/10.1186/s12859-017-1579-y, 2017.
Wishart, D. S.: Metabolomics for investigating physiological and pathophysiological processes, Physiol. Rev., 99, 1819–1875, https://doi.org/10.1152/physrev.00035.2018, 2019.
Yang, Z., Luo, F., Liu, G., Luo, Z., Ma, S., Gao, H., He, H., and Tao, J.: Plasma metabolomic analysis reveals the relationship between immune function and metabolic changes in holstein peripartum dairy cows, Metabolites, 12, 953, https://doi.org/10.3390/metabo12100953, 2022.
Zhang, J., Zhang, X., Liu, H., Wang, P., Li, L., Bionaz, M., Lin, P., and Yao, J.: Altered bile acid and correlations with gut microbiome in transition dairy cows with different glucose and lipid metabolism status, J. Dairy Sci., 107, 9915–9933, https://doi.org/10.3168/jds.2024-24658, 2024.
Zhang, Q., Su, H., Wang, F., Cao, Z., and Li, S.: Effects of energy density in close-up diets and postpartum supplementation of extruded full-fat soybean on lactation performance and metabolic and hormonal status of dairy cows, J. Dairy Sci., 98, 7115–7130, https://doi.org/10.3168/jds.2014-9112, 2015.