
the Creative Commons Attribution 4.0 License.
the Creative Commons Attribution 4.0 License.
 | 17 Aug 2026
GH-mRNA expression and prediction of genetic improvement using selection index for body weight traits in turkeys
Mohamed H. Khalil
Alaa A. Abd El-Motaleb
Manal M. Abdel-Rahman
Emad M. Amin
Ibrahim Abousoliman
Mostafa K. Shebl
This study aimed to evaluate the expected responses to a selection index based on body-weight-related traits to improve the productive performance of turkeys and to investigate the relationship between body weight and growth hormone (GH) gene expression. Two lines of local Baladi turkeys were used: a selected line (S), chosen for high body weight at 6 months of age; and an unselected random-bred control line (C). Both lines originated from the same randomly mated base population. A selection index incorporating body weight (BW), shank length (SL), and breast width (BRW) at 6 months of age was constructed. This index resulted in expected genetic gains per generation of 441.71 g for BW, 0.26 cm for SL, and 1.93 cm for BRW. Growth hormone gene expression in the selected line was significantly higher than in the control line for both sexes. In males, GH showed a relative gene expression of 1.43 in the selected line compared with 1.01 in the control line, while in females, the corresponding values were 1.76 and 1.31, respectively. Differences in GH-mRNA expression between the two lines indicate a positive association between gene expression level and body weight, suggesting that GH expression may be a useful molecular marker in genetic selection programs aimed at improving body weight in turkeys.
- Article
(575 KB) - Full-text XML
- BibTeX
- EndNote


Poultry is a vital source of food and income for farmers in many economic and social contexts. Poultry is a rich source of protein, essential amino acids, and micronutrients, which are crucial for human growth, muscle maintenance, and overall health (Sheffield et al., 2024). With output statistics reaching over 5.8 million tons of poultry meat in 2021 (FAO, 2023), or roughly 4.2 % of total poultry meat production, the global market for turkey meat that considered the main product of raising turkeys has experienced significant expansion (Kálmán and Szöllősi, 2023). The growing global demand for meat has prompted breeders and farmers to produce turkeys with rapid growth rates (Salter, 2017; Baldi and Gottardo, 2017). Therefore, the objectives of turkey breeding, which are to enhance production and lower costs, depend heavily on boosting growth and yield (Aslam et al., 2011; Begli et al., 2019; Abdalla et al., 2021). In turkey breeding, selection indices are widely used to combine multiple traits into a single score, enabling breeders to make informed decisions that balance competing objectives, such as improving growth while maintaining reproductive fitness. These indices are constructed using estimated breeding values derived from statistical models that account for heritability, genetic correlations, and economic weights assigned to each trait (Wellmann, 2023). The selection and application of selection indices for traits such as body weight, shank length, and breast width in turkeys are integral to modern poultry breeding programs, as these traits are directly associated with meat production, structural soundness, and overall economic value. Body weight is a primary selection criterion due to its strong correlation with meat yield. At the same time, shank length and breast width are important indicators of skeletal development and muscle mass, respectively. Selection indices are statistical tools that combine these traits into a single score, weighted by their heritability, genetic correlations, and economic importance, allowing breeders to optimize genetic progress across multiple traits simultaneously (Rajkumar et al., 2023). Local black Baladi turkey production continues to lag that of common varieties. To genetically characterize this flock and assess its genetic diversity for use in selection and breeding programs, further research is needed. The black Baladi turkey is the indigenous turkey breed of Egypt, predominantly reared under backyard and smallholder production systems throughout the Nile Delta and Upper Egypt. The breed is characterized by glossy black plumage, moderate body size, adaptability to harsh environmental conditions, and good resistance to local diseases. Although its growth rate and reproductive performance are generally lower than those of commercial turkey strains, it is valued for its meat quality and constitutes an important reservoir of indigenous genetic diversity (Amin, 2014; Mostafa, 2019). Traditionally, black Baladi turkeys have been maintained through uncontrolled natural mating, with selection based mainly on phenotypic traits such as body weight, fertility, hatchability, and survivability. Recent studies have demonstrated that selection for body weight and crossbreeding with commercial strains, such as white Nicholas, can improve productive performance while preserving the adaptive characteristics of the local breed. However, no nationwide structured breeding and conservation program has yet been established for this indigenous genetic resource (Amin, 2014; Abd El-Motaleb et al., 2025).
The importance of gene expression analysis has grown significantly, with the quantitative reverse transcription polymerase chain reaction (RT-PCR) being the method of choice for analyzing specific genes or performing mid-density gene expression analyses (Bustin et al., 2009; Wang et al., 2020). The somatotropic axis (GH-GHR-IGF) plays a central role in regulating growth and development in animals. The importance of GH and its ability to increase productivity in domestic mammals is well supported by research on some mammalian species. However, the way that GH functions in poultry development appears to be highly complex. The chicken growth hormone plays a crucial part in improving chicken performance, mostly by supporting growth processes. GH, a polypeptide hormone that affects several physiological processes including development, egg production, homeostatic regulation of feed intake, and reproductive activities, is synthesized and secreted by the pituitary gland (El-Tahawy et al., 2021; Zhu La et al., 2023; Mariandayani et al., 2023; Jakhrani et al., 2024). Moreover, GH's main effects include promoting the synthesis of proteins and nucleic acids, increasing the use of fats for energy production, controlling osmotic balance, and promoting reproduction (Lanes, 2016; Zhou et al., 2023; Yamamoto and Bando, 2023). Previously, growth-selected lines showed higher hepatic GH receptor binding than GH in both mature (Ellestad et al., 2019) and young (Antar et al., 2020) turkeys and hens (Vasilatos-Younken et al., 1990; Yang et al., 2022).
The objectives of this study were to analyze the expected responses to the selection index utilizing body weight traits for improving turkey growth and to investigate the association between gene (GH) expression and body weight of turkeys to be used as a genetic marker in selection programs.
The present study was conducted at the Poultry Research Centre, Poultry Production Department, Faculty of Agriculture, Alexandria University, Egypt, during the breeding season of 2019. Molecular genetics was conducted at the Genetic Engineering and Biotechnology Laboratory, Plant Pathology Department, Genetic Branch, Faculty of Agriculture, Damanhour University, and the Desert Research Centre, Ministry of Agriculture.
2.1 Scheme for mating
A total of 193 birds were used in a random mating system to maintain the Egyptian local Baladi turkeys' base population (G0) (48 males and 145 females). The selected parents (13 males and 55 females) were picked from the base population based on their highest 6-month body weight to reproduce the selected line in the first generation (F1). The first generation (F1) of selection consists of the control (C) line, which was randomly selected from the base population, and the selected line (S), which was begun from the selected parents by mass selection for increased 6-month BW. At 7 months of age, eggs were pedigreed and collected daily for each pen. Four weekly hatches were used. At hatching, poults were pedigreed and wing-banded at 1 day old. Body weights (BWs) of birds at 0, 1, 2, 3, 4, 5, and 6 months of age were recorded individually, and body weight gain (g) during the period (0–6) months of age (BWG). At 4 months of age, birds were sexed. All experimental birds were reared under conventional floor-pen conditions with appropriate stocking density, ad libitum access to feed and clean drinking water, and standard health management practices, including routine vaccination and biosecurity measures. The classical standards for ration constituents were regarded for each age group. From hatching to 4 weeks of age, all chicks were fed a practical turkey pre-starter diet providing 28.7 % protein and 2807 kcal ME kg−1. After that, the birds were given rations according to a program comprising three feeding stages (starter diet providing 23 % protein and 3000 kcal ME kg−1, grower diet providing 21 % protein and 3100 kcal ME kg−1, and laying diet providing 18 % protein and 2800 kcal ME kg−1). The different rations used were formulated to meet all nutrient requirements as established by NRC (1994).
2.1.1 Selection index
Selection index formulas (I) for body weight (BW), shank length (SL), and breast width (BRW) at 6 months of age in local Baladi turkeys were computed according to Cunningham (1969).
The relative economic values of studied traits were calculated according to Lamont (1991). This method estimated the economic values of traits using the heritabilities of the traits studied. Simply, it is an “equal progress” index, meant to make equal progress in selection by considering the heritability of each trait and using the inverse of the heritability as the weight.
The weighting factors (b's) of the original selection index were obtained by solving the following equation given by Cunningham (1969):
where P= phenotypic variances and covariances matrix, inverse of the phenotypic variances and covariances matrix, b= column vector of weighting factors, G= genetic variances and covariances matrix, and v= column vector of economic values.
Furthermore, according to Cunningham (1969), the other properties of the selection index were calculated as follows:
The standard deviation of the index (σI) where transpose of the weighting factors column vector.
The standard deviation of the aggregate genotype (σT) where transpose of the economic value column vector.
Correlation between the index and the aggregate genotype (RIT) .
The value of each trait in the index (Vt) is the percentage reduction in the rate of total genetic gain if that trait is omitted from the index. It is equal:
where a square element of the column vector of weighting factors. Wii=a diagonal element of P−1.
The expected genetic gain (ΔGi) in each trait after one round of selection on the index (i=1) was obtained by solving the following equation:
where (regression of the trait on the index). i= selection differential in SD units. σI= standard deviation of the index.
2.2 Statistical analysis
2.2.1 Body weight at different ages:
Body weight data were analyzed using a linear mixed-effects model for repeated measurements. Line (selected and control), age (0, 1, 2, 3, 4, 5, and 6 months), and their interaction were included as fixed effects. In contrast, “bird” was included as a random effect to account for repeated measurements on the same individual. When significant effects were detected, pairwise comparisons among least-squares means were performed using the Duncan test (Duncan, 1955). In addition, linear regression analysis was conducted separately for each line to estimate the average monthly growth rate over the experimental period. Data were analyzed using the general linear model of SPSS software (IBM SPSS Statistics, 2021).
The following linear model was used:
where Yijkl= body weight, Li= line (selected or control), Aj= age, interaction, Bk(Li)= random effect of bird nested within line, ϵijkl= residual error.
2.2.2 Heritability estimates and genetic and phenotypic correlations
For the selected line (F1), heritability estimates, and genetic and phenotypic correlations among BW and body measurements: shank length (SL) and breast width (BRW) at 6 months of age were estimated based on paternal half-sibs using the following linear model:
where Yijkl = observation for each dependent variable, μ= overall mean, si= random effect of the ith sire, Hj= fixed effect of the jth hatch, Xk= fixed effect of the kth sex, and eijkl = random error.
The interaction between the fixed effects was excluded from the model because it was not significant. For early ages, the sex effect was excluded from the model.
The components of variance were estimated using PROC VARCOMP (procedure variance components) in SAS (2009) with the restricted maximum likelihood (REML) method. Heritability estimates were estimated using the following formulae (Becker, 1984):
where variance component of the sire, and variance component of error.
The standard error (SE) of the estimation in this study is given by Becker (1984) as follows:
where
K= average number of progenies per sire and calculated by the following formula:
S= number of sires, N..= total number of progenies, and number of progenies per sire.
Statistical analysis was also carried out according to the multivariate linear random model (MANOVA model) for all traits studied. Multivariate analysis of variance of the k traits was performed simultaneously to estimate the variance components of all effects for each trait and the pairwise covariances among them. These estimates were calculated using the MANOVA option of the GLM procedure in the SAS software package (Khattree and Naik, 2000; SAS, 2009; Holland, 2006). Phenotypic and genetic correlations were estimated using the following formulas (Becker, 1984).
The formula for estimating phenotypic correlation (rp) is
where phenotypic component of variance for the trait x, phenotypic component of variance for the trait y, and covp(xy)= phenotypic component of covariance for the traits x and y.
The formula for estimating genetic correlation (rS) is
where sire component of the variance for the trait x, sire component of the variance for the trait y, and covS(xy)= sire component of covariance for the traits x and y.
An approximate standard error (SE) of genetic correlation is (Falconer and Mackay, 1996):
2.3 Molecular genetic analysis
2.3.1 Muscle samples
At 6 months of age, 18 turkeys were selected for muscle sampling. The birds comprised two males and two females per replicate from the selection line (three replicates) and one male and one female per replicate from the control line (three replicates). All birds were maintained under identical housing, feeding, and management conditions throughout the experiment to minimize environmental variation. Birds were humanely slaughtered in accordance with the approved institutional animal care and use protocol. Immediately after slaughter (within approximately 5–10 min), about 1 g of the Pectoralis major (PM) muscle was aseptically excised, snap-frozen in liquid nitrogen, and stored at −80 °C until RNA extraction and subsequent molecular analyses. The animals in this study were slaughtered at the certified slaughterhouse of the Faculty of Agriculture, Alexandria University. All experimental procedures, including the terminal slaughter for tissue collection, were reviewed and approved in accordance with the Alexandria University ethics code and national regulations (approval no. Alex. Agric. 092503205).
2.3.2 RNA extraction and RT-PCR analysis, gene expression
Total RNA was extracted from samples using Trizol reagent (Qiagen Valencia, CA). The RNA samples were suspended in RNase-free water, and sample purity and concentration were measured on a UV/VIS spectrometer (pg T80, UK). For cDNA synthesis, 10 µg of total RNA was reserved and transcribed with high-capacity cDNA reverse transcription kits according to the manufacturer's protocol (catalog number ABT009, Applied Biotechnology, Egypt). qPCR reactions were performed using the Rotor Gene (Qiagen Rotor Gene Q 5plex HRM, USA). A total of 1 µL of cDNA served as a template in a 10 µL PCR mixture containing 0.4 µL each of forward and reverse primers from 10 µm stocks and 2X Fast SYBR Green Master Mix (Trans Gen Biotech Co., LTD, China) and nuclease-free water to a final volume of 20 µL.
The amplification of mRNAs was carried out by gene-specific primers designed using the primer-BLAST tool available on the National Centre for Biotechnology Information (NCBI) website (https://www.ncbi.nlm.nih.gov/tools/prime-blast/, last access: 5 August 2019). Primer sequences are presented in Table 1. The qPCR conditions were 95 °C for 3 min, followed by 45 cycles of 95 °C for 15 s, 60 °C for 30 s, and 72 °C for 30 s. In addition, at the end of each reaction, a melting temperature curve of every PCR reaction was determined. Data were normalized by β-actin expression as a reference gene in each sample (Table 1). The relative expression of the growth hormone gene was calculated using the method, normalized strictly to the β-actin housekeeping gene (ΔCt=Ct, target-Ct, reference) (Livak and Schmittgen, 2001).

The GH primer pair was designed to amplify a region located entirely within Exon 5 of the Gallus gallus growth hormone (GH) mRNA transcript (GenBank Accession No. NM_204359.2). The β-actin (ACTB) primer pair was designed to amplify a region located entirely within Exon 2 of the coding sequence of the Gallus gallus β-actin mRNA transcript (GenBank Accession No. NM_205518.2).
3.1 Body weight at different ages
The mean body weight (BW) of Baladi turkeys at 0, 1, 2, 3, 4, 5, and 6 months of age in the selected and control lines is presented in Fig. 1. In the selected line, the mean BW values at the respective ages were 48.88, 258.68, 824.21, 1775.31, 2721.46, 3529.45, and 4404.61 g, whereas the corresponding values in the control line were 47.37, 250.40, 814.50, 1726.94, 2665.69, 3394.28, and 3967.25 g. Body weight increased significantly (P≤0.001) with age in both the selected and control lines. Although the selected line consistently exhibited higher mean BW than the control line throughout the study, the difference between lines was statistically significant (P≤0.01) only at 6 months of age, when birds from the selected line were significantly heavier than those from the control line (4404.61 vs. 3967.25 g). Regression analysis further demonstrated a significant linear increase (P≤0.001) (see Table 2) in BW with age, with estimated growth rates of 768.03 g per month and 710.67 g per month for the selected and control lines, respectively, over the 0–6-month growth period. A highly significant difference in body weight was also observed between sexes. Males had substantially greater body weight than females at 6 months (5599.07 vs. 3419.71). These results demonstrate a pronounced sexual dimorphism in body weight, with males weighing approximately 63.7 % more than females at 6 months of age (Table 2).
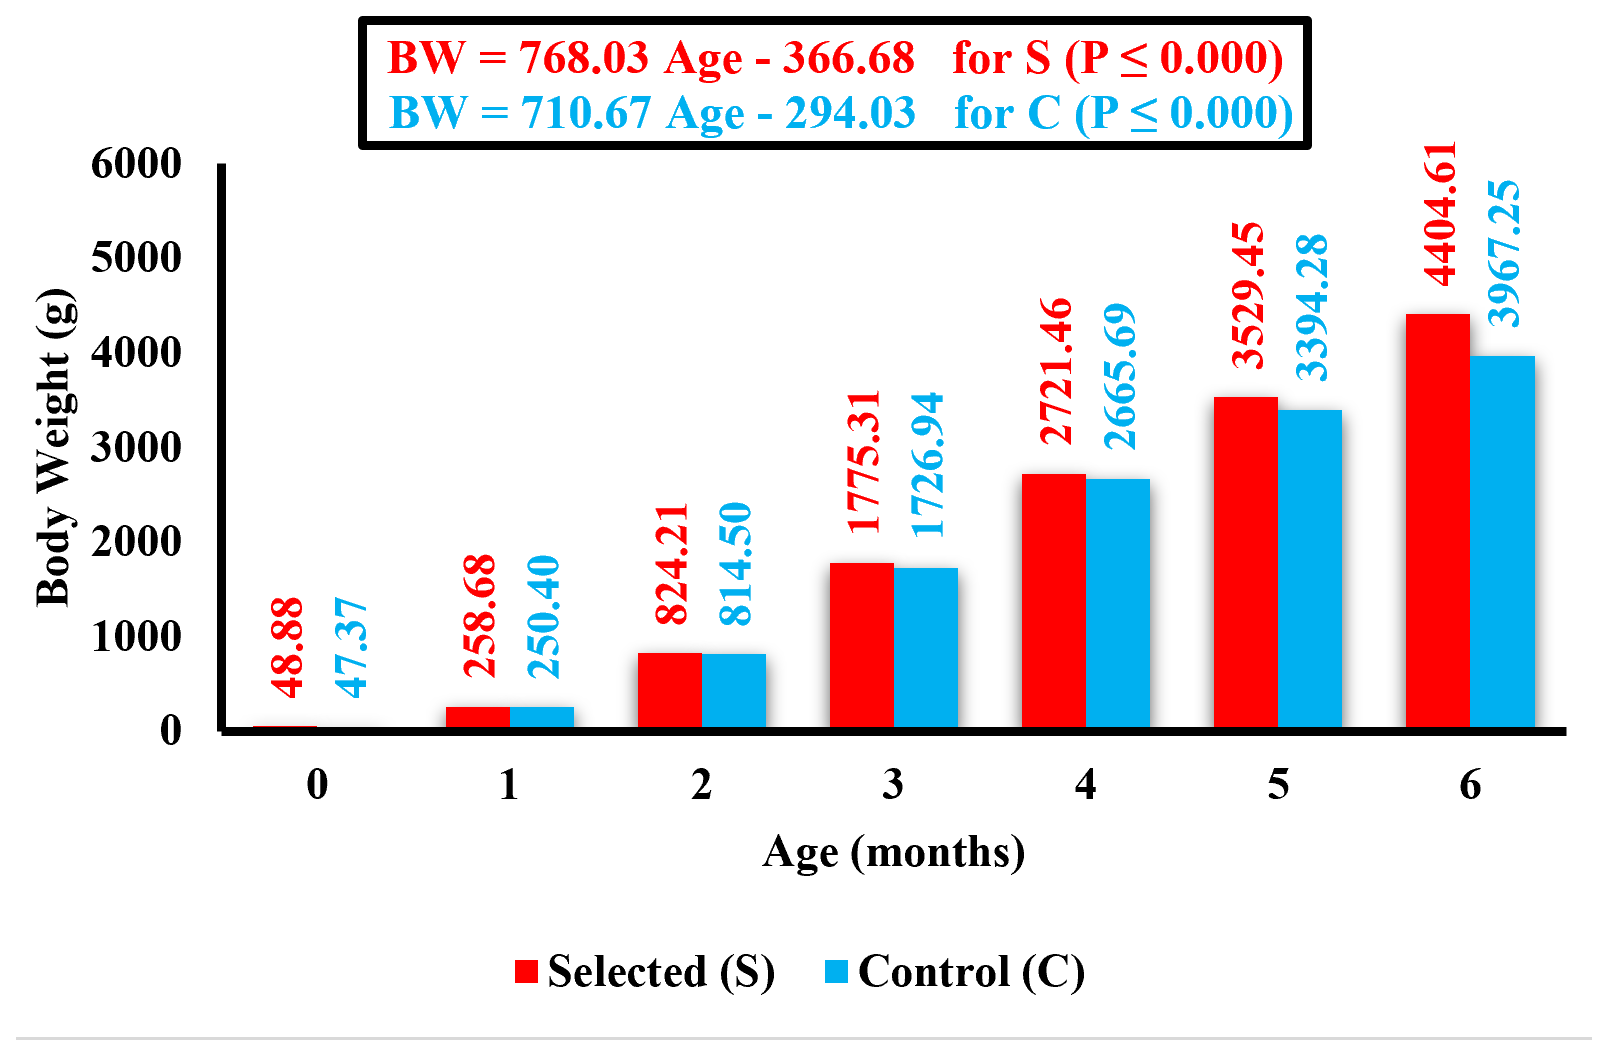
Figure 1Means of BW (g) at different ages (months) for S and C lines along with regression analysis.
3.2 Body measurements at 6 months of age
At 6 months of age, shank length (SL) and breast width (BRW) were significantly greater in the selected line compared with the control line (Table 3). Mean SL values were 15.93 and 15.11 cm for the selected and control lines, respectively, while corresponding BRW values were 29.17 and 28.48 cm. Phenotypic correlations between BW and SL and between BW and BRW were 0.58 and 0.56, respectively. Genetic correlations were 0.69 for BW–SL and 0.97 for BW–BRW (Table 4). Male turkeys showed significantly higher SL and BRW values than females (Table 3).
Table 2Means and standard error (SE) of body weight (g) of turkeys at 6 months of age by line and sex.
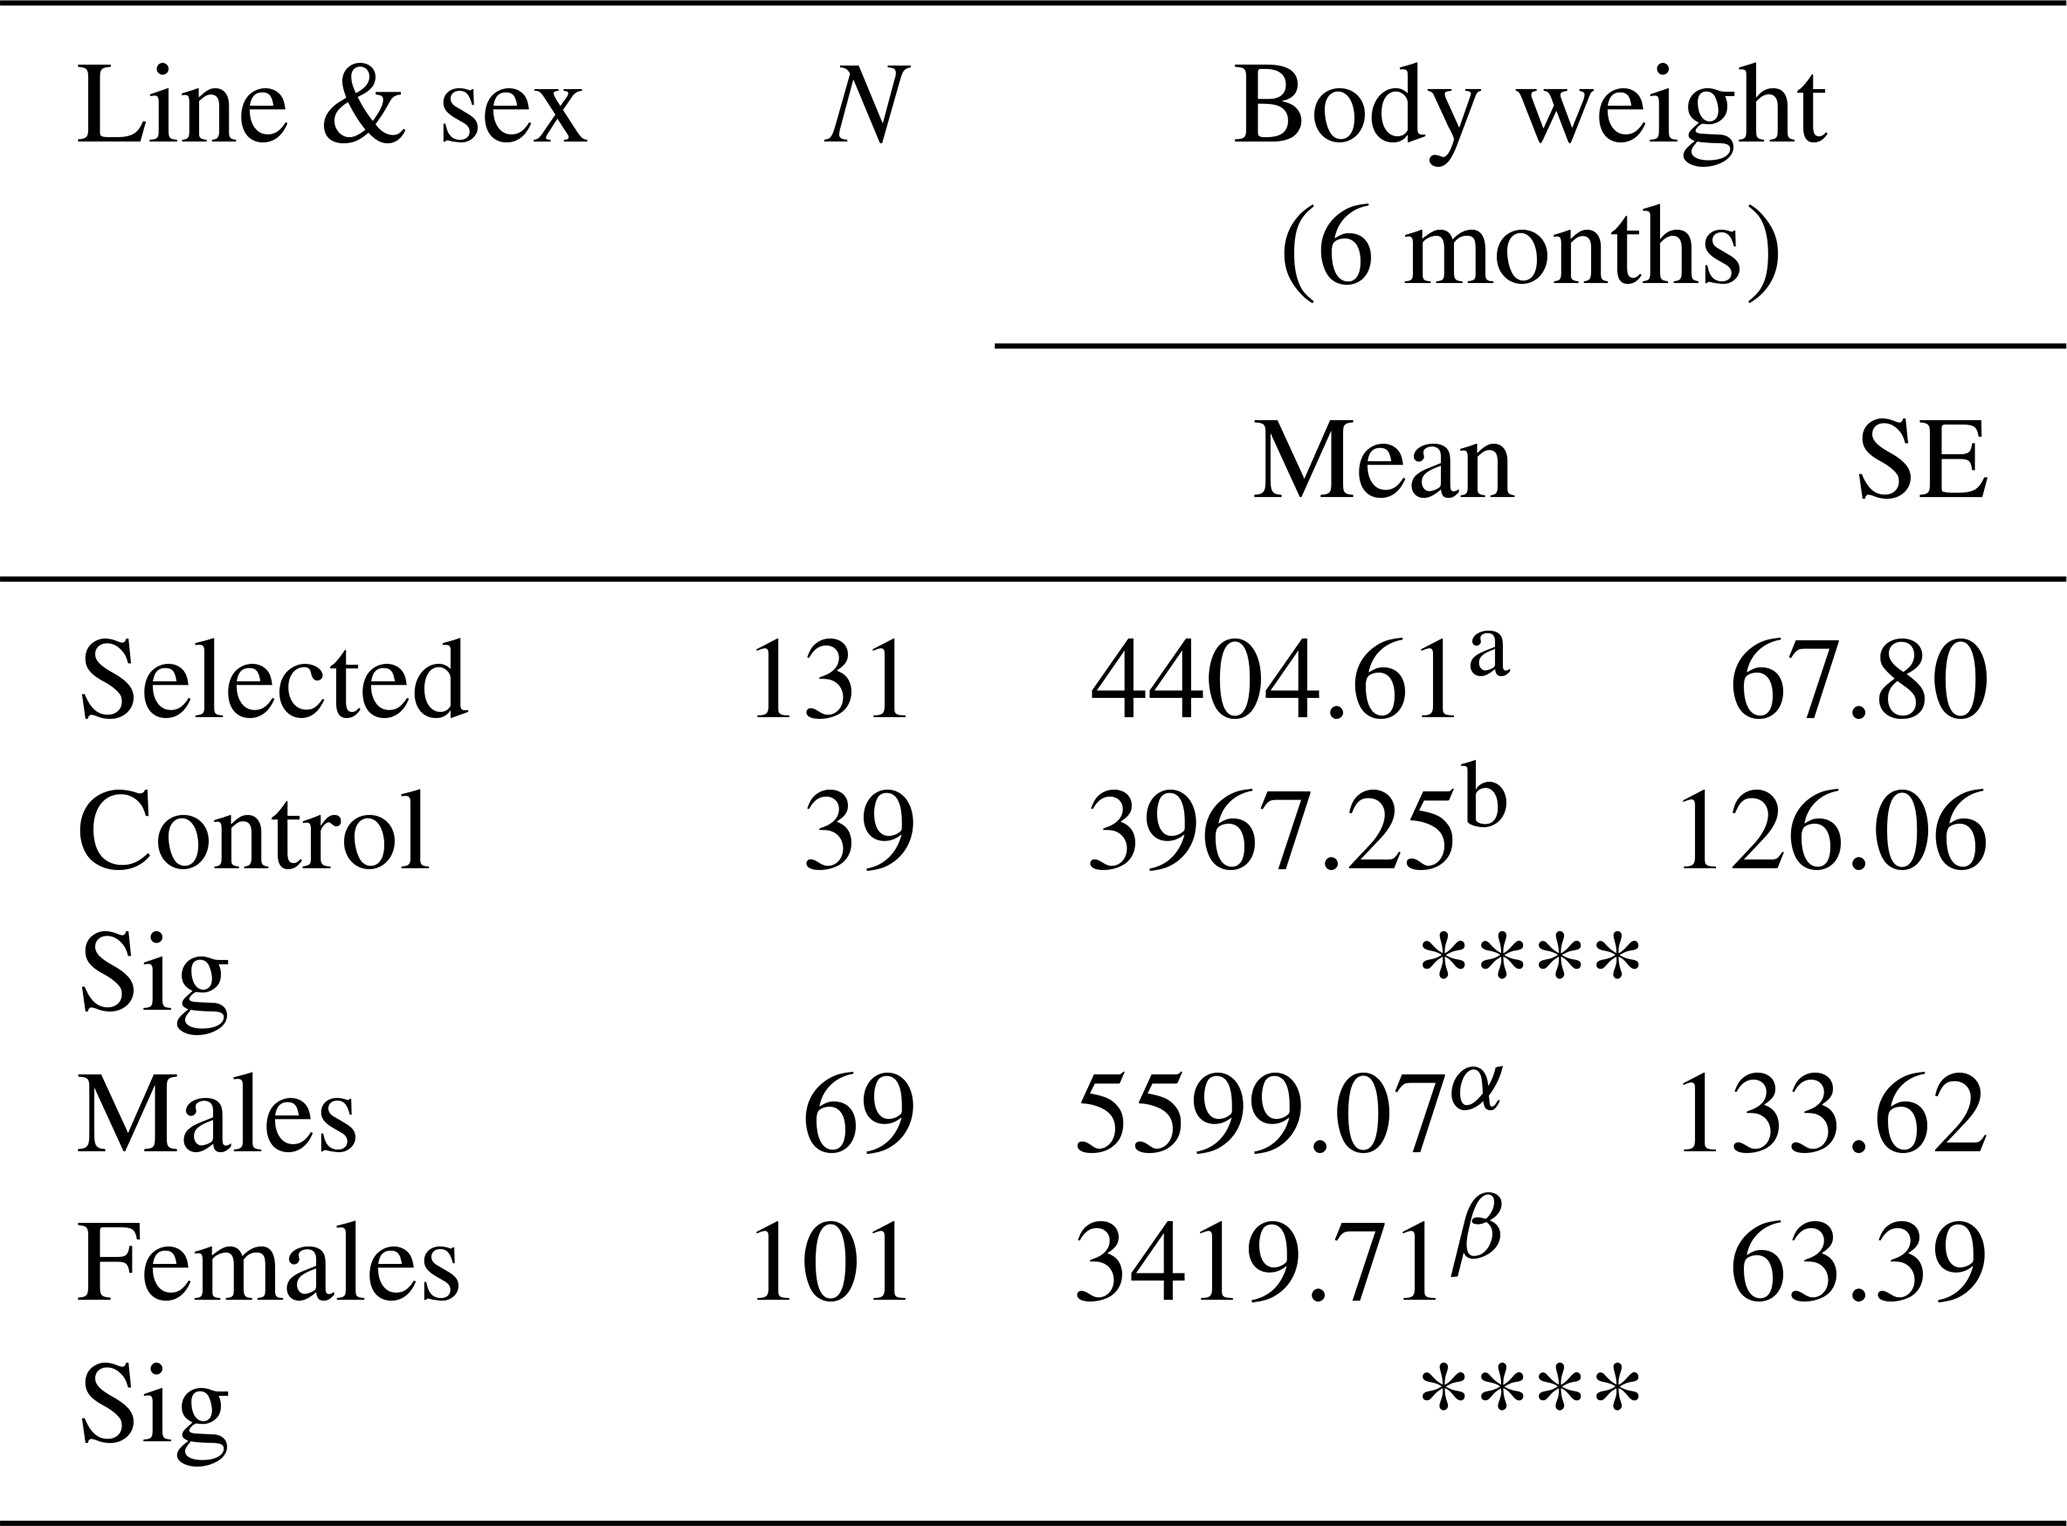
P≤0.0001. Different letters (small and Latin) in the same column indicate significant differences (P≤0.05).
Table 3Means and standard error (SE) of shank length and breast width (cm) at 6 months of age of turkeys by line and sex.
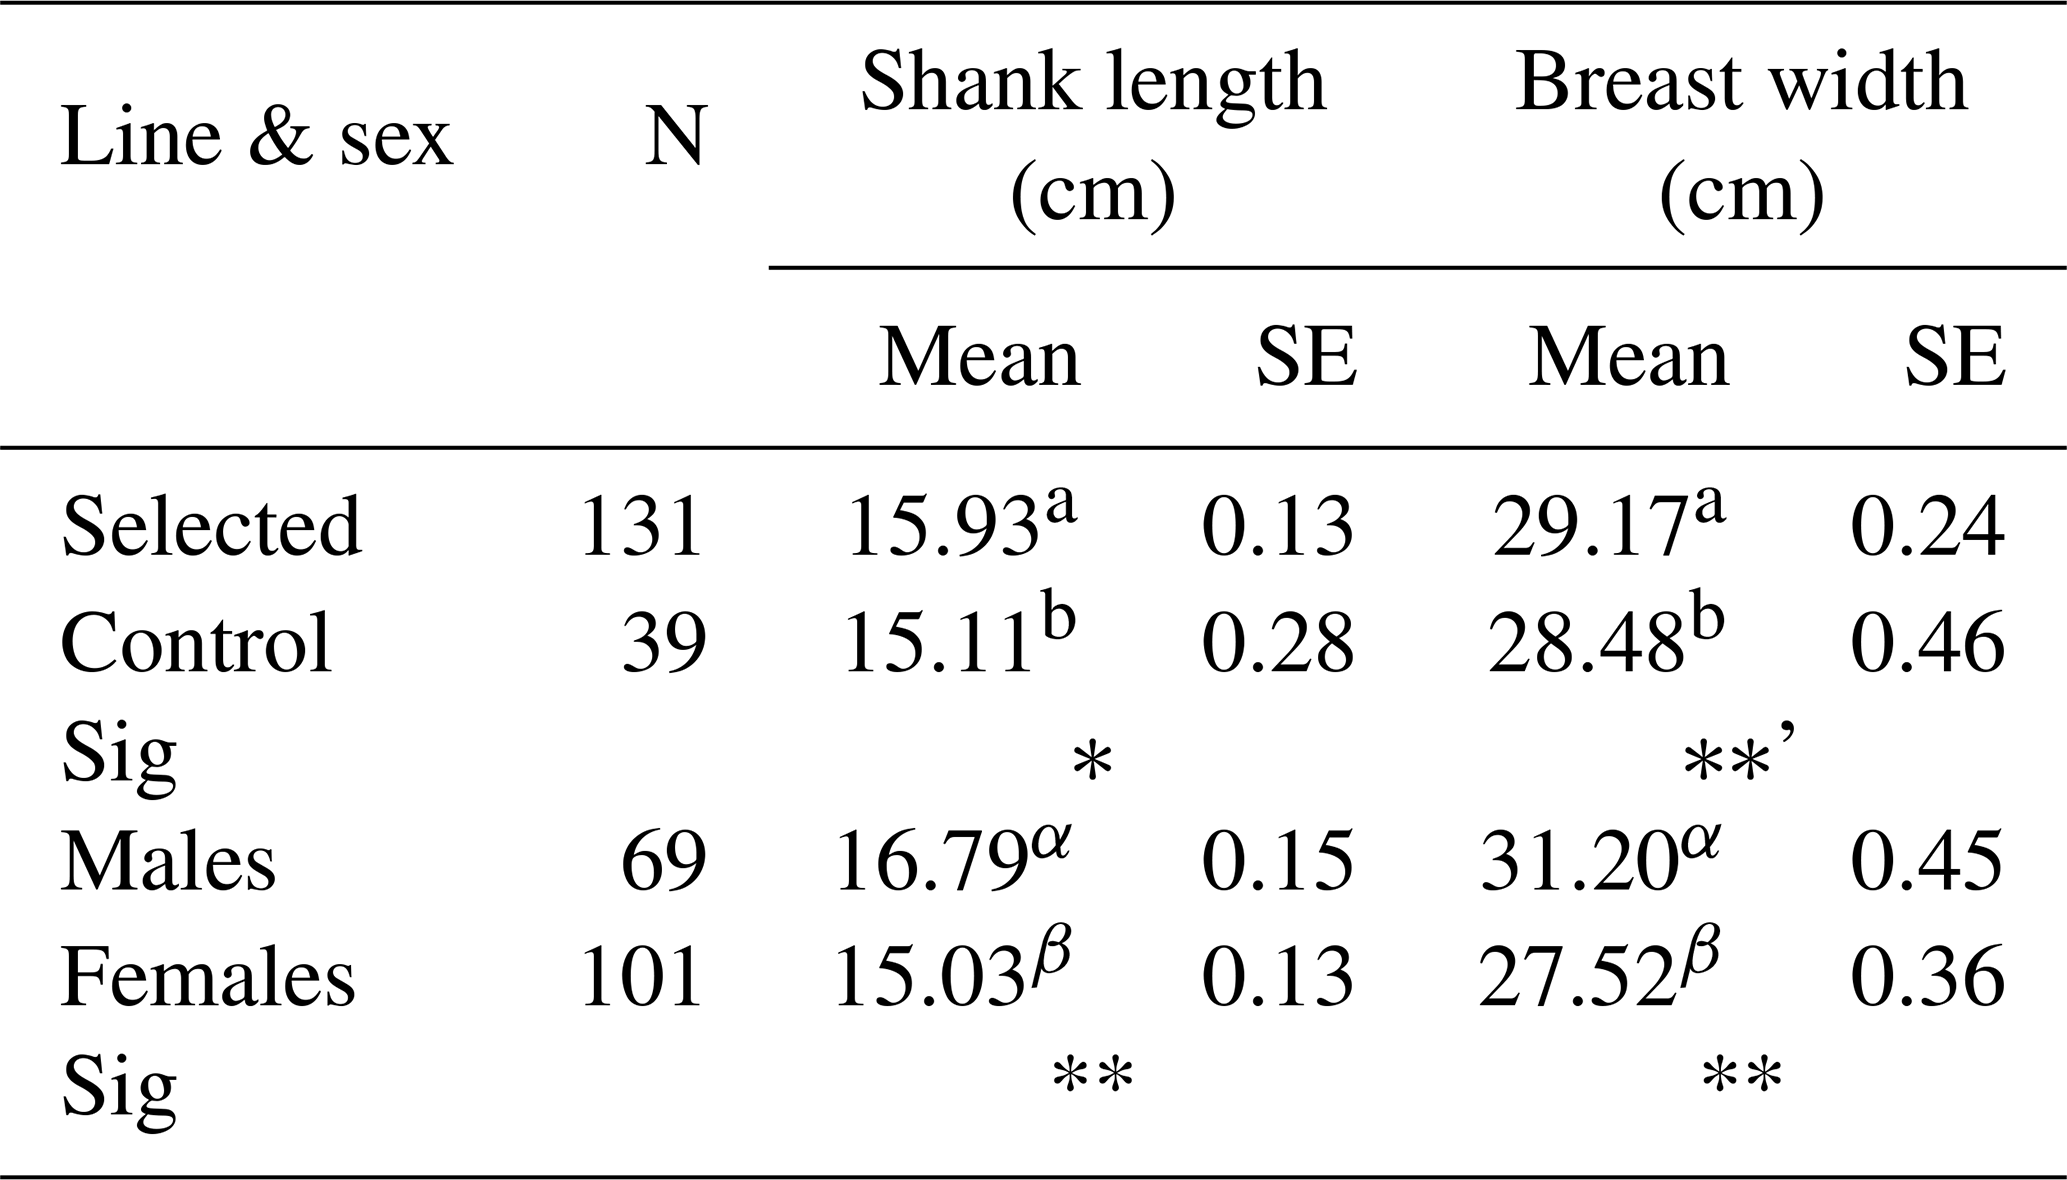
∗ P≤0.05. P≤0.01. Different letters (small and Latin) in the same column indicate significant differences (P≤0.05).
Table 4Heritability estimates (diagonal), phenotypic correlations (above diagonal), genetic correlations (below diagonal), means, phenotypic standard deviation (σp), genetic standard deviations (σg), and economic values (v) were used to construct the selection index.

P≤0.01. Within the parentheses are the standard errors.
3.3 Selection index analysis
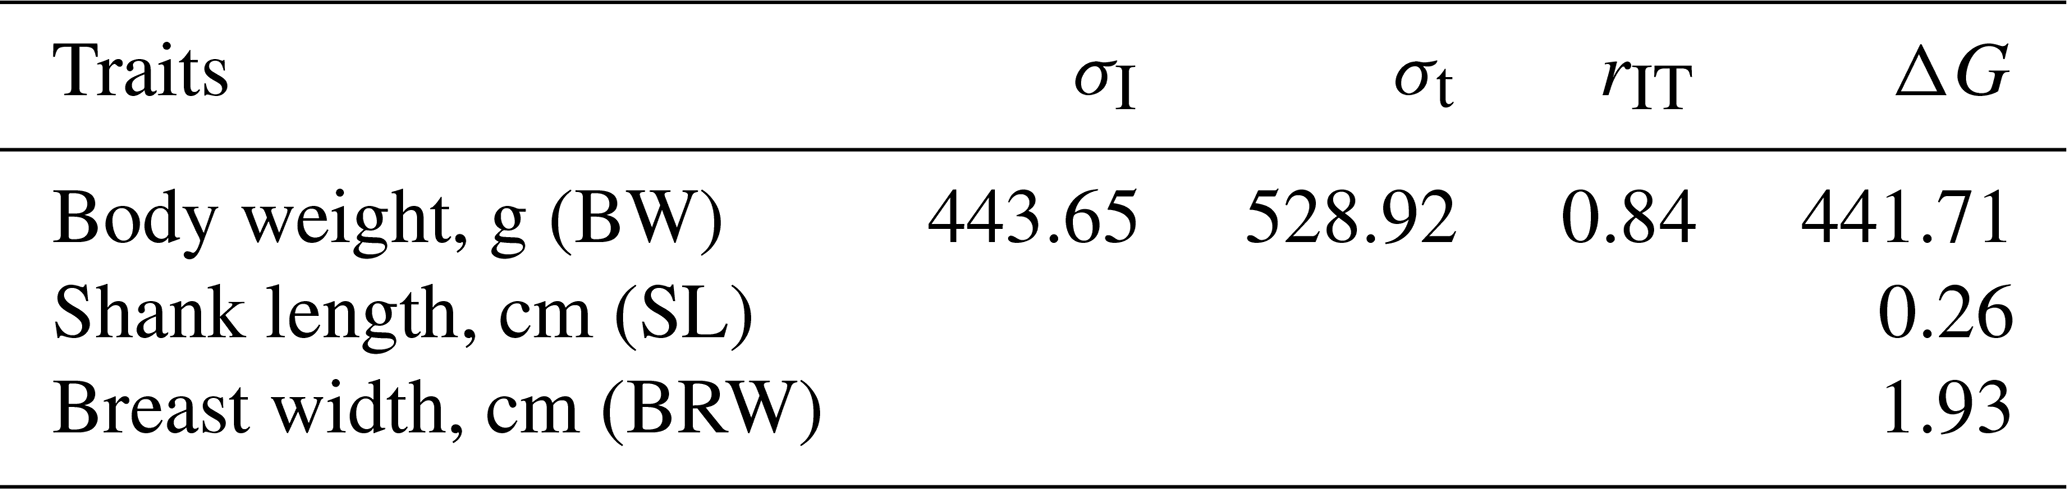
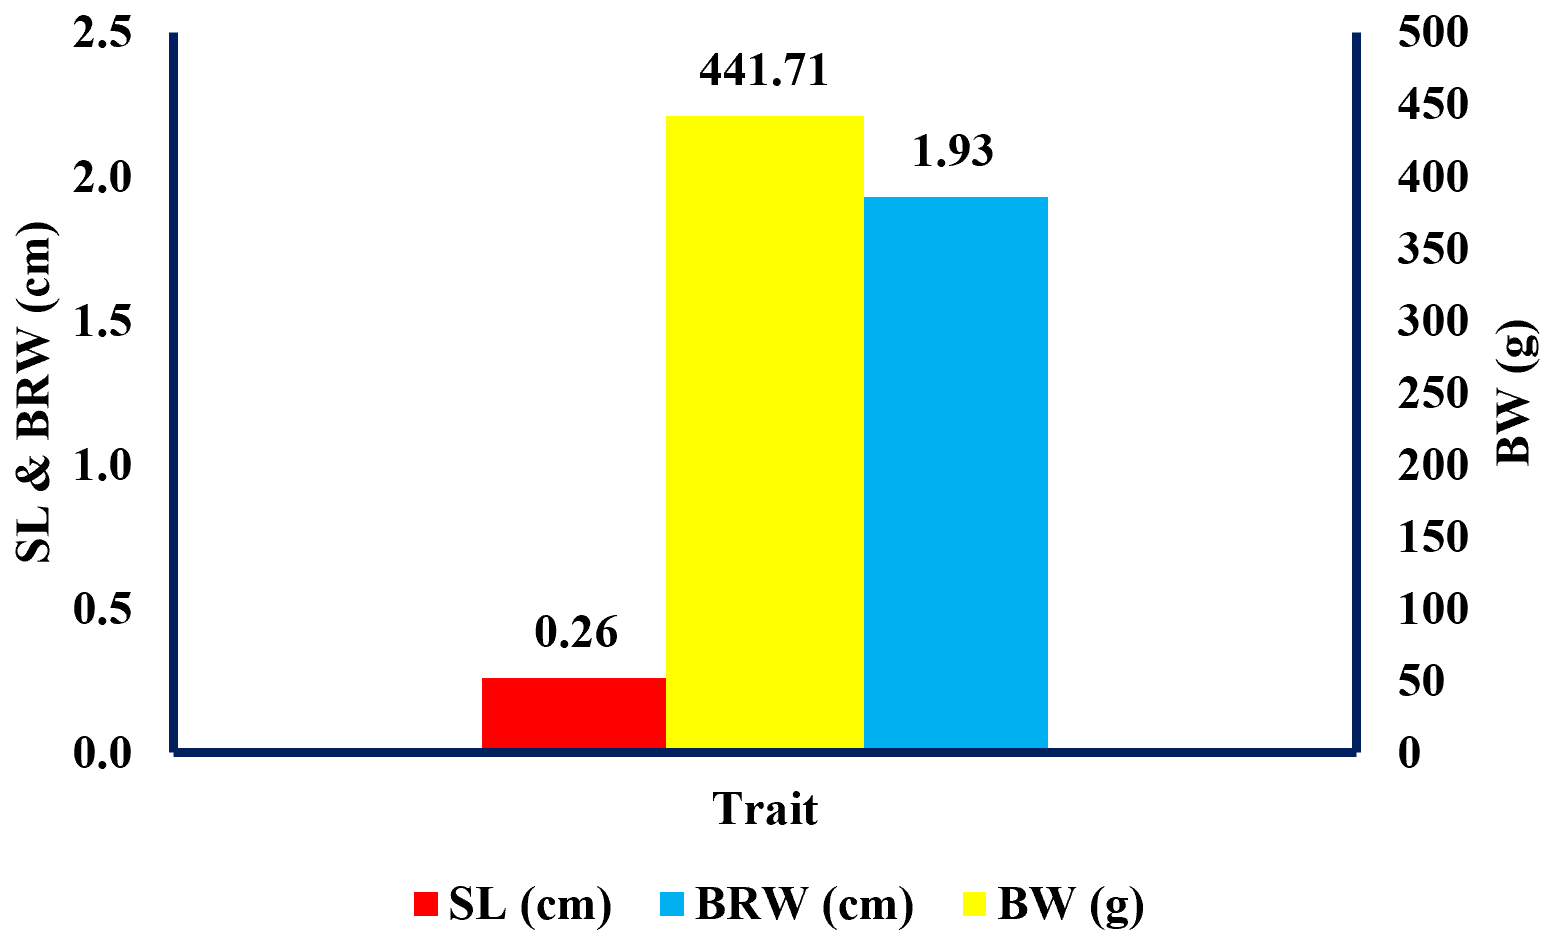
The selection index included BW, SL, and BRW measured at 6 months of age. Estimates of heritability, correlations, means, phenotypic and genetic standard deviations, and relative economic values are presented in Table 4. Regression coefficients of traits on the index (bGiI) were 0.99561 for BW, 0.00058 for SL, and 0.00435 for BRW (Table 5). The corresponding weighting factors (b) were 0.30, −56.64, and 113.00 for BW, SL, and BRW, respectively. The omission of BRW from the index resulted in the highest reduction in overall genetic gain (18.57 %), followed by BW (7.69 %), whereas SL showed the lowest contribution (1.28 %). The standard deviations of the index (σI) and aggregate genotype (σt) were 443.65 and 528.92, respectively, and the correlation between the index and aggregate genotype (rIT) was 0.84 (Table 6). The expected genetic gains per generation were 441.71 g for BW, 0.26 cm for SL, and 1.93 cm for BRW (Table 6 and Fig. 2).
Table 5Regression of each trait on the index (bGiI), weighting factors (b's), and value of each trait (Vt) in the index.
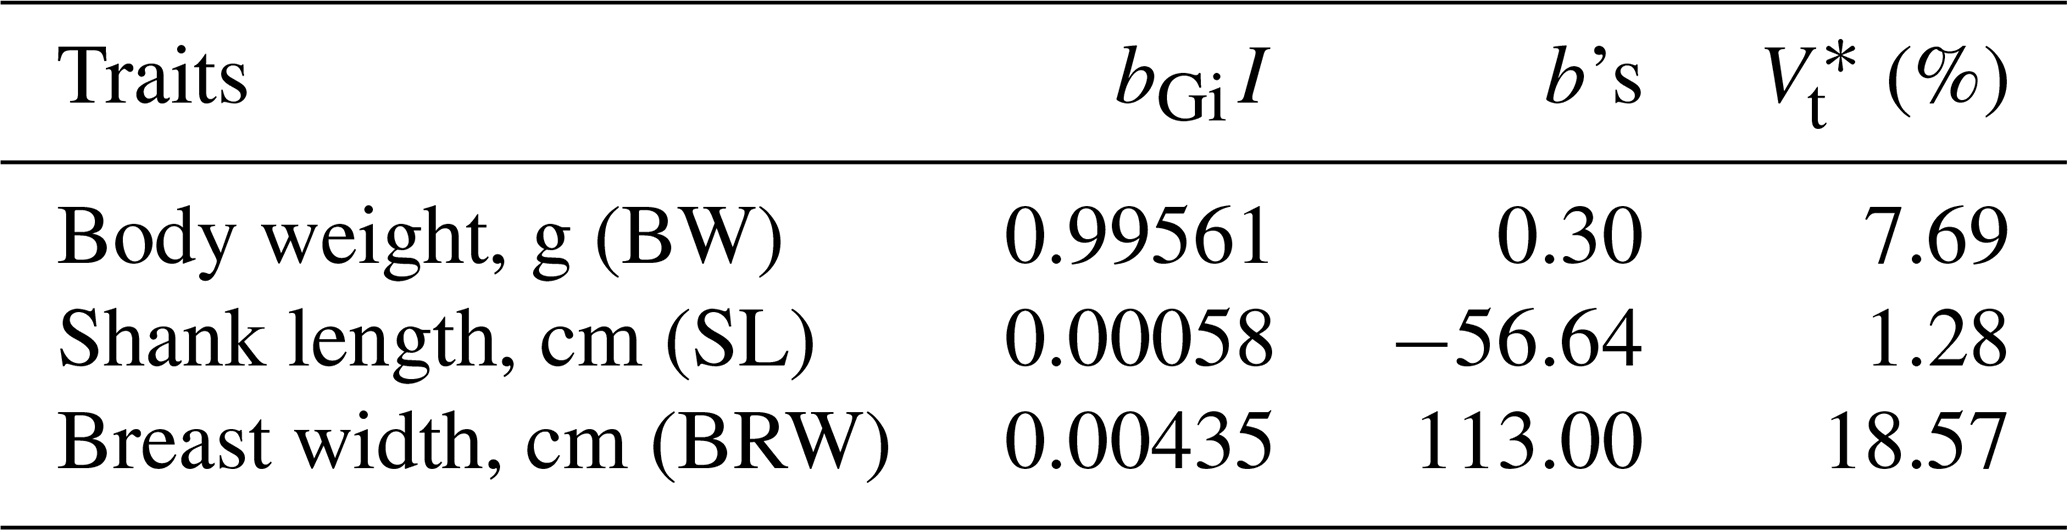
∗ Percent reduction in the rate of overall genetic gain if that trait is omitted.
Table 6The standard deviation of the selection index (σI), the aggregate genotype (σt), the correlation between the index and aggregate genotype (true breeding value) (rIT), and the expected genetic gain (ΔG) for the studied traits using the selection index.
3.4 Growth hormone (GH) gene expression
GH-mRNA expression was evaluated in the breast muscle of selected and control lines in both sexes. GH expression was significantly higher in the selected line than in the control line in both males (1.43 vs. 1.01 relative gene expression; Fig. 3) and females (1.76 vs. 1.31 relative gene expression; Fig. 4). Females also exhibited significantly higher GH expression than males. The selected line, which had higher body weight at 6 months of age, also showed higher GH expression than the control line.
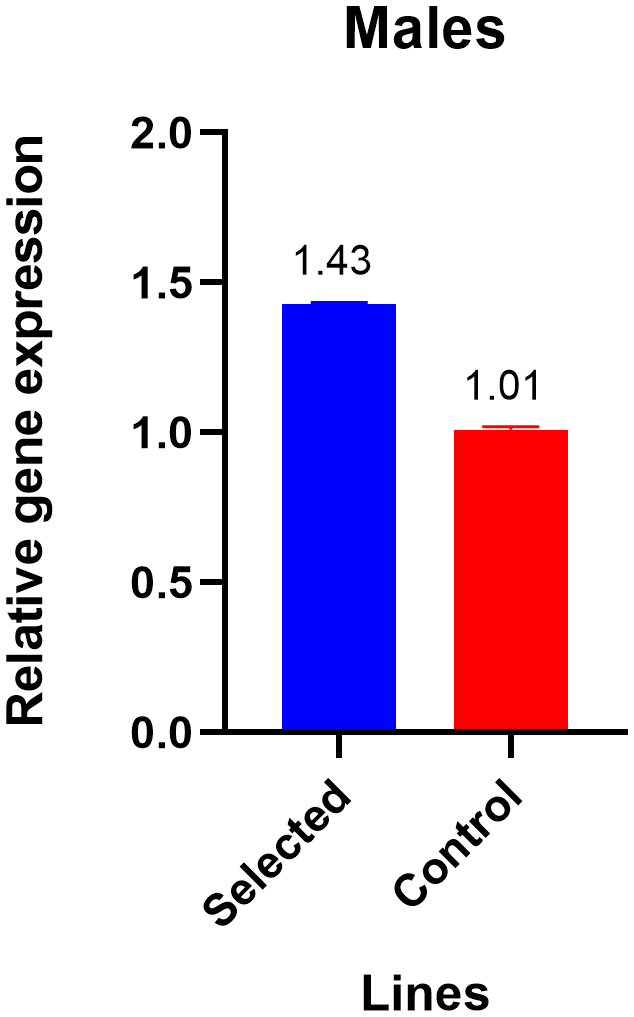
Figure 3mRNA expression analysis of the GH gene using qRT-PCR for the selected and control lines of turkey males.
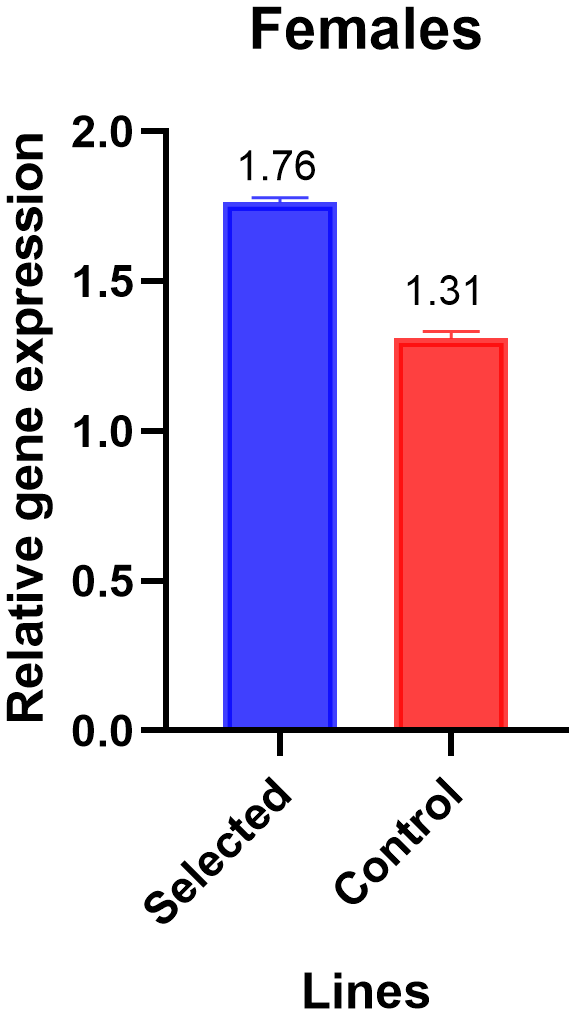
Figure 4mRNA expression analysis of the GH gene using qRT-PCR for the selected and control lines of turkey females.
The consistently higher body weight observed in the selected line across all ages confirms the effectiveness of individual selection for BW at 6 months of age. Similar trends were reported by Sabra et al. (2017), Ogah (2011), and other studies, indicating that sustained genetic improvement in BW can be achieved through targeted selection.
The significant positive phenotypic and genetic correlations between BW and body measurements (SL and BRW) suggest that these traits share common genetic control. This explains the correlated response observed in body dimensions following selection for BW. The strong genetic correlation between BW and BRW (0.97) indicates that BRW is a particularly reliable indirect selection criterion for improving body weight and meat yield.
Selection index analysis demonstrated that BRW contributed the most to overall genetic gain, followed by BW, while SL contributed the least. This highlights the importance of incorporating BRW into breeding objectives to improve growth and carcass traits. Similar findings were reported by Oblakova (2006), Aslam et al. (2011), and Rajkumar et al. (2023), who emphasized the superiority of selection indices over single-trait selection.
The high accuracy of the selection index (rIT= 0.84) confirms its effectiveness in ranking individuals based on aggregate breeding value. The expected genetic gains indicate that selection using this index can simultaneously improve BW and associated body measurements, provided sufficient genetic variation is present in the base population.
The higher GH-mRNA expression observed in the selected line supports the hypothesis that molecular genetic mechanisms underpin phenotypic improvement in growth traits. The growth hormone plays a central role in regulating growth rate, muscle development, and metabolism through the GH/IGF-1 axis. The observed sex differences in GH expression, with higher levels in females, are consistent with previous reports (Numair et al., 2023; Sinpru et al., 2021).
Previous studies have reported associations between GH gene polymorphisms, GH-mRNA expression, and growth-related traits in poultry (Ghelghachi et al., 2013; Jia et al., 2018; El-Attrouny et al., 2020; Sinpru et al., 2021; Mohamed Ali et al., 2024). However, gene polymorphisms and gene expression represent different biological aspects and should be interpreted separately. The higher GH-mRNA expression observed in the selected line is consistent with its superior growth performance, although the present study does not establish a causal relationship between selection and GH gene upregulation. The higher GH expression may reflect differences associated with the selected phenotype rather than a direct effect of selection itself. Given the well-established role of the GH/IGF-1 axis in regulating muscle development and growth, the observed expression pattern supports the hypothesis that GH may contribute to growth differences between the two lines.
Overall, the findings demonstrate that traditional selection improved phenotypic performance in the selected turkey line and was associated with higher GH-mRNA expression. These results suggest that phenotypic improvement and differences in GH-mRNA expression occurred concurrently; however, the present study does not establish a causal relationship between selection and changes in GH expression. Further studies are needed to clarify the biological mechanisms underlying this association and to evaluate the potential of GH expression as a molecular indicator in turkey breeding programs.
This study demonstrates that traditional breeding using a selection index effectively improved growth performance and economically important traits in the selected turkey line. The observed differences in GH-mRNA expression between the selected and control lines suggest that GH-mRNA expression is associated with growth performance, although its value as a molecular marker requires further validation. Integrating conventional phenotypic selection with molecular analyses may provide additional insights into the biological mechanisms underlying genetic improvement.
The data sets used in this article can be requested from the corresponding author.
MKS supervised and designed the study, drafted the paper, and analyzed the data. MHK designed the study, drafted the paper, and helped with the practical experiment. AAA, MMA, EMA, and IAS designed the study, helped with the practical experiment, and drafted the paper. All authors have read, reviewed, and approved the final article.
The contact author has declared that none of the authors has any competing interests.
The animals in this study were slaughtered at the certified slaughterhouse of the Faculty of Agriculture, Alexandria University. All experimental procedures, including the terminal slaughter for tissue collection, were reviewed and approved in accordance with the Alexandria University ethics code and national regulations (approval no. Alex. Agric. 092503205).
Publisher's note: Copernicus Publications remains neutral with regard to jurisdictional claims made in the text, published maps, institutional affiliations, or any other geographical representation in this paper. The authors bear the ultimate responsibility for providing appropriate place names. Views expressed in the text are those of the authors and do not necessarily reflect the views of the publisher.
The Poultry Research Centre, Poultry Production Department, Faculty of Agriculture, Alexandria University; the Genetic Engineering and Biotechnology Laboratory, Plant Pathology Department, Genetic Branch, Faculty of Agriculture, Damanhour University; and the Desert Research Centre, Ministry of Agriculture, Egypt provided technical support for this study. The authors would like to thank the staff of the Poultry Research Centre, the Genetic Engineering and Biotechnology Laboratory, and the Desert Research Centre for guidance and technical support. The authors did not receive any funds for this study.
This paper was edited by Henry Reyer and reviewed by Abimbola Deborah Matt-Obabu and one anonymous referee.
Abdalla, E. A., Wood, B. J., and Baes, C. F.: Accuracy of breeding values for production traits in turkeys (Meleagris gallopavo) using recursive models with or without genomics, Genet. Sel. Evol., 53, 1–10, https://doi.org/10.1186/s12711-021-00611-8, 2021.
Abd El-Motaleb, A. A., Khalil, M. H., Abdel-Rahman, M. M., Amin, E. M., Abousoliman, I., and Shebl, M. K.: Association of Cytochrome and NADH genes polymorphism with growth traits in turkeys selected for higher body weight, Egyptian Poultry Science Journal, 45, 1–17, 2025.
Ali, S. A. M., Kosba, M. A., Eldlebshany, A. E., Abd El-Rahman, M. M., and Soliman, A. S. A.: Evaluate the impact of selection for body weight on growth performance in Alexandria local chickens, Egyptian Poultry Science Journal, 44, 111–122, https://doi.org/10.21608/epsj.2024.354786, 2024.
Amin, E.: Effect of repeated backcrossing for two generations between the local black Baladi and white Nicholas turkeys on egg production and hatch traits 1-egg production traits, Egyptian Poultry Science Journal, 34, 187–211, https://journals.ekb.eg/article_5312_ebc349249e8dc5f8a6bb92d6cf37750a.pdf (last access: 15 August 2019), 2014.
Antar, R. I., Shosha, S. M., Elazab, M. E., and Esmail, R. S.: Genetic and Hormonal Difference between High Growth Rate Breed (Cobb Broiler chicken) and Low Growth Rate Breed (Native Fayoumi chicken), Benha Veterinary Medical Journal, 39, 28–33, https://doi.org/10.21608/bvmj.2020.36634.1229, 2020.
Aslam, M. L., Bastiaansen, J. W., Crooijmans, R. P., Ducro, B. J., Vereijken, A., and Groenen, M. A.: Genetic variances, heritabilities, and maternal effects on body weight, breast meat yield, meat quality traits, and the shape of the growth curve in turkey birds, BMC Genetics, 12, 1–9, https://doi.org/10.1186/1471-2156-12-14, 2011.
Baldi, D. and Gottardo, A.: Livestock production to feed the planet: Animal protein: A forecast of global demand over the next years, Rel: Beyond Anthropocentrism, 5, 65, https://doi.org/10.7358/rela-2017-001-bald, 2017.
Becker, W. A.: Manual of Quantitative Genetics, fourth edn., Academic Enterprises, Washington, USA, https://www.cabidigitallibrary.org/action/doSearch?do=Manual of quantitative genetics (last access: 19 August 2019), 1984.
Begli, H. E., Wood, B. J., Abdalla, E. A., Balzani, A., Willems, O., Schenkel, F., and Baes, C. F.: Genetic parameters for clutch and broodiness traits in turkeys (Meleagris Gallopavo) and their relationship with body weight and egg production, Poultry Sci., 98, 6263–6269, https://doi.org/10.3382/ps/pez446, 2019.
Bustin, S. A., Benes, V., Garson, J. A., Hellemans, J., Huggett, J., Kubista, M., Mueller, R., Nolan, T., Pfaffl, M. W., and Shipley, G. L.: The MIQE Guidelines: Minimum Information for Publication of Quantitative Real-Time PCR Experiments, Oxford University Press, 611–622, https://doi.org/10.1373/clinchem.2008.112797, 2009.
Cunningham, E.: Animal breeding theory. Landbrukshofhandelen, Universities for Laget, Vollebek, Oslo, https://openlibrary.org/works/OL4281130W/Animal_breeding_theory?utm_source=chatgpt.com (last access: 12 August 2019), 1969.
Duncan, D. B.: Multiple range and multiple F-tests, Biometrics, 11, 1–42, https://www.jstor.org/stable/3001478 (last access: 20 August 2019), 1955.
El-Attrouny, M. M., Manaa, E. A., and Ramadan, S. I.: Genetic evaluation and selection correlated response of growth traits in Japanese quail, S. Afr. J. Anim. Sci., 50, 325–333, https://doi.org/10.4314/sajas.v50i2.16, 2020.
Ellestad, L. E., Cogburn, L. A., Simon, J., Le Bihan-Duval, E., Aggrey, S. E., Byerly, M. S., Duclos, M. J., and Porter, T. E.: Transcriptional profiling and pathway analysis reveal differences in pituitary gland function, morphology, and vascularization in chickens genetically selected for high or low body weight, BMC Genomics, 20, 1–21, https://doi.org/10.1186/s12864-019-5670-9, 2019.
El-Tahawy, W. S., Ghanem, H. H., Nawar, A., and Sabra, E.; Genetic improvement of some performance traits of Egyptian local chickens by transferring growth hormone gene from broiler, Egyptian Poultry Science Journal, 41, 351–367, https://doi.org/10.21608/epsj.2025.76131.1162, 2021.
Falconer, D. S. and Mackay, F. C.: Introduction to quantitative genetics. Fourth edition. Longman Group, Harlow, Essex, England, 108–183, https://doi.org/10.1093/genetics/167.4.1529, 1996.
FAO: FAOSTAT, Food and Agriculture Organization of the United Nations, http://www.fao.org/faostat/en/ (last access: 27 August 2019), 2023.
Ghelghachi, A. A., Seyedabadi, H. R., and Lak, A.: Association of growth hormone gene polymorphism with growth and fatness traits in Arian broilers, International Journal of Biosciences, 3, 216–220, https://doi.org/10.12692/ijb/3.12.216-220, 2013.
Holland, J. B.: Estimating genotypic correlations and their standard errors using multivariate restricted maximum likelihood estimation with SAS Proc MIXED, CROP SCI., 46, 642–654, https://doi.org/10.2135/cropsci2005.0191, 2006.
IBM SPSS Statistics: IBM SPSS Statistics for Windows, Version 28, IBM Corp, Armonk, NY, 13, https://www.ibm.com/support/pages/ibm-spss-statistics-28-documentation?utm_source=chatgpt.com (last access: 26 August 2019), 2021.
Jakhrani, S. A., Ujan, J. A., Ujjan, S. A., and Ghumro, S.; Diversity of the Chicken Growth Hormone Gene and Effects on Growth Desi and Fayoumi Chicken Traits at District Kashmore, Sindh, Pakistan, International Journal of Genetics, 12, 68–73, https://doi.org/10.11648/j.ijgg.20241203.13, 2024.
Jia, J., Ahmed, I., Liu, L., Liu, Y., Xu, Z., Duan, X., Li, Q., Dou, T., Gu, D., Rong, H., and Wang, K.: Selection for growth rate and body size has altered the expression profiles of somatotropic axis genes in chickens, Plos One, 13, e0195378, https://doi.org/10.1371/journal.pone.0195378, 2018.
Kálmán, Á. and Szőllősi, L.: Global tendencies in turkey meat production, trade, and consumption, Acta Agraria Debreceniensis, 2, 83–89, https://doi.org/10.34101/actaagrar/2/12594, 2023.
Khattree, R. and Naik, D. N.: Multivariate data reduction and discrimination with SAS software. SAS Institute Inc., Cary, NC, https://www.researchgate.net/profile/Ravi-Khattree/publication/342819443_Multivariate_Data_ Reduction_and_Discrimination_with_SAS_Software/links/ 5f0751ea92851c52d624bb2d/Multivariate-Data-Reduction-and-Discrimination-with-SAS-Software.pdf (last access: 13 August 2019), 2000.
Lamont, S. J.: Selection for immune response in chickens. Presented at the 40th annual national breeder round table, 2–3 May 1991, St. Louis, Missouri, https://scholar.google.com/scholar?hl=en&as_sdt=0,5&q=Lamont, S.J. (1991). Selection for immune response in chickens. Presented at the 40th Annual National Breeder Round Table, May 2-3. St. Louis, Missouri.&btnG= (last access: 3 August 2019), 1991.
Lanes, R.: Metabolic Benefits of Growth Hormone Therapy, Growth Hormone Deficiency: Physiology and Clinical Management, 79–92, https://doi.org/10.1007/978-3-319-28038-7, 2016.
Livak, K. J. and Schmittgen, T. D.: Analysis of Relative Gene Expression Data Using Real-Time Quantitative PCR and the 2-AACT Method, Methods, 25, 402–408, https://doi.org/10.1006/meth.2001.1262, 2001.
Mariandayani, H. N., Darwati, S., Khaerunnisa, I., and Prasasty, V. D.: Growth performance of Indonesian three-breed cross chicken associated with growth hormone and insulin-like growth factor 2 genes, Veterinary World, 16, 2471, https://doi.org/10.14202/vetworld.2023.2471-2478, 2023.
Mostafa, M. H.: Assessment of RAPD markers variability of local turkey (MELEAGRIS GALLOPAVO) population in Egypt, Egyptian Poultry Science Journal, 39, 615–624, 2019.
NRC: National Research Council, and Subcommittee on Poultry Nutrition, Nutrient requirements of poultry, National Academies Press, https://www.nap.edu/catalog/2114.html (last access: 24 August 2019), 1994.
Numair, M., Eltahawy, W., Abdel-Rahman, M., and El-Raffa, A.: Genetic Improvements for Productive Performance of White Japanese Quail Under Selection Program, Journal of Agricultural and Environmental Sciences, 22, 285–308, https://doi.org/10.21608/jaesj.2023.205557.1078, 2023.
Oblakova, M.: Characteristic of Some Productive Indexes of Turkey Lines at the Age of 20 Weeks, Bulg. J. Agric. Sci., 12, 133–143, 2006.
Ogah, D. M.: Assessing size and conformation of the body of Nigerian indigenous turkey, Slovak Journal of Animal Science, 44, 21–27, https://office.sjas-journal.org/index.php/sjas/article/view/297 (last access: 11 August 2019), 2011.
Rajkumar, U., Prince, L. L. L., Huanshi, S., Jayakumar, S., Ravindra, K. R., Niranjan, M., and Chatterjee, R. N.: Does selection index application for highly heritable traits need revisiting – A comprehensive study with body weight and shank length in Vanaraja male line chicken, Indian J. Anim. Sci., 93, 1021–1025, https://doi.org/10.56093/ijans.v93i10.135284, 2023.
Sabra, Z. A. M., El-Sawy, M. A., and Ibrahim, S. E.: Genetic Evaluation for Some Growth and Body Measurements Traits in Bronze Turkey Raised in Egypt, Journal of Animal and Poultry Production, 8, 303–309, https://doi.org/10.21608/jappmu.2017.45985, 2017.
Salter, A. M.: Improving the sustainability of global meat and milk production, P. Nutr. Society, 76, 22–27, https://doi.org/10.1017/S0029665116000276, 2017.
SAS: Statistical User's Guide. Statistical Analysis System, INT., Cary, NC, USA, https://support.sas.com/documentation/cdl/en/statug/63033/HTML/default/viewer.htm#titlepage.htm (last access: 2 August 2019), 2009.
Sheffield, S., Fiorotto, M. L., and Davis, T. A.: Nutritional importance of animal-sourced foods in a healthy diet, Frontiers in Nutrition, 11, 1424912, https://doi.org/10.3389/fnut.2024.1424912, 2024.
Sinpru, P., Bunnom, R., Poompramun, C., Kaewsatuan, P., Sornsan, S., Kubota, S., Molee, W., and Molee, A.: Association of growth hormone and insulin-like growth factor I genotype with body weight, dominance of body weight, and mRNA expression in Korat slow-growing chickens, Animal Bioscience, 34, 1886. https://doi.org/10.5713/ab.20.0729, 2021.
Vasilatos-Younken, R., Gray, K. S., Bacon, W. L., Nestor, K. E., Long, D. W., and Rosenberger, J. L.: Ontogeny of growth hormone (GH) binding in the domestic turkey: evidence of sexual dimorphism and developmental changes in relationship to plasma GH, J. Endocrinol., 126, 131–139, https://doi.org/10.1677/joe.0.1260131, 1990.
Wang, B., Wang, L., Duan, H., Chong, P., Su, S., Shan, L., Yi, D., and Li, Y.: Selection and validation of reference genes for quantitative real-time PCR analysis of Nitraria tangutorum, ResearchSquare, https://doi.org/10.21203/rs.2.21923/v1, 2020.
Wellmann, R.: Selection index theory for populations under directional and stabilizing selection, Genet. Sel. Evol., 55, 10, https://doi.org/10.1186/s12711-023-00776-4, 2023.
Yamamoto, M. and Bando, H.: A new insight into GH regulation and its disturbance from nutrition and autoimmune perspectives, Endocr. J., 70, 867–874, https://doi.org/10.1507/endocrj.ej23-0264, 2023.
Yang, M., Hu, B., Sun, D., Zhao, C., Wei, H., Li, D., Liao, Z., Zhao, Y., Liang, J., Shi, M., and Luo, Q.: Growth hormone receptor gene influences mitochondrial function and chicken lipid metabolism by AMPK-PGC1α-PPAR signaling pathway, BMC Genomics, 23, 219, https://doi.org/10.1186/s12864-021-08268-9, 2022.
Zhou, X. Y., Ma, J. N., Shen, Y. Y., Xie, X. R., and Ren, W.: Effects of Growth Hormone on Adult Human Gonads: Action on Reproduction and Sexual Function, Int. J. Endocrinol., 2023, 7492696, https://doi.org/10.1155/2023/7492696, 2023.
Zhu La, A. L. T., Feng, Y., Hu, D., Feng, Y., Jin, X., Liu, D., Guo, Y., Cheng, G., and Hu, Y.: Enzymatically prepared alginate oligosaccharides improve broiler chicken growth performance by modulating the gut microbiota and growth hormone signals, J. Anim. Sci. Biotechno., 14, 96, https://doi.org/10.1186/s40104-023-00887-4, 2023.