
the Creative Commons Attribution 4.0 License.
the Creative Commons Attribution 4.0 License.
 | 20 Sep 2021
Transcriptomic profile of leg muscle during early growth and development in Haiyang yellow chicken
Yulin Wu
Shanshan Zhang
Tao Zhang
Genxi Zhang
Jinyu Wang
Skeletal muscle growth and development from embryo to adult consists of a series of carefully regulated changes in gene expression. This study aimed to identify candidate genes involved in chicken growth and development and to investigate the potential regulatory mechanisms of early growth in Haiyang yellow chicken. RNA sequencing was used to compare the transcriptomes of chicken muscle tissues at four developmental stages. In total, 6150 differentially expressed genes (DEGs) (|fold change| ≥ 2; false discovery rate (FDR) ≤ 0.05) were detected by pairwise comparison in female chickens. Functional analysis showed that the DEGs were mainly involved in the processes of muscle growth and development and cell differentiation. Many of the DEGs, such as MSTN, MYOD1, MYF6, MYF5, and IGF1, were related to chicken growth and development. The Kyoto Encyclopedia of Genes and Genomes (KEGG) pathway analysis showed that the DEGs were significantly enriched in four pathways related to growth and development: extracellular matrix (ECM)–receptor interaction, focal adhesion, tight junction, and insulin signalling pathways. A total of 42 DEGs assigned to these pathways are potential candidate genes for inducing the differences in growth among the four development stages, such as MYH1A, EGF, MYLK2, MYLK4, and LAMB3. This study identified a range of genes and several pathways that may be involved in regulating early growth.
- Article
(1144 KB) - Full-text XML
-
Supplement
(9700 KB) - BibTeX
- EndNote


Skeletal muscle, which accounts for approximately 40 % of the body weight of mammals, is an important tissue involved in the regulation of metabolism, locomotion and strength (Frontera and Ochala, 2015). A reduction in skeletal muscle mass resulted in weakness and impaired mobility and, if severe enough, increased morbidity and mortality (Coelen et al., 2015; Szulc et al., 2010). In livestock production, skeletal muscle develops into meat, which is the primary terminal product for human consumption. Therefore, the study of muscle development in agriculturally important species is essential to achieving increased body weight and muscle mass.
The embryonic stage of animals is a key window stage for animal growth and development (Groothuis et al., 2005a, b; Cottrell and Ozanne, 2007), in which the combination of genetic material and the maternal nutritional environment determines the early growth and development of the offspring and even their phenotypic performance in adulthood (Ge et al., 2000; Zhao et al., 2001; McMillen et al., 2006). Embryonic growth is an insurmountable stage in the total growth period of poultry; the generation of muscle fibres, which are closely related to the yield and quality of poultry muscles, is nearly completed during the incubation period. It is well established that the number of muscle fibres is determined embryonically (Smith, 1963), as myoblasts, originating as somites, migrate to the appropriate site of muscle formation and then proliferate during the process of hyperplasia. These myoblasts then withdraw from the cell cycle, fuse to form multi-nucleated myotubes, and differentiate with the commencement of muscle-specific protein expression. The number of muscle fibres no longer increases after hatching, and the increase in muscle yield mainly depends on the thickening and lengthening of muscle fibres. Therefore, the growth and development of poultry embryonic muscle has a considerable effect on the meat-producing ability of adult animals.
In this study, Haiyang yellow chicken, a nationally cultivated quality broiler breed in China, was used to study transcriptomic changes during different growth stages. Jinghai yellow chicken, which is one of the parents of Haiyang yellow chicken, was independently cultivated in the previous period. We have successfully introduced the characteristics of Jinghai yellow chicken, including excellent meat quality, high reproductive performance, and strong resistance, into the matching line of Haiyang yellow chicken. Therefore, Haiyang yellow chicken can be listed on the market at 70 d old; the weight of a rooster can reach 2.1 kg and that of a hen can reach 1.6 kg. Haiyang yellow chickens exhibit excellent meat quality and high adaptability, overcoming the bottleneck of the breeding rate of yellow feather broilers and improving the core technical level of matching lines in China. Chicken growth, an important economic trait, is controlled by multiple genes. Many studies identified genetic factors affecting growth. Candidate genes and quantitative trait loci (QTLs), such as GH, IGFBP2 and GHSR, have been identified (Niarami et al., 2014; Ahsan et al., 2013). Xue et al. (2017) used RNA-Seq to compare the transcriptomes of chicken muscle tissues at three developmental stages during early growth. In total, 978 differentially expressed genes (DEGs) were detected by pairwise comparison. There were 42 potential candidate DEGs that induced differences in growth among the three developmental stages (Xue et al., 2017). Therefore, in the present study, Haiyang yellow chicken at the stages of 12 d embryos (E12, pre-differentiation of skeletal muscle), 16 d embryos (E16, skeletal muscle differentiation anaphase), 1 d post-hatching (1 d, shift from myoblast-mediated growth to satellite cell-modulated growth by hypertrophy), and 10 weeks (w) (10 w, market age) were selected to study the changes in gene expression at the genome-wide level during the critical period of leg muscle growth and development and to then identify candidate genes involved in chicken growth.
Most studies on chicken growth and development conducted in the past decades have mainly focused on breast muscle (Chen et al., 2015; Piórkowska et al., 2016), whereas little information on the leg muscle transcriptome exists. The broiler industry has been very successful in selecting broilers with increased yields. However, the regulatory mechanisms underlying the growth and development of chicken leg muscle have been neglected. Therefore, the present study was carried out to study the transcriptomic changes in leg muscle during different growth stages. RNA-Seq technology and bioinformatic tools were used to investigate the major DEGs and pathways. In addition, quantitative real-time polymerase chain reaction (qPCR) experiments were performed to validate the RNA-Seq results. The results of this study are useful for understanding the mechanisms regulating the development of leg muscle and the pattern of chicken growth. The findings should provide a basis for increasing chicken leg muscle yields in the broiler industry.
2.1 Ethics statement
All animal experiments were performed in accordance with the protocol of the Animal Use Committee of the Chinese Ministry of Agriculture and were approved by the Animal Care Committee of the Department of Animal Science and Technology, Yangzhou University. All efforts were made to minimize animal suffering.
2.2 Animals and tissues
The chickens used in this study were Haiyang yellow chickens, which is a breeding variety for which Jinghai yellow chicken is one of the parents. They were obtained from Jiangsu Jinghai Poultry Industry Group Co., Ltd. (Nantong city, Jiangsu province, China). Three female chickens with similar weights were selected for the E12, E16, 1 d, and 10 w age groups. Therefore, 12 female chickens from four different growth stages were used for RNA-Seq. We first used xylazine hydrochloride (SIGMA, X-1251) to anaesthetize the chickens with a dose of 8 mg/kg. When the feathers on both the wings and tails went limp and finally failed to respond to stimuli, the chickens were completely anaesthetized. The leg muscle was then immediately collected and snap-frozen in liquid nitrogen and stored at −80 ∘C until RNA extraction.
2.3 Total RNA extraction and quality testing
Total RNA was extracted from above tissues (50–100 mg) using Trizol reagent (TakaRa Biotechnology Dalian Co., Ltd, China) according to the manufacturer's instructions. Precipitated RNA was dissolved in 30 µL RNase-free H2O and stored at −80 ∘C. The RNA quality and quantity were assessed by agarose gel electrophoresis and Nanodrop-1000 spectrophotometer, respectively.
2.4 cDNA library construction and sequencing
The Oligo(dT) magnetic beads were used to purify the mRNA after the samples were tested. Subsequently, a fragmentation buffer was added to randomly fragment the mRNA, and the fragmented mRNA was used as a template to synthesize the first and second strand cDNA, respectively, and then use AMPure XP beads to purify the double-strand cDNA. The 3′ end and 5′ end refer to a deoxynucleotide chain of a DNA molecule with a 3′ end at one end and a 5′ end at the other end. In the two deoxynucleotide chains of the DNA molecule, each a skeleton of phosphate and deoxyribise, there is at one end a free phosphate group called the 5′ end and the hydroxyl group at the other called the 3′ end. The next step is to fill in the ends of the double-stranded cDNA fragments and add A to the 3′ end (the 3′ end and 5′ end refer to a deoxynucleotide chain of a DNA molecule with a 3′ end at one end and a 5′ end at the other end; for the two deoxynucleotide chains of the DNA molecule, each a skeleton of phosphate and deoxyribise, one end is a free phosphate group called the 5′ end and the hydroxyl group at the other end called the 3′ end). Finally, PCR amplification and purification of PCR products are performed to obtain the final library.
The first step is to use Qubit 2.0 for preliminary quantification, dilute the library to 1.5 ng/µL and then use Agilent 2100 to perform quality inspection on the library. After meeting the requirements, the next step is to use the RT-PCR method to detect the effective concentration of the library (the effective concentration of the library > 2 nM). The purpose is to ensure the quality of the library. After the library is qualified, the non-stop library will be pooled according to the effective concentration and target offline data volume for Illumina HiSeq sequencing.
2.5 Quality control and comparative analysis
The raw data (raw reads) in fastq format were first processed using in-house Perl scripts. Using this step, clean data (clean reads) were obtained by removing reads containing adapters, reads containing poly-N, and reads of low quality. At the same time, the Q20, Q30, GC (guanine and cytosine) content, and sequence duplication level of the clean data were calculated. All the downstream analyses were based on high-quality clean data.
The adaptor sequences and low-quality sequence reads were removed from the data sets. The raw sequences were transformed into clean reads after data processing. These clean reads were mapped to the reference genome sequence (Galgal4). Only reads with a perfect match or one mismatch were analysed and annotated based on the reference genome. Tophat 2 (Trapnell et al., 2012; Kim et al., 2013) was used to map the reads to the reference genome.
2.6 Differential expression analysis
The quantification of gene expression levels was performed as follows. The gene expression levels were estimated according to fragments per kilobase of transcript per million fragments mapped (FPKM) (Trapnell et al., 2013). Differential expression analysis between the two groups was performed using the DESeq R package (Anders et al., 2010). DESeq provides statistical routines for determining differential expression in digital gene expression data using a model based on the negative binomial distribution. The genes with a FDR ≤ 0.05 and a |fold change| ≥ 2 found by DESeq were considered differentially expressed. Fold change represents the ratio of the expression between the two groups. The resulting P values were adjusted using Benjamini and Hochberg's approach for controlling the false discovery rate.
2.7 GO and KEGG pathway enrichment analysis
The Gene Ontology database (Ashburner et al., 2000; Sherlock, 2009) (GO: http://geneontology. org/, last access: 9 May 2021) is a structured, standard biological annotation system built in 2000 by an organization (Gene Ontology Consortium), and it aims at establishing a standard vocabulary systematic knowledge of genes and their products. The Kyoto Encyclopedia of Genes and Genomes (KEGG) (Kanehisa et al., 2004; Teber et al., 2009) (https://www.kegg.jp/, last access: 9 May 2021) is a database resource for understanding high-level functions and utilities of the biological system, including the cell, the organism and the ecosystem, from molecular-level information, especially large-scale molecular datasets generated by genome sequencing and other high-throughput experimental technologies. All the target genes of the differentially expressed mRNA were subjected to Gene Ontology (GO) and KEGG pathway enrichment analysis by using the DAVID 6.7 functional annotation tool (Da et al., 2009) (https://david.ncifcrf.gov/, last access: 9 May 2021).
2.8 Validation of gene expression by quantitative real-time polymerase chain reaction analysis
Total RNA from the 12 samples used for the RNA-Seq experiment was amplified by qPCR. Single-strand cDNA was synthesized using the PrimeScript™ RT Master Mix Kit (Vazyme Biotech Co., Ltd). qPCR was performed using an Applied Biosystems 7500 real-time PCR system (Life Technologies, Gaithersburg, MD, USA) with specific primers. qPCR amplification was carried out in a 20 µL reaction volume containing 1 µL (500 ng/µL) of cDNA, 10 µL of SYBR Premix Ex Taq polymerase (2×) (Vazyme, Nanjing, China), 0.4 µL of ROX Reference Dye II (50×), 0.4 µL of the forward primer (10 mmol/L), 0.4 µL of the reverse primer (10 mmol/L), and 6.8 µL of dH2O. Amplification started with an initial denaturation step at 95 ∘C for 30 s, followed by 40 cycles at 95 ∘C for 5 s and an annealing step at 60 ∘C for 34 s, at which point fluorescence was acquired. Finally, a dissociation curve to test PCR specificity was generated via one cycle at 95 ∘C for 15 s followed by 60 ∘C for 1 min and then ramping to 95 ∘C with acquired fluorescence. Specific primers were designed based on sequences retrieved from the National Center for Biotechnology Information (NCBI) database (Table S1). Therefore, the HSP70 (Wang et al., 2015) and β-actin genes, selected as internal reference genes in the present study, were used to calculate the normalization factors based on the geometric means of these two reference gene quantities. The 2-ΔΔCt method was used to transform the data from the relative quantification step (Livak and Schmittgen, 2001).
3.1 Blast analysis of RNA-Seq reads
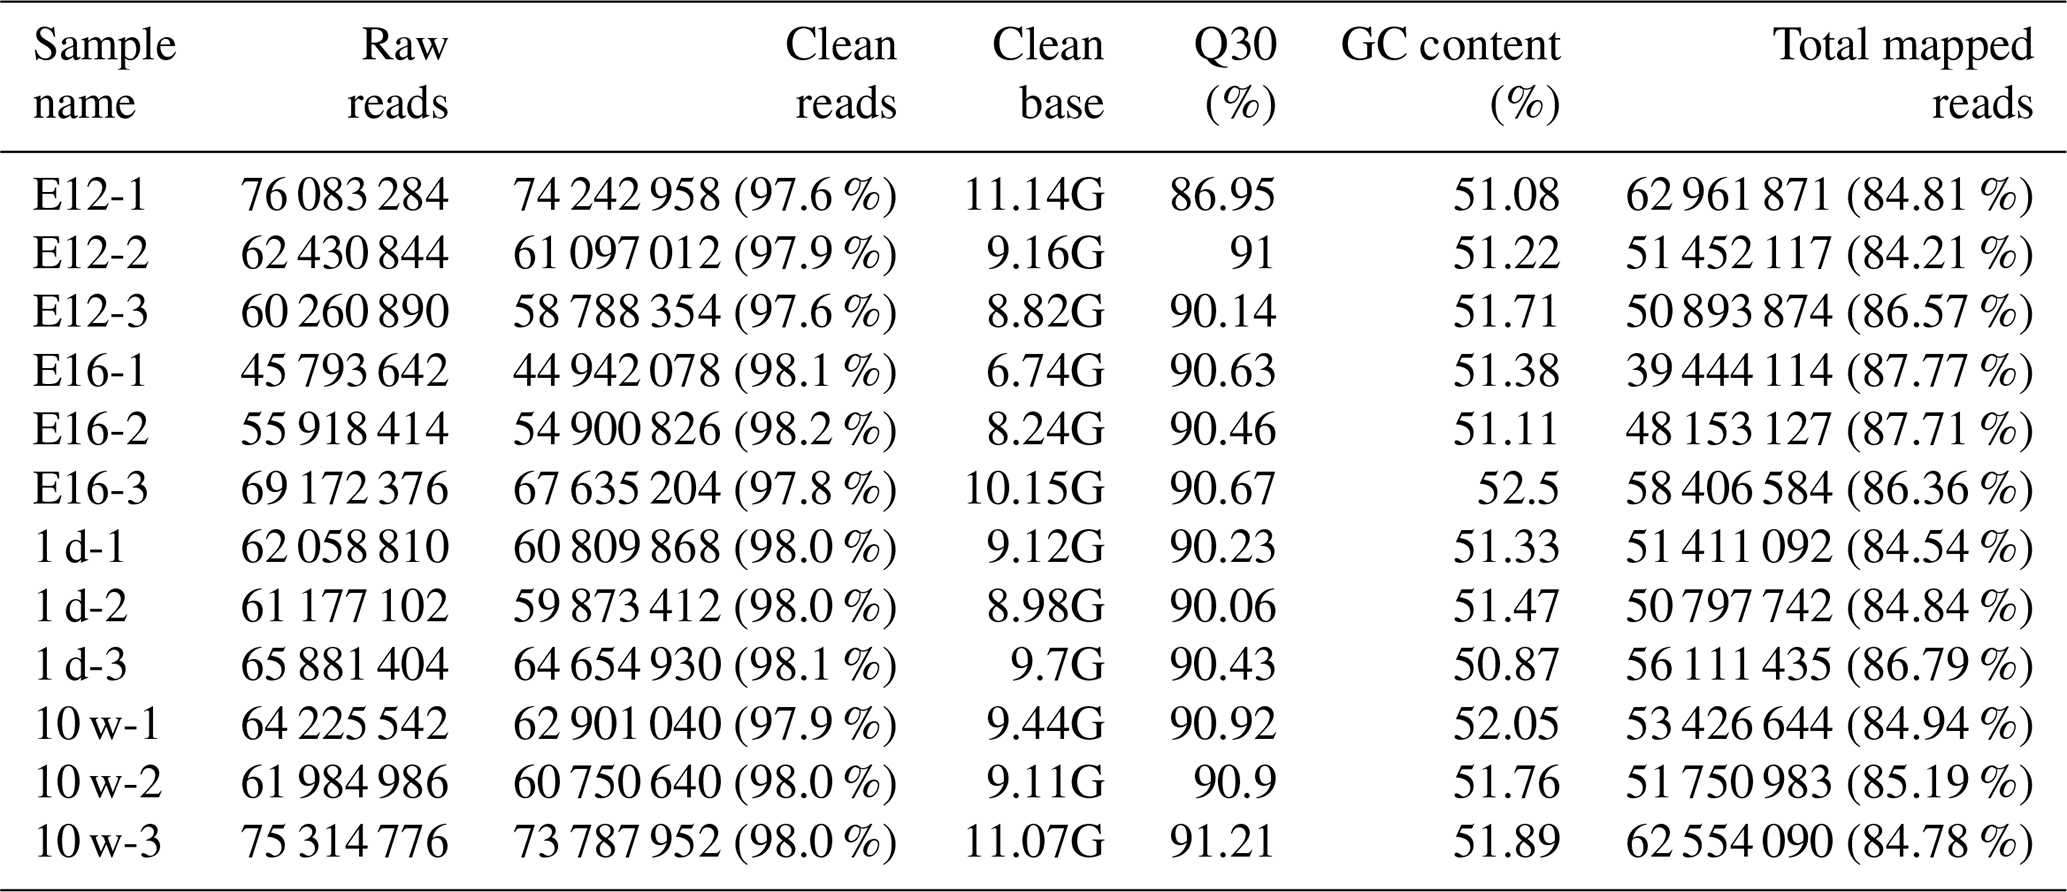
We established 12 cDNA libraries, including three from each growth stage (including E12, E16, 1 d, and 10 w of age), to identify DEGs related to muscle growth and development by RNA-Seq. A total of 760, 302, and 070 raw reads were produced from the 12 cDNA libraries (Table 1). After quality control, 744, 384, and 274 clean reads (111.67 GB) were obtained. The proportion of clean reads among the raw reads of the 12 libraries ranged from 97.6 % to 98.2 %. The proportion of reads with a Phred quality value greater than 30 among the clean reads ranged from 86.95 % to 91.21 %. The average GC content of the clean reads of the 12 libraries was 51.53 %. Overall, 84.21 % to 87.77 % of the clean reads were aligned against the Gallus gallus reference genome.
3.2 Differentially expressed genes at different stages of leg muscle development
DEGs were identified via Cuffdiff analysis (|fold change| ≥ 2; FDR ≤ 0.05). Using volcanic maps, we can see the differences in gene expression levels between different groups and the statistical significance of the differences (Fig. 1). After removing duplicate values, 6150 DEGs were detected by pairwise comparison in the female chickens (Fig. 2a and Table S2). The total number of upregulated genes was higher than the number of downregulated genes. To further analyse the interactions among the DEGs, 1616, 1437, 903, and 4083 DEGs were included in four comparisons (E12 vs. E16, E16 vs. 1 d, 1 d vs. 10 w, and E12 vs. 10 w, respectively) to construct a Venn diagram. As shown in Fig. 2b, 22 DEGs (Table S3) were common among the four comparisons.
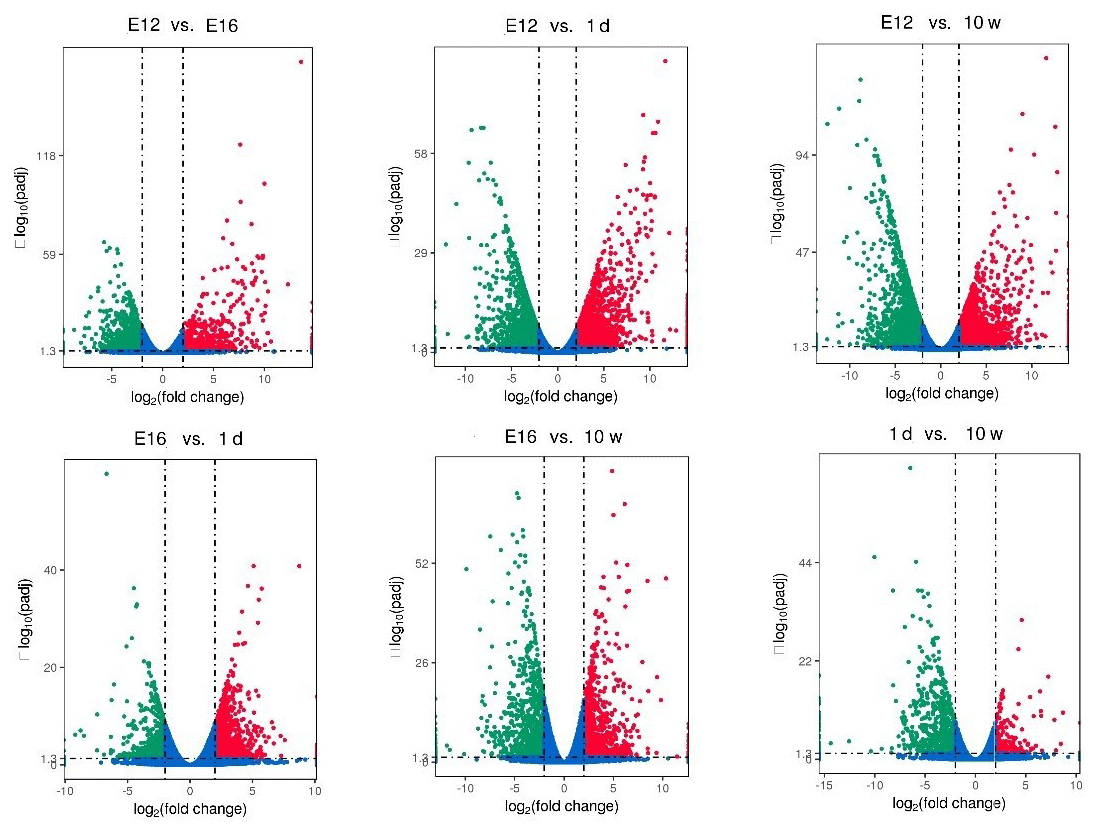
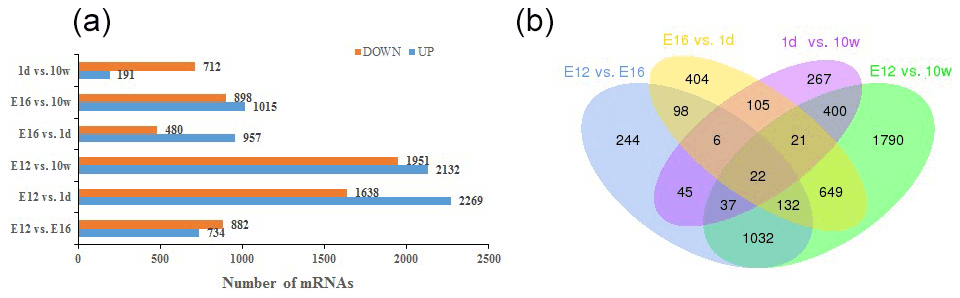
Figure 2Differentially expressed genes during chicken muscle growth and development at four different stages: (a) numbers of upregulated and downregulated genes in female chickens; (b) Venn diagram of differentially expressed genes in four comparisons of female chickens (E12 vs. E16, E16 vs. 1 d, 1 d vs. 10 w, and E12 vs. 10 w).
3.3 GO enrichment analysis for DEGs
The DEGs were then subjected to GO analysis to reveal their functional enrichment in each comparison. These DEGs were categorized into the three main GO categories of biological process, cellular component, and molecular function. There were 147, 221, 178, 55, 45, and 233 extremely significant enriched GO terms (P<0.01) identified in E12 vs. E16, E12 vs. 1 d, E12 vs. 10 w, E16 vs. 1 d, E16 vs. 10 w, and 1 d vs. 10 w, respectively (Table S4). Many of the significantly enriched biological process terms in the comparisons of different development stages were associated with muscle growth and development, such as muscle system process, embryo development, muscle organ development, muscle tissue development, and striated muscle tissue development. A total of 23 DEGs were found for these GO terms, including genes that are well known to affect chicken growth and development, such as MYOCD, MSTN, MYOD1, MYH11, MYF6, MYL4, and MYF5 (Table 2). The genes showing differential expression among the different stages of development were also found to be significantly enriched for terms related to the processes of muscle cell development and differentiation and striated muscle cell development and differentiation. A total of 20 DEGs were associated with these terms, and some of these genes are associated with development, such as MYF6, MYOD1, MYH11, and MSTN (Table 3). In addition, other genes, such as MYLK2, MYL4, FGF9, FGF8, ACTA1, MYOM1, and MOMY2, were included among these processes. These genes might be crucial for muscle development and chicken growth.
Table 2Significantly enriched biological process terms involved in muscle growth and development.
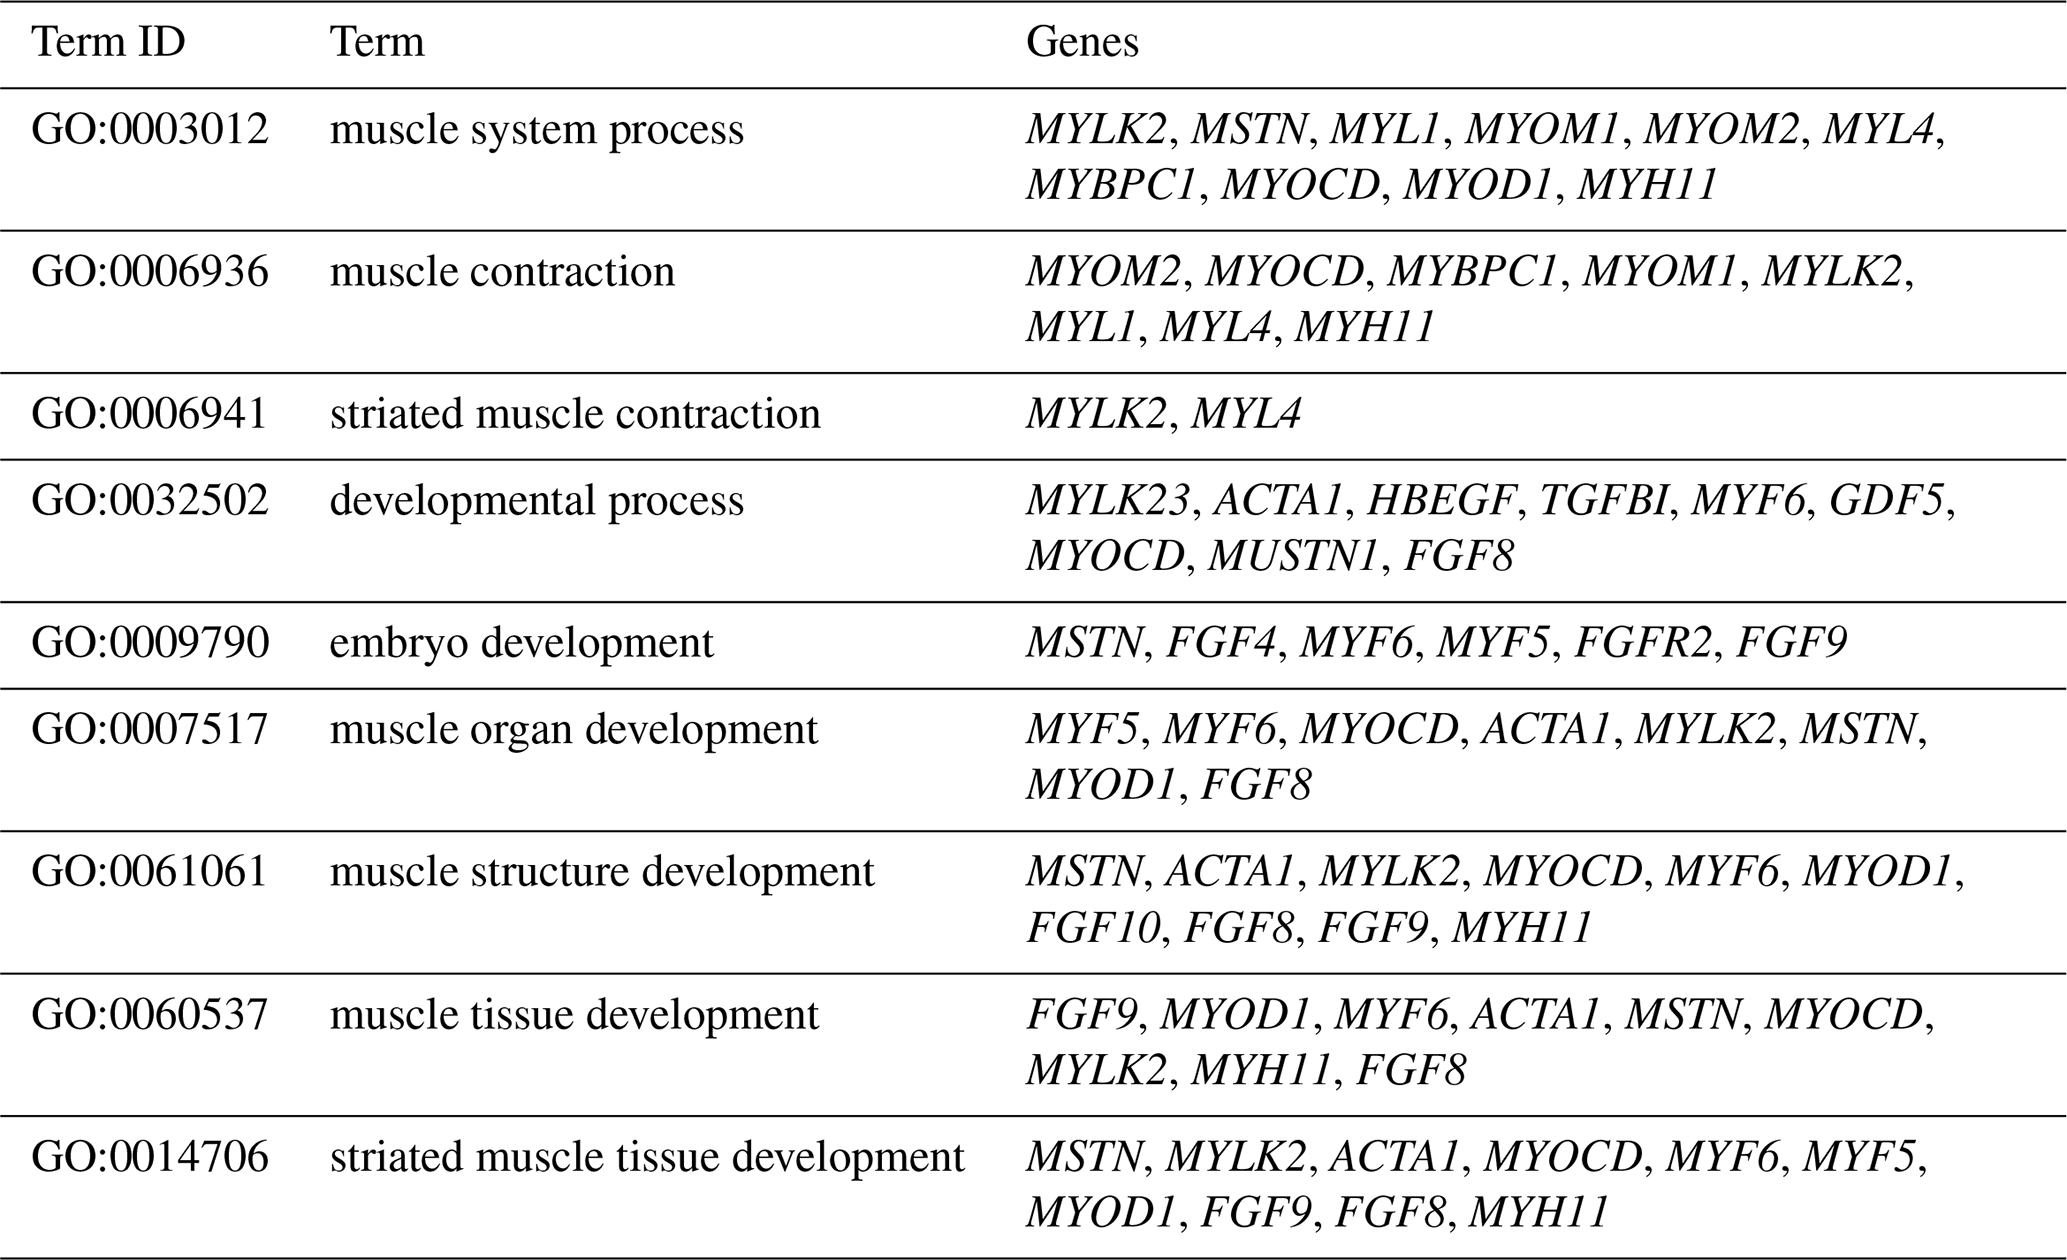
Table 3Significantly enriched terms related to the processes of cellular activities.

3.4 KEGG pathway analysis for DEGs
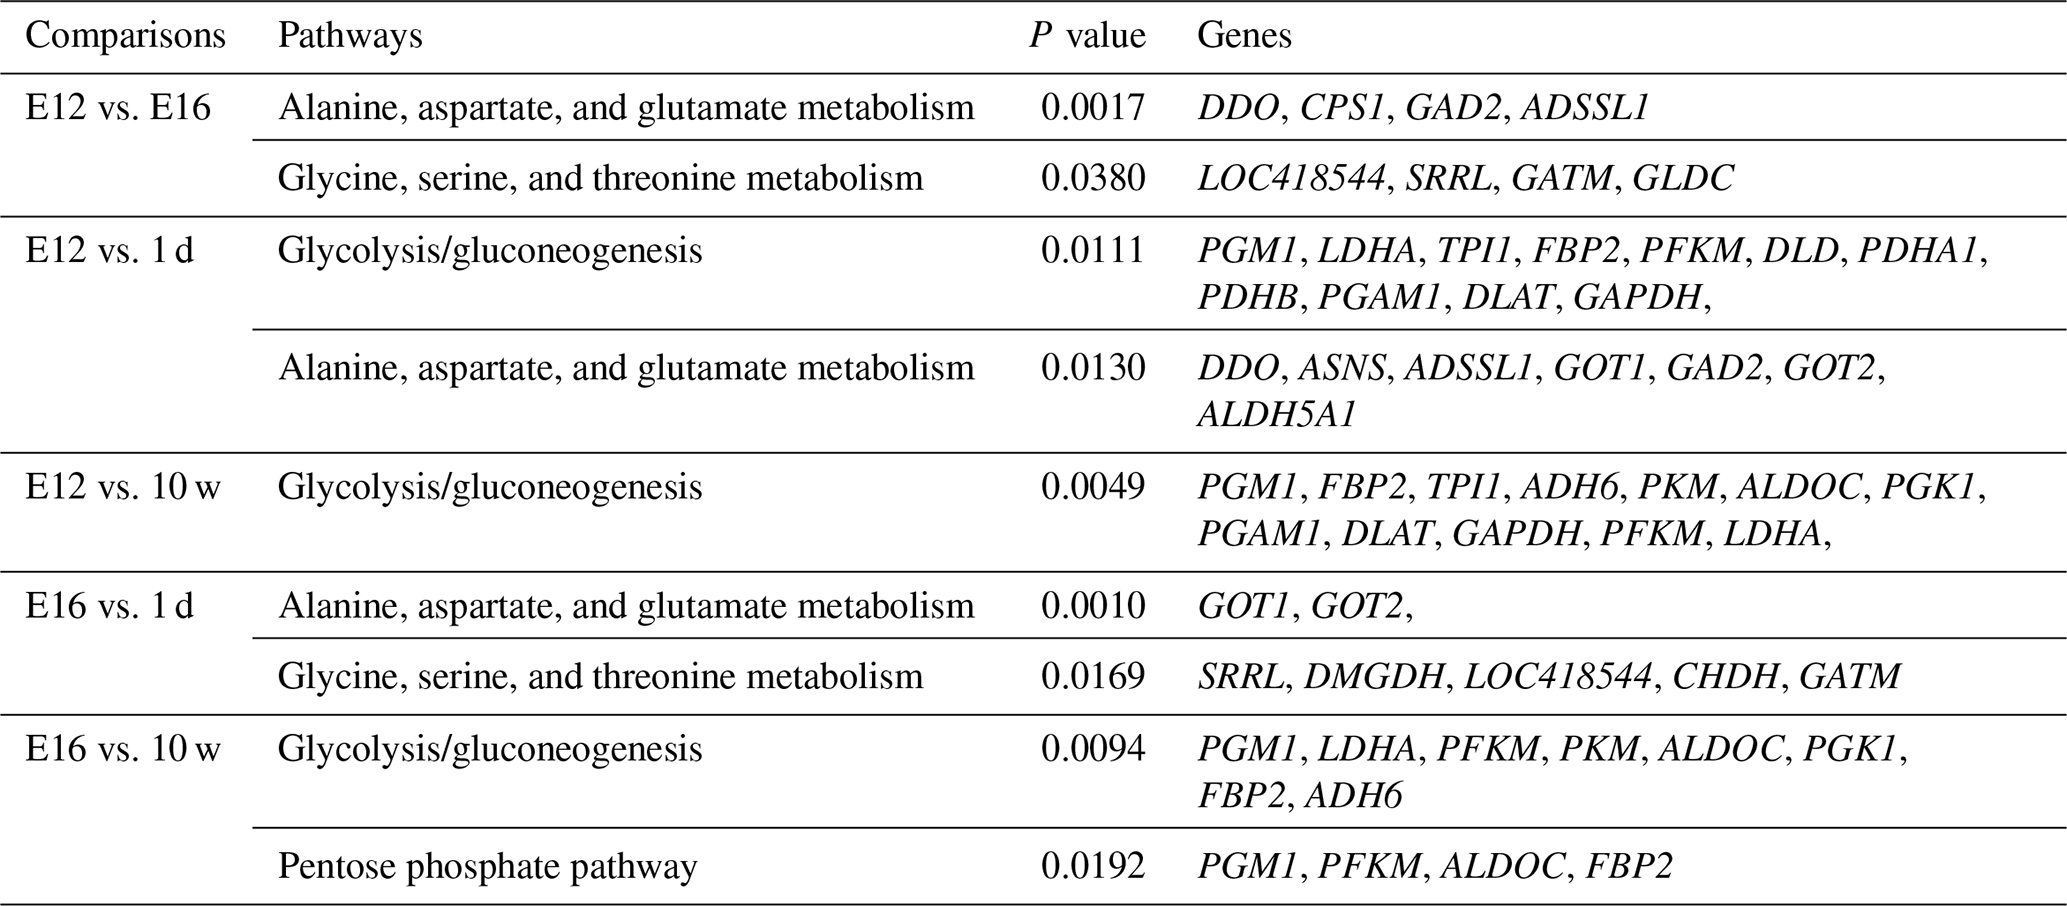
DEGs were annotated through KEGG enrichment analysis in the KEGG database, and the results were shown in Table S5. Among the first 20 pathways with the smallest P values (P<0.05), many are related to the metabolism of amino acids, carbohydrates, and lipids (e.g. alanine, aspartate, glutamate, glycine, serine, and threonine metabolism); the pentose phosphate pathway; and glycolysis/gluconeogenesis (Table 4). Four significantly enriched pathways related to growth and development were identified: the extracellular matrix (ECM)–receptor interaction, focal adhesion, tight junction, and insulin signalling pathways (Table 5). There were 42 DEGs associated with these four pathways.
3.5 qPCR validation of DEGs obtained via RNA-Seq
The expression of DEGs among different comparisons was verified using qPCR. Nine DEGs obtained from RNA-Seq analysis were randomly selected for validation. qPCR was carried out on the same RNA samples used for RNA-Seq. After qPCR analysis of the nine target genes, the qPCR results were consistent with the RNA-Seq results regarding the direction of changes in the expression levels of DEGs, which confirmed the RNA-Seq data (Fig. 3).
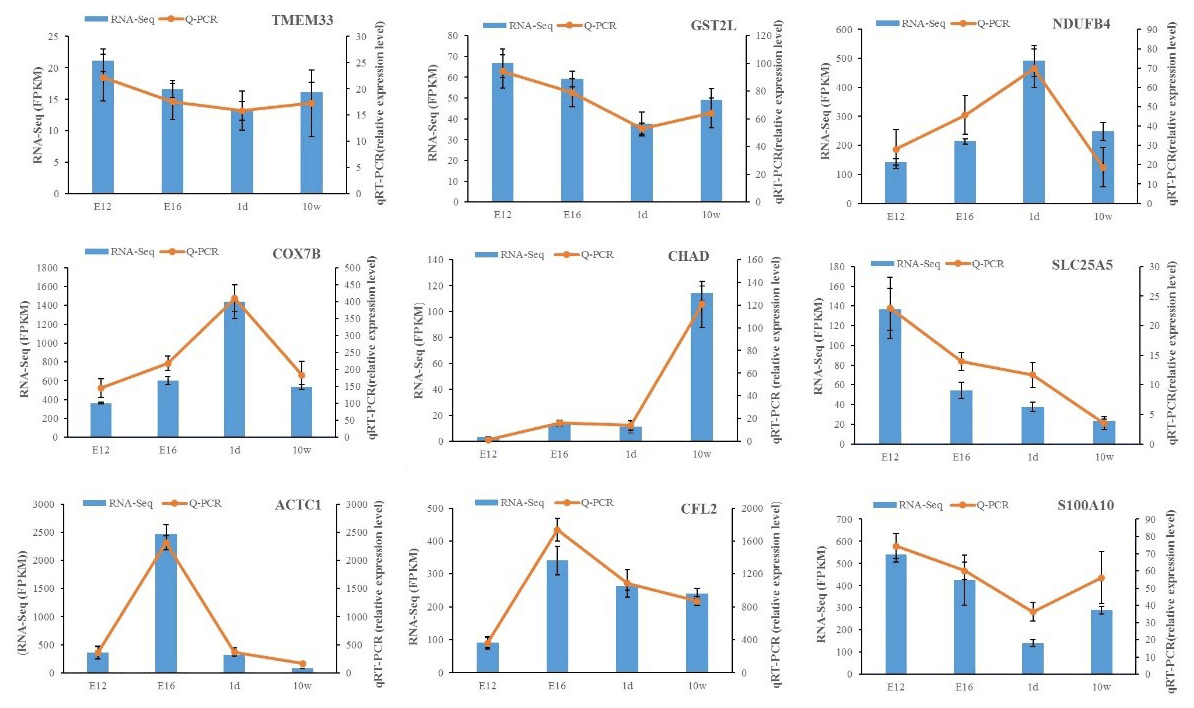
Figure 3Expression levels of nine DEGs detected by RNA-Seq and validated by qPCR. The results from RNA-Seq are shown in bar graphs, and the FPKM values are shown on the right y axis. The results from qPCR are shown in line graphs, and relative expression values are shown on the left y axis. The data are presented as the mean ± SE.
Muscle growth and development from the embryonic to the adult stage of an organism consists of a series of exquisitely regulated and orchestrated changes in the expression of genes leading to muscle maturation. In this study, the transcriptome levels of 12 leg muscle tissues at different stages were analysed, and 22 genes were found to be differentially expressed in all comparisons, among which there were three new genes (Novel1117, Novel00182, and Novel01911) and four unannotated genes (ENSGALG00000028710, ENSGALG00000027703, ENSGALG00000040501, and ENSGALG00000043739). In addition, we found that CD36 (Enciu et al., 2018; Yao et al., 2019), PHGDH (Li et al., 2017), WNT11 (Guo et al., 2018), and TWIST3 (Kragl et al., 2013) were associated with cell proliferation and that the ACACB (Tang, 2015), ACSL1 (Cao et al., 2018), and FABP3 (Zhang, 2015) genes play an important role in fat deposition and metabolism. In addition, Abra (also known as Stars) is a muscle-specific actin-binding protein capable of stimulating serum response factor (SRF)-dependent transcription through a mechanism involving Ras homolog family member A (RhoA) and actin polymerization (Arai et al., 2002). Abra is involved in human skeletal muscle hypertrophy and atrophy (Lamon et al., 2009). MAP7 (also known as ensconsin or E-MAP-115) was originally identified based on its association with microtubules (Masson and Kreis, 1993; Bulinski and Bossler, 1994) and was later characterized in non-neuronal cells (Bulinski et al., 1999; Faire et al., 1999). Microtubules are involved in many important cellular processes, including cell division, motility, and changes in cell shape, where microtubule associated proteins (MAPs) bind to and stabilize microtubules (Masson and Kreis, 1995). MYH1C, which belongs to the myosin family gene, is the most important structural and functional protein in muscle cells. It is the main component of crude myofilaments and participates in muscle contraction (Zhou et al., 2007; Han et al., 2010). Myosin heavy chain (MyHC) is the main component of the contraction mechanism of skeletal muscle fibres. The expression of the MyHC isotype in the course of injury recovery indicates that MyHC is important for muscle growth and development (Wylie et al., 1995; Zhao and Hoffman, 2004; Parise et al., 2006). Although there are few reports on the function of the AHSG, NTRK2, LOC418544, LOC417013, and PRDH genes, we speculate that these genes may be related to muscle growth and cell activity.
Table 4Pathways related to the metabolism of amino acids, carbohydrates, and lipids.

The differential expression of genes related to growth and development is considered the primary reason for genetic variation in chicken growth and development. Among the DEGs involved in growth and development identified in this study, some were previously reported to be closely related to muscle growth and development. As a regulator of skeletal muscle growth, MSTN plays a key role in negatively regulating the growth and development of skeletal muscle and influencing the strength and quality of muscles (Yi et al., 2016; Liu et al., 2016; Rao et al., 2016). MSTN can inhibit the activation, proliferation, and differentiation of myogenic satellite cells (McFarland et al., 2006), and delayed differentiation of myoblasts due to a lack of MSTN results in significant changes in the morphology of myoblasts (Sato et al., 2006), which indicates that MSTN plays an important role in chicken embryogenesis and skeletal muscle development and is one of the important factors regulating muscle development. In this study, the MSTN gene was expressed in different developmental stages, and the expression of the MSTN gene was high at E16 and 10 w (Table S6), which was consistent with the results of previous studies showing that the MSTN gene is mainly expressed in skeletal muscle in the growth period and mature stage (Hu et al., 2004). MYOD, Myf5, and Myf6 are members of the myogenic determination factor family, which controls the proliferation and differentiation of muscle cells and is closely related to the number and size of muscle fibres. Therefore, we speculated they played an important role in meat quality and flavour, and the members of this family can control many key regulatory factors in skeletal muscle, either individually or collaboratively (Naidu et al., 1995). In the primary stage of muscle development, Myf5 is an important factor in the activation of skeletal muscle satellite cells and plays an important role in the differentiation of pre-myoblasts and the proliferation of myoblasts (Sobolewska et al., 2011; Yin et al., 2014). Compared with Myf5, the mRNA of Myf6 appears late, only in the myogenic phase and is expressed in different stages of tubule maturation (Hayes et al., 2003; Kassar-Duchossoy et al., 2004; Kent, 2002). The members of the MyoD gene family have different functions during muscle development. The results of using gene knockout to study the function of mouse MyoD gene family members showed that as long as the MyoD or Myf5 genes remain intact, they can basically satisfy the requirements for skeletal muscle development (Cooper et al., 1999). If mice with MyoD and Myf5 gene knockout show no muscle formation, there is no subsequent transcriptional process promoted by the MyoG gene (Rudnicki et al., 1993). These results suggested that MyoD and Myf5 mainly function in the differentiation and proliferation of myoblast pre-cells and directly or indirectly regulate the expression of other members of this family. MyoG and Myf6 are located downstream of the MyoD and Myf5 genes and mainly function in the secondary stage of muscle development, while Myf6 mainly controls the further fusion of myotubes into muscle fibres. The results showed that the Myf5 and MyoD genes increased first and then decreased at four different developmental stages, in which Myf5 gene expression reached its highest level at E16, and the MyoD gene showed its highest expression at 1 d; the Myf5 and MyoD genes regulated the proliferation and differentiation of myocytes during embryonic development, which was closely related to the number and size of muscle fibres. These results suggested that Myf5 plays a regulatory role earlier than MyoD. However, the Myf6 gene was expressed throughout the process of development and showed an upward trend, reaching its highest expression at 10 w. This was related to the role of Myf6 in maintaining differentiation, which not only promotes differentiation at the embryonic stage but also continues to be expressed in adult mammalian muscle tissue (Li, 2008).
The number of muscle fibres is determined embryonically (Smith, 1963), as myoblasts, originating as somites, migrate to the appropriate site of muscle formation and then proliferate during the process of hyperplasia. These myoblasts subsequently exit the cell cycle, fuse to form multi-nucleated myotubes, and differentiate with the commencement of muscle-specific protein expression. After the actual number of muscle fibres is determined during hyperplasia, skeletal muscle stem cells, which are satellite cells located beneath the basal lamina of the muscle fibres, are activated and fuse with muscle fibres to contribute their nuclei, resulting in a further increase in DNA that directly leads to an increase in protein synthesis. This post-hatch increase in muscle fibre size (hypertrophy) is responsible for the majority of overall muscle mass accretion (Velleman, 2007; Moss, 1968). In this study, GO analysis showed that the identified DEGs were mainly related to the muscle system process, embryo development, muscle organ development, muscle tissue development, and striated muscle tissue development categories as well as muscle cell development and differentiation and striated muscle cell development and differentiation. Many DEGs that are known to affect chicken growth and development are associated with these terms, indicating that chicken growth is a complex process that is influenced by multiple genes and controlled by multiple GO terms.
KEGG analysis identified four pathways related to growth: the ECM–receptor interaction, focal adhesion, tight junction, and insulin signalling pathways, among which the ECM–receptor interaction was the most significantly enriched. ECM is a complex mixture of functional macromolecules. The ECM interacts with cells through cell surface-related elements such as integrin that directly or indirectly control cell activities such as adhesion, migration, differentiation, proliferation, and apoptosis (Thomas et al., 2015). In this study, the DEGs were enriched in ECM–receptor interactions at four developmental stages and in pairwise comparisons, which suggested that the ECM–receptor interaction plays an important role in the regulation of muscle growth and development in Haiyang yellow chickens. Three enriched cell junction-related pathways were screened out in the present study, indicating that pathways involved in maintaining the integrity of tissues might be critical for the early growth of chickens. The insulin signalling pathway was involved in translation initiation, and the efficiency of the translation process directly affects the rate of protein synthesis. Insulin, as a component of this pathway, plays a key role in stimulating glucose transport (Laukkanen et al., 2004; Davis et al., 2008). Recently, studies have shown that ontogenetic changes in the expression of genes in this pathway in skeletal muscle contribute to the developmental decline in protein synthesis (Jiang et al., 2010). Thus, this pathway is considered to be involved in growth, differentiation, and metabolism (Saltiel and Pessin, 2002). In this study, DEGs were significantly enriched in the insulin signalling pathway in the E12 vs. E16 comparison, suggesting that there were major differences between the E12 and E16 embryonic ages in the processes of protein synthesis, glucose metabolism, and cell growth. Focal adhesions are large dynamic protein complexes that are targeted by biochemical and mechanical stimuli from the extracellular environment and can evoke crucial developmental and injury response mechanisms, such as cell growth, movement, and differentiation. Focal adhesions are considered to act as mechanical linkages to ECM (Romer et al., 2006). The expression patterns of DEGs belonging to these two pathways (including CHAD, LAMB4, COL2A1, LAMA1, and COMP) were very similar, and their enrichment was mainly concentrated around E12, which indicates that there is considerable capacity for satellite cell activities and skeletal muscle development at E12 compared with other stages. The tight junction is a cellular structure that functions as a barrier to restrict the free passage and movement of ions, liquids, proteins, and large solutes through the paracellular pathway (Gonzalez-Mariscal et al., 2008; Citi and Cordenonsi, 1998). This barrier function is essential for the development of multicellular organisms (Shen et al., 2011). Another role of tight junctions has been revealed, showing that they are involved in the control of cell proliferation and gene expression (González-Mariscal et al., 2007). The DEGs were significantly enriched in the tight junction category in the E12 vs. E16 comparison, which suggested that this pathway is essential for the development of multicellular organisms and cell proliferation.
Data used in this paper are available upon request.
The supplement related to this article is available online at: https://doi.org/10.5194/aab-64-405-2021-supplement.
GXZ and JYW were responsible for conceptualization; XMY, LC, SSZ, and YLW were responsible for formal analysis; XMY was responsible for investigation; XMY, LC, and TZ were responsible for resources; XMY was responsible for data curation; XMY and TZ were responsible for writing: original draft preparation; XMY, GXZ, and JYW were responsible for writing: review and editing; XMY, SSZ, and YLW were responsible for validation.
The authors declare that they have no conflict of interest.
Publisher’s note: Copernicus Publications remains neutral with regard to jurisdictional claims in published maps and institutional affiliations.
This work was supported by National Broiler Industrial and Technology System (no. nycytx-42-G1-05), China Agriculture Research System (CARS-41), Priority Academic Program Development of Jiangsu Higher Education Institutions.
This research has been supported by the National Broiler Industrial and Technology System (grant no. nycytx-42-G1-05).
This paper was edited by Steffen Maak and reviewed by two anonymous referees.
Ahsan, M., Li, X., Lundberg, A. E., Kierczak, M., Siegel, P. B., Carlborg, Ö., and Marklund, S.: Identification of candidate genes and mutations in QTL regions for chicken growth using bioinformatic analysis of NGS and SNP-chip data, Front. Genet., 4, 226, https://doi.org/10.3389/fgene.2013.00226, 2013.
Anders, S. and Huber, W.: Differential expression analysis for sequence count data, Genome Biol., 11, R106, https://doi.org/10.1186/gb-2010-11-10-r106, 2010.
Arai, A., Spencer, J. A., and Olson, E. N.: STARS, a striated muscle activator of Rho signaling and serum response factor-dependent transcription, J. Biol. Chem., 277, 24453–24459, https://doi.org/10.1074/jbc.m202216200, 2002.
Ashburner, M., Ball, C. A., Blake, J. A., Botstein, D., and Cherry, J. M.: Gene ontology: tool for the unification of biology: The Gene Ontology Consortium, Nat. Genet., 25, 25–29, https://doi.org/10.1038/75556, 2000.
Bulinski, J. C. and Bossler, A.: Purification and characterization of ensconsin, a novel microtubule stabilizing protein, J. Cell Sci., 107, 2839–2849, https://doi.org/10.21236/ada446411, 1994.
Bulinski, J. C., Gruber, D., Faire, K., Prasad, P., and Chang, W.: GFP chimeras of E-MAP-115 (ensconsin) domains mimic behavior of the endogenous protein in vitro and in vivo, Cell Struct. Funct., 24, 313–320, https://doi.org/10.1247/csf.24.313, 1999.
Cao, Y., Jin, H., Yu, Y., Zhang, L., and Cao, Y.: Effect of ACSL1gene on lipid metabolism of sheep, Chin. J. Vet. Sci., 4, 824–832, 2018.
Chen, B., Xu, J., He, X., Xu, H., Li, G., Du, H., Nie, Q., and Zhang, X.: A genome-wide mRNA screen and functional analysis reveal FOXO3 as a candidate gene for chicken growth, PLoS One, 10, e0137087, https://doi.org/10.1371/journal.pone.0137087, 2015.
Citi, S. and Cordenonsi, M.: Tight junction proteins, Biochim. Biophys. Acta, 1448, 1–11, https://doi.org/10.1016/s0167-4889(98)00125-6, 1998.
Coelen, R. J. S., Wiggers, J. K., Nio, C. Y., Besselink, M. G., Busch, O. R. C., Gouma, D. J., and van Gulik, T. M.: Preoperative computed tomography assessment of skeletal muscle mass is valuable in predicting outcomes following hepatectomy for perihilar cholangiocarcinoma, HPB, 17, 520–528, https://doi.org/10.1111/hpb.12394, 2015.
Cooper, R., Tajbakhsh, S., Mouly, V., Cossu, G., Buckingham, M., and Butler-Browne, G.: In vivo satellite cell activation via Myf5 and MyoD in regenerating mouse skeletal muscle, J. Cell Sci., 112, 2895–2901, 1999.
Cottrell, E. C. and Ozanne, S. E.: Developmental programming of energy balance and the metabolic syndrome, Proc. Nutr. Soc., 66, 198–206, https://doi.org/10.1017/s0029665107005447, 2007.
Da, W. H., Sherman, B. T., and Lempicki, R. A.: Systematic and integrative analysis of large gene lists using DAVID bioinformatics resources, Nat. Protoc., 2009, 4, 44-57, https://doi.org/10.1038/nprot.2008.211, 2009.
Davis, T. A., Suryawan, A., Orellana, R. A., Nguyen, H. V., and Fiorotto, M. L.: Postnatal ontogeny of skeletal muscle protein synthesis in pigs1,2, J. Anim. Sci., 86, E13–E18, https://doi.org/10.2527/jas.2007-0419, 2008.
Enciu, A. M., Radu, E., Popescu, I. D., Hinescu, M. E., and Ceafalan, L. C.: Targeting CD36 as biomarker for metastasis prognostic: how far from translation into clinical practice?, BioMed Res. Int., 2018, 7801202, https://doi.org/10.1155/2018/7801202, 2018.
Faire, K., Waterman-Storer, C. M., Gruber, D., Masson, D., Salmon, E. D., and Bulinski, J. C.: E-MAP-115 (ensconsin) associates dynamically with microtubules in vivo and is not a physiological modulator of microtubule dynamics, J. Cell Sci., 112, 4243–4255, 1999.
Frontera, W. R. and Ochala, J.: Skeletal muscle: a brief review of structure and function, Calcif. Tissue Int., 96, 183–195, https://doi.org/10.1007/s00223-014-9915-y, 2015.
Ge, S., Zhao, R., Chen, W., and Chen, J.: Changes of some serum hormone levels during embryonic development in Shaoxing and Gaoyou ducks, J. Nanjing Agric. Univ., 23, 63–66, 2000.
Gonzalez-Mariscal, L., Tapia, R., and Chamorro, D.: Crosstalk of tight junction components with signaling pathways, Biochim. Biophys. Ac., 1778, 729–756, https://doi.org/10.1016/j.bbamem.2007.08.018, 2008.
González-Mariscal, L., Lechuga, S., and Garay, E.: Role of tight junctions in cell proliferation and cancer, Prog. Histochem. Cytochem., 42, 1–57, https://doi.org/10.1016/j.proghi.2007.01.001, 2007.
Groothuis, T. G. G., Eising, C. M., Dijkstra, C., and Müller, W.: Balancing between costs and benefits of maternal hormone deposition in avian eggs, Biol. Lett., 1, 78–81, https://doi.org/10.1098/rsbl.2004.0233, 2005a.
Groothuis, T. G. G., Müller, W., von Engelhardt, N., Carere, C., and Eising, C.: Maternal hormones as a tool to adjust offspring phenotype in avian species, Neurosci. Biobehav. Rev., 29, 329–352, https://doi.org/10.1016/j.neubiorev.2004.12.002, 2005b.
Guo, Y., Ma, L., Chen, D., Shao, Y., Li, M., Wang, Q., and Zhu, Y.: Analysis of the expression and the potential of clinical prognostic value of WNT3A, WNT4, WNT11, C-MYC and SFRP2 in ovarian cancer, Shanxi Med. J., 13, 1518–1521, 2018.
Han, Y., Liu, H., Zhan, Y., Wu, W., Zhao, T., and Chen, Y.: Nano-machine-molecular motor, Biol. Bull., 45, 6–9, https://doi.org/10.1038/msb.2010.42, 2010.
Hu, L., Hu, R., Wang, N., and Zhu, C.: Advances in studying MSTN gene, Chin. J. Vet. Med., 38, 41–43, 2004.
Jiang, C., Shi, P., Li, S., Dong, R., Tian, J., Wei, J., and Luo, S.: Gene expression profiling of skeletal muscle of nursing piglets, Int. J. Biol. Sci., 6, 627–638, https://doi.org/10.7150/ijbs.6.627, 2010.
Kanehisa, M., Goto. S., Kawashima, S., Okuno, Y., and Hattori, M.: The KEGG resource for deciphering the genome, Nucl. Acid. Res., 32, 277–280, https://doi.org/10.1093/nar/gkh063, 2004.
Kassar-Duchossoy, L., Gayraud-Morel, B., Gomès, D., Rocancourt, D., Buckingham, M., Shinin, V., and Tajbakhsh, S.: Mrf4 determines skeletal muscle identity in Myf5: Myod double-mutant mice, Nature, 431, 466–471, https://doi.org/10.1038/nature02876, 2004.
Kent, W. J.: BLAT – the BLAST-like alignment tool, Genome Res., 12, 656–664, https://doi.org/10.1101/gr.229202, 2002.
Kim, D., Pertea, G., Trapnell, C., Pimentel, H., Kelley, R., and Salzberg, S. L.: TopHat2: accurate alignmeng of transcriptomes in the presence of insertions, deletions and gene fusions, Genome Biol., 14, R36, https://doi.org/10.1186/gb-2013-14-4-r36, 2013.
Kragl, M., Roensch, K., Nüsslein, I., Tazaki, A., Taniguchi, Y., Tarui, H., Hayashi, T., Agata, K., and Tanaka, E. M.: Muscle and connective tissue progenitor populations show distinct Twist1 and Twist3 expression profiles during axolotl limb regeneration, Dev. Biol., 373, 196–204, https://doi.org/10.1016/j.ydbio.2012.10.019, 2013.
Lamon, S., Wallace, M. A., Léger, B., and Russell, A. P.: Regulation of STARS and its downstream targets suggest a novel pathway involved in human skeletal muscle hypertrophy and atrophy, J. Physiol., 587, 1795–1803, https://doi.org/10.1113/jphysiol.2009.168674, 2009.
Laukkanen, O., Pihlajamaki, J., Lindstrom, J., Eriksson, J., Valle, T. T., Hamalainen, H., Ilanne-Parikka, P., Keinanen-Kiukaanniemi, S., Tuomilehto, J., Uusitupa, M., and Laakso, M.: Common polymorphisms in the genes regulating the early insulin signalling pathway: effects on weight change and the conversion from impaired glucose tolerance to Type 2 diabetes, Diabetologia, 47, 871–877, https://doi.org/10.1007/s00125-004-1395-6, 2004.
Li, T. Y., Guo, H., Liu, H. M., Yi, X. F., Nie, Y. Z., and Fan, D. M.: The role of PHGDH on cell proliferation and chemotherapy sensitivity in gastric cancer, Chin. J. Cancer Prev. Treat., 24, 518–523, 2017.
Li, Y.: Effect of Feed Restriction on Morphology and Function of Myofibers and Satellite Cells in Gastrocnemius of Broiler Chickens and its Mechanism Involved, Nanjing Agricultural University, Nanjing, 2008.
Liu, L. X., Dou, T. F., Li, Q. H., Rong, H., Tong, H. Q., Xu, Z. Q., Huang, Y., Gu, D. H., Chen, X. B., Ge, C. R., and Jia, J. J.: Myostatin mRNA expression and its association with body weight and carcass traits in Yunnan Wuding chicken, Genet. Mol. Res., 15, https://doi.org/10.4238/gmr15048967, 2016.
Livak, K. J. and Schmittgen, T. D.: Analysis of relative gene expression data using real-time quantitative PCR and the 2-ΔΔCT method, Methods, 25, 402–408, https://doi.org/10.1006/meth.2001.1262, 2001.
Masson, D. and Kreis, T. E.: Identification and molecular characterization of E-MAP-115, a novel microtubule-associated protein predominantly expressed in epithelial cells, J. Cell Biol., 123, 357–371, https://doi.org/10.1083/jcb.123.2.357, 1993.
Masson, D. and Kreis, T. E.: Binding of E-MAP-115 to microtubules is regulated by cell cycle-dependent phosphorylation, J. Cell Biol., 131, 1015–1024, https://doi.org/10.1083/jcb.131.4.1015, 1995.
McFarland, D. C., Velleman, S. G., Pesall, J. E., and Liu, C.: Effect of myostatin on turkey myogenic satellite cells and embryonic myoblasts, Comp. Biochem. Physiol. A, 144, 501–508, https://doi.org/10.1016/j.cbpa.2006.04.020, 2006.
McMillen, I. C., Edwards, L. J., Duffield, J., and Muhlhausler, B. S.: Regulation of leptin synthesis and secretion before birth: implications for the early programming of adult obesity, Reproduction, 131, 415–427, https://doi.org/10.1530/rep.1.00303, 2006.
Moss, F. P.: The relationship between the dimensions of the fibres and the number of nuclei during normal growth of skeletal muscle in the domestic fowl, Am. J. Anat., 122, 555–563, https://doi.org/10.1002/aja.1001220308, 1968.
Naidu, P. S., Ludolph, D. C., To, R. Q., Hinterberger, T. J., and Konieczny, S. F.: Myogenin and MEF2 function synergistically to activate the MRF4 promoter during myogenesis, Mol. Cell. Biol., 15, 2707–2718, https://doi.org/10.1128/mcb.15.5.2707, 1995.
Niarami, M. D., Masoudi, A. A., and Vaez Torshizi, R.: Association of single nucleotide polymorphism of GHSR and TGFB2 genes with growth and body composition traits in sire and dam lines of a broiler chicken, Anim. Biotechnol., 25, 13–22, https://doi.org/10.1080/10495398.2013.803478, 2014.
Parise, G., O'Reilly, C. E., and Rudnicki, M. A.: Molecular regulation of myogenic progenitor populations, Appl. Physiol. Nutr. Metab., 31, 773–781, https://doi.org/10.1139/h06-055, 2006.
Piórkowska, K., Żukowski, K., Nowak, J., Połtowicz, K., Ropka-Molik, K., and Gurgul, A.: Genome-wide RNA-Seq analysis of breast muscles of two broiler chicken groups differing in shear force, Anim. Genet., 47, 68–80, https://doi.org/10.1111/age.12388, 2016.
Rao, S., Fujimura, T., Matsunari, H., Sakuma, T., Nakano, K., Watanabe, M., Asano, Y., Kitagawa, E., Yamamoto, T., and Nagashima, H.: Efficient modification of the myostatin gene in porcine somatic cells and generation of knockout piglets, Mol. Reprod. Dev., 83, 61–70, https://doi.org/10.1002/mrd.22591, 2016.
Romer, L. H., Birukov, K. G., and Garcia, J. G.: Focal adhesions: paradigm for a signaling nexus, Circ. Res., 98, 606–616, https://doi.org/10.1161/01.RES.0000207408.31270.db, 2006.
Rudnicki, M. A., Schnegelsberg, P. N. J., Stead, R. H., Braun, T., Arnold, H. H., and Jaenisch, R.: MyoD or Myf-5 is required for the formation of skeletal muscle, Cell, 75, 1351–1359, https://doi.org/10.1016/0092-8674(93)90621-v, 1993.
Saltiel, A. R. and Pessin, J. E.: Insulin signaling pathways in time and space, Trends Cell Biol., 12, 65–71, https://doi.org/10.1016/s0962-8924(01)02207-3, 2002.
Sato, F., Kurokawa, M., Yamauchi, N., and Hattori, M. A.: Gene silencing of myostatin in differentiation of chicken embryonic myoblasts by small interfering RNA, Am. J. Physiol.: Cell Physiol., 291, 538–545, https://doi.org/10.1152/ajpcell.00543.2005, 2006.
Shen, L., Weber, C. R., Raleigh, D. R., Yu, D., and Turner, J. R.: Tight junction pore and leak pathways: a dynamic duo, Annu. Rev. Physiol., 73, 283–309, https://doi.org/10.1146/annurev-physiol-012110-142150, 2011.
Sherlock, G.: Gene Ontology: tool for the unification of biology, Can. Inst. Food Sci. Tech. J., 22, 415, https://doi.org/10.1016/S0315-5463(89)70537-X, 2009.
Smith, J. H.: Relation of body size to muscle cell size and number in the chicken, Poult. Sci., 42, 283–290, https://doi.org/10.3382/ps.0420283, 1963.
Sobolewska, A., Elminowska-Wenda, G., Bogucka, J., Szpinda, M., Walasik, K., Bednarczyk, M., and Paruszewska-Achtel, M.: Myogenesis–possibilities of its stimulation in chickens, Folia Biol., 59, 85–90, https://doi.org/10.3409/fb59_3-4.85-90, 2011.
Szulc, P., Munoz, F., Marchand, F., Chapurlat, R., and Delmas, P. D.: Rapid loss of appendicular skeletal muscle mass is associated with higher all-cause mortality in older men: the prospective MINOS study, Am. J. Clin. Nutr., 91, 1227–1236, https://doi.org/10.3945/ajcn.2009.28256, 2010.
Tang, J.: Association of the rs2268388 Polymorphism of ACACB Gene with Diabetic Mellitus and Diabetic Kidney Disease, Kunming Medical University, Kunming, 2015.
Teber, E. T., Liu, J. Y., Ballouz, S., Fatkin, D., and Wouters, M. A.: Comparison of automated candidate gene prediction systems using genes implicated in type 2 diabbetes by genome-wide association studies, BMC Bioinformatics, 10, S69, https://doi.org/10.1186/1471-2105-10-S1-S69, 2009.
Thomas, K., Engler, A. J., and Meyer, G. A.: Extracellular matrix regulation in the muscle satellite cell niche, Connect. Tissue Res., 56, 1–8, https://doi.org/10.3109/03008207.2014.947369, 2015.
Trapnell, C., Roberts, A., Goff, L., Pertea, G., Kim, D., and Kelley, D. R.: Differential gene and transcript expression analysis of RNA-seq experiments with TopHat and Cufflinks, Nat. Protoc., 7, 562–578, https://doi.org/10.1038/nprot.2012.016, 2012.
Trapnell, C., Hendrickson, D. G., Sauvageau, M., Goff, L., Rinn, J. L., and Pachter, L.: Differential analysis of gene regulation at transcript resolution with RNA-seq, Nat. Biotechnol., 31, 46–53, https://doi.org/10.1038/nbt.2450, 2013.
Velleman, S. G.: Muscle development in the embryo and hatchling, Poult. Sci., 86, 1050–1054, https://doi.org/10.1093/ps/86.5.1050, 2007.
Wang, H. Y., Liu, R. R., Zhao G. P., Zheng, M. Q., Li, Q. H., Li, P., Liu, L., and Wen, J.: Identification of Reference Genes by Real-Time Quantitative PCR and Western Blot in Chicken Muscle Tissues, Acta Vet. Zootech. Sin., 46, 1107–1113, 2015.
Wylie, S. R., Bourke, D. L., Theon, A., and Bandman, E.: Myosin heavy chain expression following myoblast transfer into regenerating chicken muscle, Basic Appl. Myol., 5, 43–56, 1995.
Xue, Q., Zhang, G., Li, T., Ling, J., Zhang, X., and Wang, J.: Transcriptomic profile of leg muscle during early growth in chicken, PLoS One, 12, e0173824, https://doi.org/10.1371/journal.pone.0173824, 2017.
Yao, Y., Liu, T., Wang, X., and Zhang, D.: The contrary effects of Sirt1 on MCF7 cells depend on CD36 expression level, J. Surg. Res., 238, 248–254, https://doi.org/10.1016/j.jss.2019.01.046, 2019.
Yi, B., Chen, L., Sa, R., Zhong, R., Xing, H., and Zhang, H.: Transcriptome profile analysis of breast muscle tissues from high or low levels of atmospheric ammonia exposed broilers (Gallus gallus), PLoS One, 11, e0162631, https://doi.org/10.1371/journal.pone.0162631, 2016.
Yin, H., Zhang, S., Gilbert, E. R., Siegel, P. B., Zhu, Q., and Wong, E. A.: Expression profiles of muscle genes in postnatal skeletal muscle in lines of chickens divergently selected for high and low body weight, Poult. Sci., 93, 147–154, https://doi.org/10.3382/ps.2013-03612, 2014.
Zhang, M.: Effects and Mechanism of FABP3 Gene on LPS-Induced Inflammation Response in Bovine Mammary Epithelial Cells, Huazhong Agricultural University, Huazhong, 2015.
Zhao, P. and Hoffman, E. P.: Embryonic myogenesis pathways in muscle regeneration, Dev. Dyn., 229, 380–392, https://doi.org/10.1002/dvdy.10457, 2004.
Zhao, R., Li, S., Chen, W., Lei, Z., and Chen, J.: A comparative study of pituitary GH gene expression between broiler and layer chickens during embryonic and neonatal development, Acta Vet. Zootech. Sin., 32, 5–10, 2001.
Zhou, J., Ni, K., and Lv, G.: Structure and working mechanism of myosin, J. Mol. Catal., 21, 272–279, 2007.