
the Creative Commons Attribution 4.0 License.
the Creative Commons Attribution 4.0 License.
 | 11 Jun 2020
Assessment of genetic diversity and differentiation among four indigenous Turkish sheep breeds using microsatellites
Bahar Argun Karsli
Eymen Demir
Huseyin Goktug Fidan
Taki Karsli
Conservation and breeding programmes of livestock species depend on determination of genetic diversity. Today in livestock species, microsatellite markers are commonly used to reveal population structure and genetic diversity in both breeds and varieties. In this study, population structure, genetic diversity, and differentiation among four native Turkish sheep breeds including Güney Karaman, Kangal, Norduz, and Karakas were assessed by using 21 microsatellite loci. By genotyping 120 individuals belonging to four sheep breeds, a total of 275 different alleles, 37 of which were private alleles, were observed across all loci. The mean number of alleles per breed ranged from 7.28 (Güney Karaman) to 8.09 (Karakas), while allelic richness ranged from 7.22 (Güney Karaman) to 7.87 (Karakas). Mean observed heterozygosity varied from 0.60 (Kangal) to 0.66 (Norduz and Karakas). The lowest pairwise FST value (0.084) was between Kangal and Karakas populations, while the highest pairwise FST value (0.142) was between Norduz and Karakas populations. Polymorphic information content (PIC) values, ranging from 0.71 (ETH10) to 0.91 (OarFCB304), were highly polymorphic (PIC > 0.5) and informative in studied populations. In the present study, the results of phylogenetic analysis were of importance, since all studied populations have been accepted as Akkaraman varieties till today. However, factorial correspondence and structure analysis, pairwise FST values, and an unweighted pair group method with arithmetic mean analysis (UPGMA) dendrogram revealed that Güney Karaman and Norduz populations have became genetically different from the Akkaraman breed due being raised in different parts of Turkey under different climatic conditions together with their breeding practices. Therefore, we recommend that more comprehensive molecular studies should be conducted to clarify genetic differentiation of Akkaraman sheep varieties.
- Article
(799 KB) - Full-text XML
- BibTeX
- EndNote


Sheep's milk and meat are important foodstuffs for the feeding of society. Sheep raising supports breeders' incomes and the economy of Turkey with nearly 34 million sheep (TUIK, 2019). A large part of the sheep population raised in Turkey is represented by native breeds. Although native sheep breeds have low milk and meat yields, they are resistant to temperature changes and diseases of raised regions (Soysal et al., 2005). Sheep raising has always been a part of cultural values of Turkey through its history. In rural areas, sheep rearing not only makes a contribution to breeders' incomes but also is a lifestyle known as nomadic sheep breeding. Furthermore, Turkey makes a contribution to world animal genetic resources with nearly 20 defined native sheep breeds (Ertugrul et al., 2009).
Mainly distributed in Middle Anatolia and nearby places, Akkaraman is the most raised breed with an approximately 40 % proportion among Turkish native sheep breeds (Karaca et al., 2003; Ertugrul et al., 2009). There are different varieties of the Akkaraman breed such as Güney Karaman (GKR), Norduz (NRD), Karakas (KRK), and Kangal (KNG) adapted to different regions (Karaca et al., 2003; Karsli et al., 2011). GKR, also known as black sheep, is reared in the Mediterranean region (especially in Antalya, Mersin, and Hatay provinces) in a nomadic breeding system (Karsli et al., 2011). The NRD variety is raised in Van Province, whereas KRK sheep are raised in Eastern Anatolia including Diyarbakır, Van, Bitlis, and Hakkâri provinces (Bingol and Aygun, 2014). KNG, raised extensively in Sivas and Malatya provinces, has the largest body size among variety of the Akkaraman breed (Kurar et al., 2012; Karsli et al., 2011). Since KNG sheep have been derived from the Akkaraman breed by selection in the recent past, they show similar phenotypic traits as Akkaraman sheep. On the contrary, GKR, NRD, and KRK sheep have differed from Akkaraman distinctively in terms of phenotypic traits due to rearing in different regions together with diverse adaptation processes for a long time.
It has been reported that GKR, NRD, and KRK breeds are in danger of extinction (Ertugrul et al., 2009). While GKR has been included in a conservation programme at Bahri Dagdas International Agricultural Research Institute authorized by the Ministry of Agriculture and Forestry, General Directorate of Agricultural Research and Policies, NRD and KRK breeds have been under a conservation programme handled by breeders (Ertugrul et al., 2009).
Genetic diversity shaped by evolution and climate changes is crucial for the survival of populations in different regions (Kumar et al., 2006). Sheep populations raised near the domestication centre have higher genetic diversity which decreases with increasing geographic distance (Kijas et al., 2009). There is strong evidence that the domestication centre of sheep is the Fertile Crescent including southeastern and Eastern Anatolia of Turkey (Alberto et al., 2018). Sheep were spread out from the Fertile Crescent to other regions of the world. Today, sheep are raised in almost all regions of the world including both desert and tropical regions due to their extraordinary adaptability (Amills et al., 2017).
Genetic diversity studies are the first step of conservation and breeding programmes. Many molecular markers such as RAPD (Kunene et al., 2009), AFLP (De Marchi et al., 2006), PCR-RFLP (Kucharski et al., 2019), and mtDNA (Kirikci et al., 2018) have been applied to detect genetic diversity in livestock. Today, SSRs (simple sequence repeats (Demir and Balcioğlu, 2019) and SNPs (single nucleotide polymorphisms) (Ilori et al., 2018) and NGS (next-generation sequencing) (Kijas et al., 2009) are preferred to reveal genetic diversity among and within different livestock breeds.
SSR markers are commonly used to reveal genetic diversity because they are abundant, distributed through genome randomly, easy to access and apply, highly polymorphic, and show codominant inheritance. SSR markers were used to detect genetic diversity or parentage test in different livestock including cattle (Demir and Balcioğlu, 2019), sheep (Ocampo et al., 2016), goat (Jawasreh et al., 2018), pigs (Szmatoła et al., 2016), horses (Semik and Za̧bek, 2013) chickens (Karsli and Balcioğlu, 2019), rabbit (Abdel-Kayf et. al., 2016), ducks (Hariyono et al., 2019), and donkeys (Han et al., 2017).
Despite the huge phenotypic variations among GKR, NRD, and KRK sheep, they are known as varieties of the Akkaraman sheep breed. Unfortunately, genetic studies focusing on population structure and phylogenetic relationship among these varieties are scarce. In addition, there are not enough studies revealing genetic diversity in NRD and GKR whose population sizes have decreased in the last few decades. Hence, this study aimed to determine genetic diversity and phylogenetic relationship among KNG, GKR, NRD, and KRK populations by using 21 SSR markers.
2.1 Collection of blood samples and genomic DNA extraction
In this study, a total of 120 sheep (from both sexes) were chosen from four sheep breeds raised in different regions in Anatolia (Fig. 1). Samples belonging to KNG (n=30) sheep were collected from Sivas Province; NRD (n=30) and KRK (n=30) samples were collected from Van Province, and GKR (n=30) samples were collected from Antalya Province. Samples of each sheep breed were collected from at least three different farms between 2016 and 2018. No ethical approval was necessary for the present study, since blood samples were collected during routine veterinary visits. Genomic DNA was extracted from blood samples using salting-out method reported by Miller et al. (1988). DNA quality and quantity were determined using agarose gel (1 %) and spectrophotometer (NanoDrop-SD 1000). DNA concentration was adjusted to 50 ng µL for PCR process after DNA extraction.
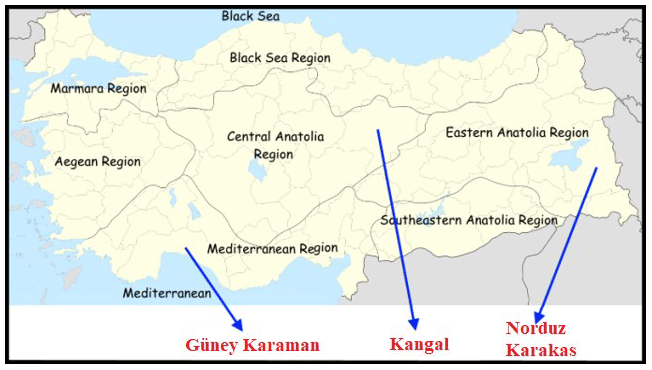
Figure 1Geographical raising regions of four Turkish native sheep populations. Note: the base map of Turkey was downloaded from the web (https://tr.wikipedia.org/wiki/Dosya:Turkey_region_map_with_province_borders.svg, last access: 9 June 2020).
2.1.1 Microsatellite genotyping
In the present study, a total of 21 microsatellite loci, 14 of which are recommended by FAO (2011) to determine genetic diversity in sheep, were used. PCR amplifications were carried out in a total volume of 25 µL PCR mixture. PCR mixture consisted of 2–2.5 µL genomic DNA (50 ng µL−1), 1.2 µL HQ buffer (Geneall), 2 µL dNTPs (2.5 mM µL−1), 0.25 µL of each primer (10 pmol µL−1), 0.4 µL (2.5 U µL) Taq polymerase (Geneall), and distilled deionized water. PCR reaction conditions were performed as follows: initial denaturation at 95 ∘C for 5 min, followed by 30 cycles of denaturation at 94 ∘C for 45 s, annealing (at 50–60 ∘C for different loci) for 45 s, extension at 72 ∘C for 45 s, and final extension at 72 ∘C for 5 min.
In this study, 96 automated capillary electrophoresis systems (Advanced Analytical Technologies, Iowa, USA) were used for fragment analysis. The capillary conditioning solution, inlet buffer, separation gel, and 35–500 bp marker were prepared according to the user manual provided by the manufacturer. After capillary electrophoresis separation, the raw data were recorded, and band sizes were calculated using PROSize® 2.0 version 1.3.1.1 (Advanced Analytical Technologies, Iowa, USA).
2.1.2 Statistical analysis
Number of private alleles (PA) and allele size range (ASR) was determined by using the Convert version 1.3.1 (Glaubitz, 2004) program. Convert version 1.3.1 (Glaubitz, 2004) was also used to convert data to other program's file formats. Number of alleles (Na), number of effective alleles (Ne), observed (HO) and expected heterozygosity (HE) values, and genetic distance values among four sheep populations were calculated using the POPGENE version 1.31 (Yeh et al., 1997) software package. The Ml-Nullfreq program (Kalinowski and Taper, 2006) was used to calculate null allele frequencies for each locus in four sheep populations. Polymorphic information content (PIC) values were calculated with Excel Microsatellite Toolkit ver. 3.1 (Park, 2001); genetic differences (pairwise FST) between the populations were determined by using Arlequin software ver. 3.1 (Excoffier et al., 2005). Inbreeding coefficient (FIS) and allelic richness values were obtained with FSTAT software v.1.2 (Goudet, 1995). The significance of FIS values for populations was tested by using Arlequin software ver. 3.1 (Excoffier et al., 2005).
The phylogenetic relationship among studied sheep populations were determined according to unweighted pair group method with arithmetic mean analysis (UPGMA) dendrogram constructed on basis of Nei's standard genetic distance (Nei, 1987). The UPGMA dendrogram was obtained by the POPGENE version 1.31 (Yeh et al., 1997) program. In addition, factorial correspondence analysis (FCA) and Bayesian approach based on STRUCTURE clustering analysis were carried out. GENETIX ver. 4.05 (Belkhir et al., 2004) software was used for FCA analysis. Bayesian model-based clustering was constructed by using Structure software (Pritchard et al., 2000). One hundred independent runs were carried out for different genetic clusters (K is from 2 to 4; K is the number of clusters,) with a burn-in period of 100 000 iterations and a total of 500 000 Markov chain Monte Carlo (MCMC) under an admixture model and correlated allele frequencies. Structure Harvester (Earl and von Hold, 2012) was used to determine the most probable K value, by the calculation of the ΔK statistics as described by Evanno et al. (2005). The CLUMPAK software was used to visualize the Structure outputs (Kopelman et al., 2015).
3.1 Genetic diversity among sheep populations
In this study, all microsatellite loci were polymorphic. Basic genetic diversity parameters and PIC values calculated for 21 microsatellite loci (Table 1). In four sheep populations, mean number of alleles and effective alleles were 13.10 and 7.78, respectively, across 21 microsatellite loci. The lowest (6.03) and the highest (13.74) allelic richness (AR) values were detected in ETH10 and CSRD247, respectively. PIC value ranged from 0.71 (ETH10) to 0.91 (OarFCB304) with a mean of 0.84.
Table 1Descriptive statistics for genetic diversity over 21 microsatellite loci in four local Turkish sheep populations.

N: total number of samples used at each locus; ASR: allele size range. Na: number of alleles at each locus; Ne: effective number of alleles at each locus; AR: allelic richness; PIC: polymorphic information content; F(Null): null allele frequency.
Descriptive statistics together with private alleles for sheep populations are given in Table 2. The mean number of alleles per population ranged from 7.28 (GKR) to 8.09 (KRK), while AR ranged from 7.22 (GKR) to 7.87 (KRK). Mean observed heterozygosity varied from 0.60 (KNG) to 0.66 (NRD and KRK). Private alleles, another parameter of genetic differentiation, ranged from 7 (KRK) to 12 (KNG).
Table 2Descriptive statistics for genetic diversity of each sheep population over 21 loci.
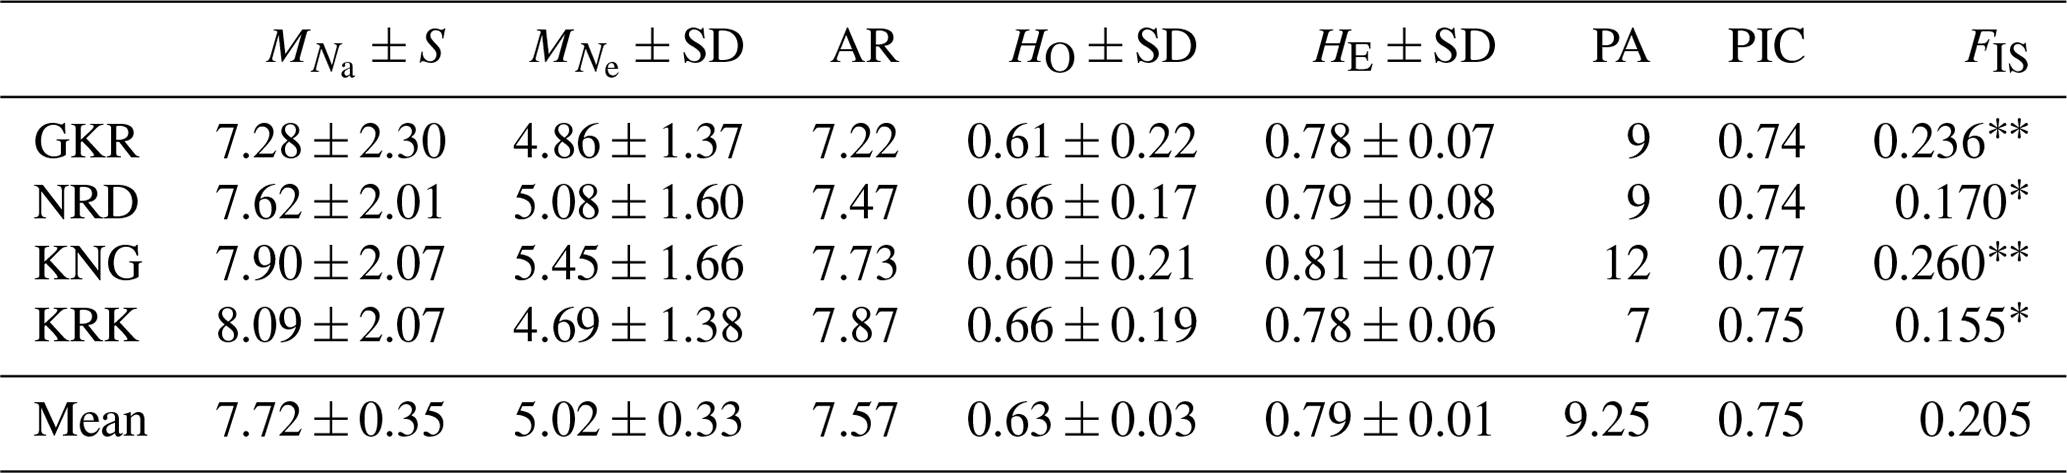
GKR: Güney Karaman; NRD: Norduz; KNG: Kangal; KRK: Karakas. : mean number of alleles per breed; : mean number of effective alleles per breed; AR: allelic richness per breed; HO: average observed heterozygosity per breed; HE: average expected heterozygosity per breed; FIS: Inbreeding coefficient; PA: number of private alleles; frequency higher than >10 %; SD: standard deviation. Significantly different from zero: p<0.01; * p<0.05. PIC: the average polymorphic information content. Inbreeding coefficient value ranged from 0.155 (KRK) to 0.260 (KNG) with a mean of 0.205.
3.2 Genetic differentiation and phylogenetic analysis among populations
Pairwise FST values based on 21 microsatellite loci are given in Table 3 for each sheep population.
Table 3Pairwise FST values among the studied four sheep breeds.
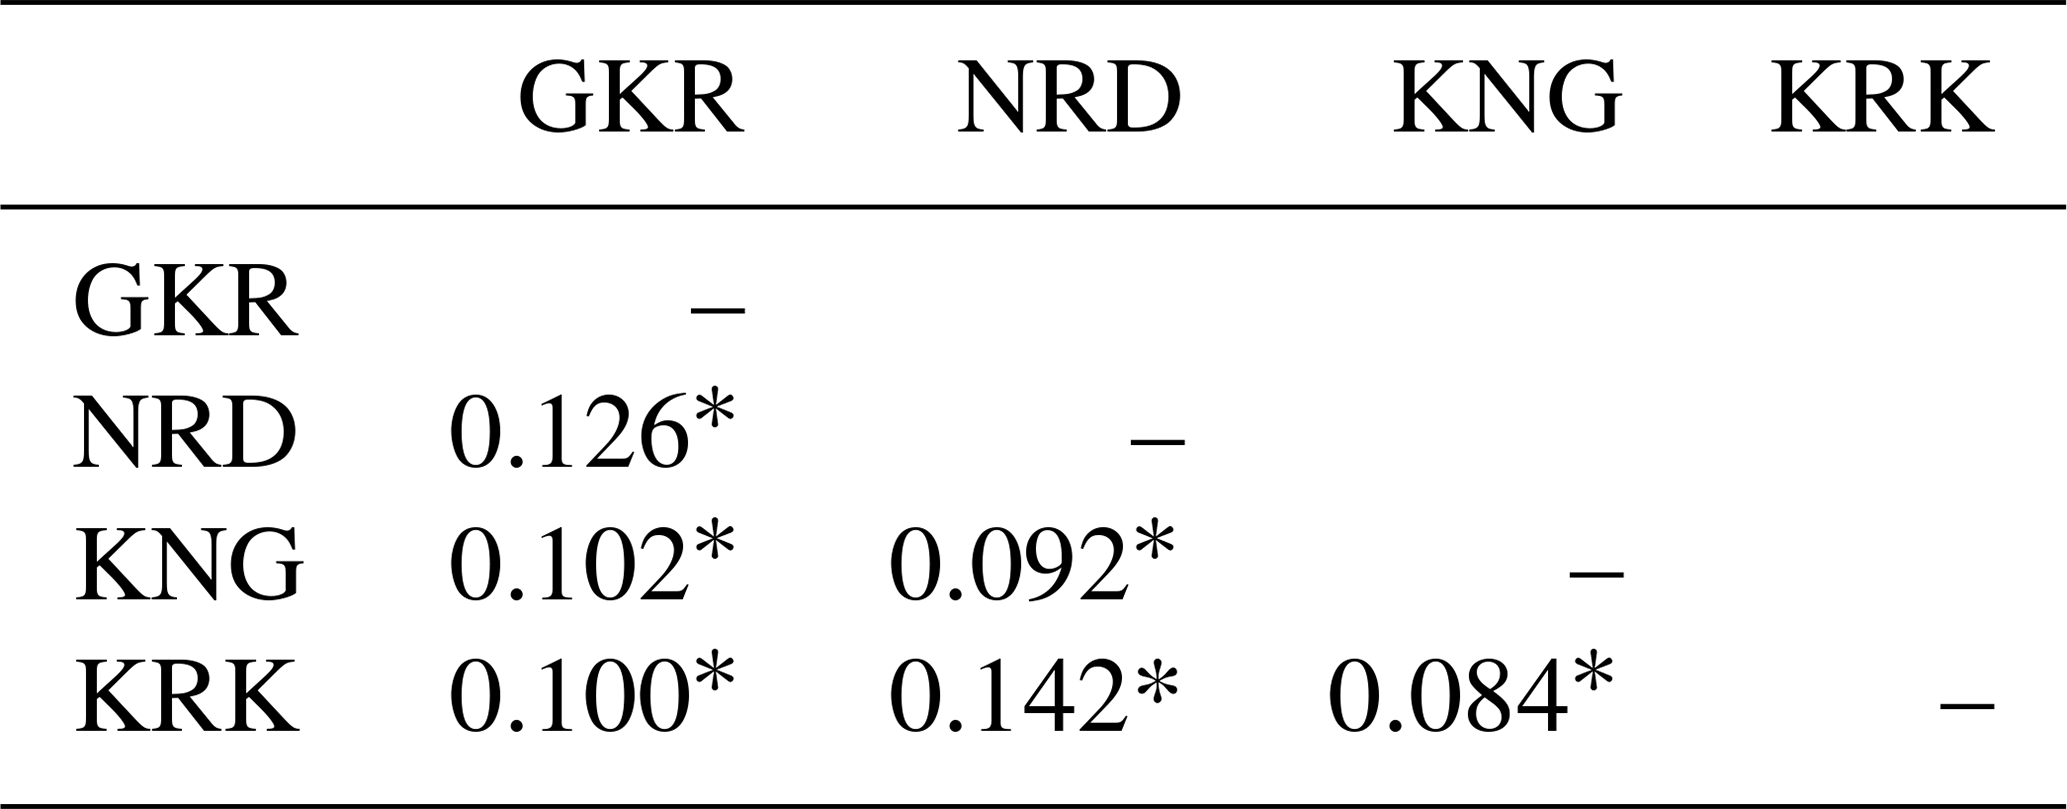
GKR: Güney Karaman; NRD: Norduz; KNG: Kangal; KRK: Karakas. ∗ p<0.01.
The lowest pairwise FST value (0.084) was between KNG and KRK populations, while the highest pairwise FST value (0.142) was between NRD and KRK populations.
Nei's genetic distance values in studied populations are given in Table 4. The lowest genetic distance (0.088) was between KNG and KRK populations, while the highest genetic distance (0.153) was between KRK and NRD populations.
Table 4Nei's (1987) genetic distance values among populations.

GKR: Güney Karaman; NRD: Norduz; KNG: Kangal; KRK: Karakas.
A UPGMA dendrogram based on Nei's genetic distance values is given in Fig. 2 for studied populations. The UPGMA dendrogram classified studied populations in two branches in which GKR, KNG, and KRK constituted the first branch, while NRD population clustered separately in the other branch.
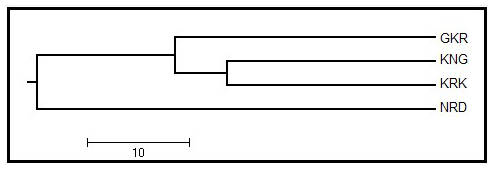
Figure 2UPGMA dendrogram among four native sheep populations based on Nei's genetic distance values. GKR: Güney Karaman; NRD: Norduz; KNG: Kangal; KRK: Karakas.
Four native Turkish sheep populations were located in three-dimensional space by FCA analysis given in Fig. 3. The FCA analysis separated the NRD and GKR populations very clearly, while KRK and KNG clustered close together.
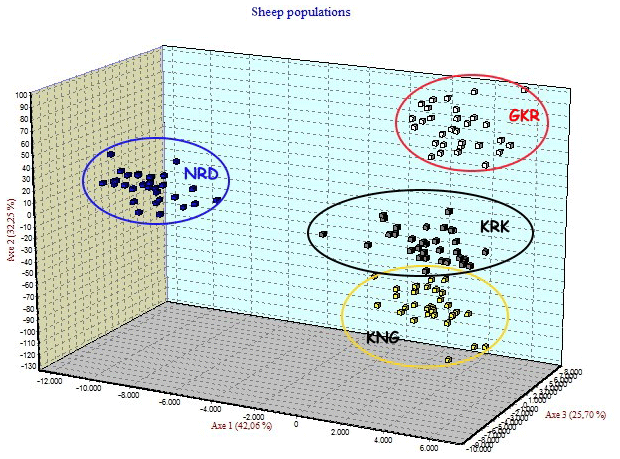
Figure 3Factorial correspondence analysis among four sheep breeds. GKR: Güney Karaman; NRD: Norduz; KNG: Kangal; KRK: Karakas.
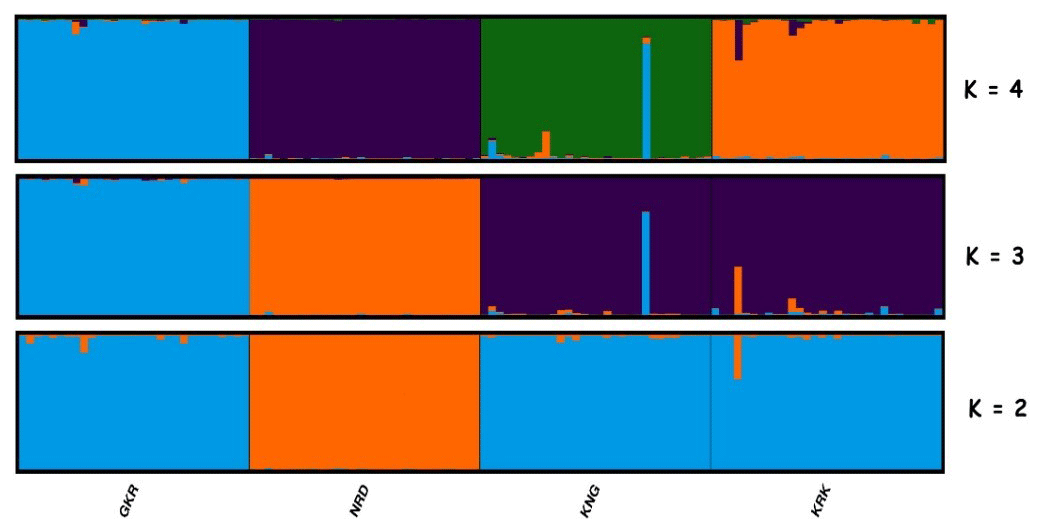
Figure 4Structure cluster analysis of the studied individuals. The highest ΔK value was obtained at K=3. GKR: Güney Karaman; NRD: Norduz; KNG: Kangal; KRK: Karakas.
Structure analysis, another clustering method, revealed that GKR, KNG, and KRK populations clustered together, while NRD clustered separately at K=2 (Fig. 4). At K=3, determined by structure harvester to be most likely number of clusters, KNG and KRK populations clustered together, whereas NRD and GKR showed very clear separate clusters. These findings imply that although KNG and KRK populations may be typical varieties of the Akkaraman sheep breed, GKR and NRD populations, which showed clear differentiation in structure analysis, may be considered to be genetically different. In addition, the result of structure analysis was accordant with the result of FCA analysis.
Genetic diversity parameters detected in the present study were similar or slightly higher than previous studies. Using 18 microsatellite loci in nine native Turkish sheep breeds, Yilmaz et al. (2014) observed mean number of alleles and effective alleles as 10.11 and 9.62, respectively, with AR ranging from 6.48 (OARFCB20) to 13.75 (OarFCB304). Yilmaz et al. (2015) reported mean number of alleles and effective alleles as 12.29 and 7.04, respectively in Gökçeada, Kıvırcık, Karacabey Merino, and Sakız sheep breeds by using 17 microsatellite loci, while Oner et al. (2014) reported mean number of alleles and effective alleles as 11.89 and 5.65, respectively in Kıvırcık, Pırlak, and Karacabey Merino sheep breeds by using 10 microsatellite loci. These results show that four native Turkish sheep populations hold high genetic diversity. The high mean PIC value (0.84) detected across 21 microsatellite loci indicates that these microsatellite loci have ability to show genetic diversity in native Turkish sheep populations. Although the mean PIC value was similar to previous studies conducted in native Turkish sheep breeds (Yilmaz et al., 2014, 2015), a lower PIC value was reported by Oner et al. (2014, 0.78), which used 10 microsatellite loci. Mean number of alleles and observed heterozygosity were reported as 8.78–0.78 and 8.33–0.74 in NRD and KRK, respectively (Yilmaz et al., 2014).
Although these values were higher than values detected in the present study, similar observed heterozygosity values were reported in some native Turkish sheep breeds including Karayaka (0.69), Morkaraman (0.60), Sakız (0.59), and Tuj (0.62) (Yilmaz et al., 2014). Additionally, similar observed heterozygosity values (ranging from 0.65 to 0.70) were reported in some native Italian sheep breeds (Ceccobelli at al., 2015, 2016). Lower HE (expected heterozygosity) values were reported in Akkaraman (0.73), Hemşin (0.69), Karayaka (0.72), Morkaraman (0.72), and Tuj (0.73) sheep breeds (Gutiérrez-Gil et al., 2006). Genetic diversity parameters detected in four populations show that native Turkish sheep populations still conserve enough genetic diversity.
In this study, expected heterozygosity values were higher than observed heterozygosity values, which may be due to presence of more homozygous individuals. Additionally, positive inbreeding coefficient values were detected due to presence of more homozygous individuals than heterozygous ones. Although similar FIS values were reported in NRD (0.161) and KRK (0.131) sheep breeds (Yilmaz et al., 2014), lower FIS values were reported in Akkaraman (Soysal et al., 2005; Gutiérrez-Gil et al., 2006) and some native Italian sheep breeds (Lasagna et al., 2011; Ceccobelli et al., 2016). It is not surprising that higher FIS values were detected in KNG, since KNG was derived from the Akkaraman breed by selection studies in the past. A selection process focusing only on desired alleles for many traits such as meat and/or milk yield could cause increased homozygosity and inbreeding in a population. High inbreeding detected in GKR may be due to a decrease in the effective population size. Indeed, GKR was subjected to a conservation programme at Bahri Dagdas International Agricultural Research Institute authorized due to danger of extinction (Ertugrul et al., 2009). In addition, high but not dangerous levels of inbreeding were observed in NRD and KRK populations. Presence of null alleles or nonrandom mating in populations may cause increased FIS values. It is reported that null allele frequency higher than 0.20 may affect estimates of some parameters such as observed heterozygosity and inbreeding coefficient (Mahammi et al., 2016; Chybicki and Burczyk, 2009). High null allele frequency (>0.2) was detected in only OarJMP29 and ETH10 loci. This could be attributed to breeding system and small population size rather than the null alleles.
All pairwise FST values were significant (p<0.01), implying that the four sheep populations could be considered genetically different. It has been highlighted in previous studies that the four sheep populations are varieties or types of the Akkaraman breed (Karaca et al., 2003; Karsli et al., 2011). However, presence of high genetic differentiation among the four sheep populations is not surprising considering that they are raised in different parts of Turkey under different climatic conditions along side their breeding practices (for instance, KNG sheep have been derived from Akkaraman via selection). Indeed, adaptation and in particular selection may change genotypic structure by affecting gene and genotype frequencies. On the contrary, detection of the highest pairwise FST value between NRD and KRK is surprising, because they are raised in the same part of Turkey. Therefore, investigation of maternal and paternal origins based on mtDNA and Y chromosome is needed.
In this study, the number of private alleles ranging from 7 (KRK) to 12 (KNG) was higher than previous studies conducted on native Turkish sheep breeds (Yilmaz et al., 2014, 2015). Number of private alleles is affected by number of migrated individuals across populations. It is normal to observe a low number of private alleles in the case of the presence of migrated individuals from different populations or populations coming from a common origin. The number of private alleles and pairwise FST values obtained in this study weaken the idea that these populations come from the same common ancestor (Akkaraman). However, it should not be neglected that adaptation and breeding processes of these populations for a long time may also lead to genetic differentiation. Compared to other populations, presence of the highest number of private alleles in the KNG population may be due to selection studies in this population. According to FCA analysis, Yilmaz et al. (2014) reported a higher genetic admixture among six Turkish native sheep populations including NRD and KRK. On the contrary, in the present study both Structure and FCA analysis revealed that NRD population clearly clustered separate from other studied populations and no admixture was detected between NRD and other sheep populations in FCA analysis. Moreover, GKR population also clustered separately based on Structure and FCA analysis.
This study revealed that KNG, GKR, NRD, and KRK populations still hold enough genetic diversity despite decreasing in population sizes in the last few decades. Inbreeding coefficient values were not at high levels affecting the sustainable use of NRD and KRK populations in the future. Nevertheless, high inbreeding coefficients were detected in KNG and GKR, which requires taking measures in order to decrease inbreeding. In this study, genetic differentiation coefficients and phylogenetic analysis show that GKR and NRD populations, which have been accepted as Akkaraman varieties, have became genetically different from the Akkaraman breed. In order to clarify the genetic differentiation of GKR and NRD from the Akkaraman breed, more comprehensive molecular studies (such as SNP chips or next-generation sequencing etc.) are needed.
The data sets are available upon request from the corresponding author.
ED, HGF, and TK provided samples. ED and HFG performed DNA extraction and PCR stages. BAK and TK performed statistical analysis of data. BAK, TK, and ED wrote the article.
The authors declare that they have no conflict of interest.
This paper was edited by Steffen Maak and reviewed by two anonymous referees.
Abdel-Kayf, E. M., Ghaly, L. S., Ben Larbi, M., Ahmed, S. S., Badawi, Y. K., and Hassan, N. S.: Genetic diversity and phenotype characterization of native rabbit in Middle-Egypt, J. New Sci., 16, 1312–1320, 2016.
Alberto, F. J., Boyer, F., Orozco-terWengel, P., Streeter, I., Servin, B., de Villemereuil, P., Benjelloun, B., Librado, P., Biscarini, F., Colli, L., Barbato, M., Zamani, W., Alberti, A., Engelen, S., Stella, A., Joost, S., Ajmone-Marsan, P., Negrini, R., Orlando, L., Rezaei, H. R., Naderi, S., Clarke, L., Flicek, P., Wincker, P., Coissac, E., Kijas, J., Tosser-Klopp, G., Chikhi, A., Bruford, M. W., Taberlet, P., and Pompanon, F.: Convergent genomic signatures of domestication in sheep and goats, Nat. Commun., 9, 1–9, 2018.
Amills, M., Capote, J., and Tosser-Klopp, G.: Goat domestication and breeding: a jigsaw of historical, biological and molecular data with missing pieces, Anim. Genet., 48, 631–644, https://doi.org/10.1111/age.12598, 2017.
Belkhir, K., Borsa, P., Chikhi, L., Raufaste, N., and Bonhomme, F.: GENETIX 4.05, Windows TM software for population genetics. University of Montpellier II, Montpellier, France, 2004 (in French).
Bingol, E. and Aygun, T.: The growth and developing traits of Karakas ewes in Hakkari, Iğdır Univ. J. Inst. Sci. Tech., 4, 65–73, 2014 (in Turkish).
Ceccobelli, S., Karsli, T., Di Lorenzo, P., Marozzi, G., Landi, V., Sarti, F. M., Sabbioni A., and Lasagna, E.: Genetic diversity of Cornigliese sheep breed using STR markers, Small Ruminant Res., 123, 62–69, https://doi.org/10.1016/j.smallrumres.2014.09.009, 2015.
Ceccobelli, S., Di Lorenzo, P., Panella, F., Lasagna, E., and Sarti, F. M.: Morphological and genetic characterisation of Pagliarola breed and its genetic relationships with other three indigenous Italian sheep breeds, Ital. J. Anim. Sci. 15, 47–54, https://doi.org/10.1080/1828051X.2016.1139325, 2016.
Chybicki, I. J. and Burczyk, J.: Simultaneous estimation of null alleles and inbreeding coefficients, J. Hered., 100, 106–113, https://doi.org/10.1093/jhered/esn088, 2009.
De Marchi, M., Dalvit, C., Targhetta, C., and Cassandro, M.: Assessing genetic diversity in indigenous Veneto chicken breeds using AFLP markers, Anim. Genet., 37, 101–105, https://doi.org/10.1111/j.1365-2052.2005.01390.x, 2006.
Demir, E. and Balcioğlu, M. S.: Genetic diversity and population structure of four cattle breeds raised in Turkey using microsatellite markers, Czech J. Anim. Sci., 64, 411–419, https://doi.org/10.17221/62/2019-CJAS, 2019.
Earl, D. A. and von Holdt, B. M.: STRUCTURE HARVESTER: A web-site and program for visualizing structure output and implementing the Evanno method, Conserv. Genet. Resour., 4, 359–361, https://doi.org/10.1007/s12686-011-9548-7, 2012.
Ertugrul, M., Dellal, G., Soysal, İ., Elmacı, C., Akın, O., Pehlivan, E., Soysal, M. I., and Arat, S.: Conservation and Sustainable Use of Farm Animal Genetic Resources in Turkey, Bursa Uludag Univ. Ziraat Fak. Der., 23, 97–119, 2009 (in Turkish).
Evanno, G., Regnaut, S., and Goudet, J.: Detecting the number of clusters of individuals using the software STRUCTURE: A simulation study, Mol. Ecol., 14, 2611–2620, https://doi.org/10.1111/j.1365-294X.2005.02553.x, 2005.
Excoffier, L., Laval, G., and Schneider, S.: Arlequin version 3.01: An integrated software package for population genetics data analysis, Evol. Bioinform., 1, 47–50, https://doi.org/10.1177/117693430500100003, 2005.
FAO: Molecular genetic characterization of animal genetic resources, FAO animal production and health guidelines, No. 9, available at: http://www.fao.org/3/i2413e/i2413e00.pdf (last access: 14 February 2020), 2011.
Glaubitz, J. C.: A user-friendly program to reformat dip–loid genotypic data for commonly used population genetic software packages, Mol. Ecol. Resour., 4, 309–310, https://doi.org/10.1111/j.1471-8286.2004.00597.x, 2004.
Goudet, J.: FSTAT (version 1.2): a computer program to calculate F-statistics, J. Hered., 86, 485–486, 1995.
Gutiérrez-Gil, B., Uzun, M., Arranz, J. J., San Primitivo, F., Yildiz, S., Cenesiz, M., and Bayón, Y.: Genetic diversity in Turkish sheep, Acta Agr. Scand. A-An., 56, 1–7, https://doi.org/10.1080/09064700600641681, 2006.
Han, H., Chen, N., Jordana, J., Li, C., Sun, T., Xia, X., Zhao, X., Shen, S., Yu, J., Ainhoa, F., Chen, H., Lei, C., and Dang, R.: Genetic diversity and paternal origin of domestic donkeys, Anim. Genet., 48, 708–711, https://doi.org/10.1111/age.12607, 2017.
Hariyono, D. N. H., Maharani, D., Cho, S., Manjula, P., Seo, D., Choi, N, Sidadolog, J. H. P., and Lee, J.: Genetic diversity and phylogenetic relationship analyzed by microsatellite markers in eight Indonesian local duck populations, Asian-Austral. J. Anim., 32, 31–37, https://doi.org/10.5713/ajas.18.0055, 2019.
Ilori, B. M., Rosen, B. D., Sonstegard, T. S., Bankole, O. M., Durosaro, S. O., and Hanotte, O.: Assesment of OvineSNP50 in Nigerian and Kenyan sheep populations, Nig. J. Biotech., 35, 176–183, https://doi.org/10.4314/njb.v35i2.21, 2018.
Jawasreh, K., Ababneh, M. M., Ismail, Z. B., Younes, A. M. B., and Al Sukhi, A. I.: Genetic diversity and population structure of local and exotic sheep breeds in Jordan using microsatellite markers, Vet. World, 11, 778–781, https://doi.org/10.14202/vetworld.2018.778-781, 2018.
Kalinowski, S. T. and Taper, M. L.: Maximum likelihood estimation of the frequency of null alleles at microsatellite loci, Conserv. Genet., 7, 991–995, https://doi.org/10.1007/s10592-006-9134-9, 2006.
Karaca, O., Akyuz, N., Andic, S., and Altın, T.: Milk yield characteristics of Karakas sheep, Turk. J. Vet. Anim. Sci., 27, 589–594, 2003.
Karsli, T. and Balcioğlu, M. S.: Genetic characterization and population structure of six Brown layer pure lines using microsatellite markers, Asian-Austral. J. Anim., 32, 49–57, https://doi.org/10.5713/ajas.17.0870, 2019.
Karsli, T., Sahin, E., Karsli, B. A., Eren, M. G., and Balcioglu, M. S.: An investigation of presence of FecB, FecXG, FecXH allele in Kangal and Guney Karaman sheep using PCR-RFLP method, Lalahan Hay. Arast. Ens. Derg., 51, 71–80, 2011.
Kijas, J. W., Townley, D., Dalrymple, B. P., Heaton, M. P., Maddox, J. F., McGrath, A., Wilson, P., Ingersoll, R. G., McCulloch, R., McWilliam, S., Tang, D., McEwan, J., Cockett, N., Oddy, V. H., Nicholas, F. W., and Raadsma, H.: A genome wide survey of SNP variation reveals the genetic structure of sheep breeds, PloS one, 4, e4668, https://doi.org/10.1371/journal.pone.0004668, 2009.
Kirikci, K., Noce, A., Cam, M. A., Mercan, L., and Amills, M.: The analysis of mitochondrial data indicates the existence of populatin substructure in Karayaka sheep, Small Ruminant Res., 162, 25–29, https://doi.org/10.1016/j.smallrumres.2018.02.007, 2018.
Kopelman, N. M., Mayzel, J., Jakobsson, M., Rosenberg, N. A., and Mayrose, I.: Clumpak: a program for identifying clustering modes and packaging population structure inferences across K, Mol. Ecol. Resour., 15, 1179–1191, https://doi.org/10.1111/1755-0998.12387, 2015.
Kucharski, M., Kaczor, U., and Piórkowska, K.: Genetic variability in the loci of FABP4, PPARγ and SCD genes of sheep breeds raised for different purposes, Ann. Anim. Sci., 19, 937–954, https://doi.org/10.2478/aoas-2019-0033, 2019.
Kumar, D., Sharma, R., Pandey, A., Gour, D. S., Malik, G., Ahlawat, S. P. S., and Jain, A.: Genetic diversity and bottleneck analysis of Indian Bellary sheep by mcrosatellite markers, Russ. J. Genet.+, 9, 996–1005, https://doi.org/10.1134/S1022795407090050, 2006.
Kunene, N. W., Bezuidenhout, C. C., and Nsahlai, I. V.: Genetic and phenotypic diversity in Zulu sheep populations: Implications for exploitation and conservation, Small Ruminant Res., 84, 100–107, https://doi.org/10.1016/j.smallrumres.2009.06.012, 2009.
Kurar, E., Bulut, Z., Caglayan, T., Garip, M., Yılmaz, A., and Nizamlioglu, M.: Investigation of genetic diversity and paternity in Kangal White Karaman rams using Microsatellite Markers, Kafkas Univ. Vet. Fak. Derg., 18, 973–977, 2012 (in Turkish).
Lasagna, E., Bianchi, M., Ceccobelli, S., Landi, V., Martínez, A. M., Pla, J. L., Panella, F., Bermejo, J. V. D., and Sarti, F. M.: Genetic relationships and population structure in three Italian Merino-derived sheep breeds, Small Ruminant Res., 96, 111–119, https://doi.org/10.1016/j.smallrumres.2010.11.014, 2011.
Mahammi, F. Z., Gaouar, S. B. S., Laloë, D., Faugeras, R., Tabet-Aoul, N., Rognon, X., Tixier-Boichard, M., and Saidi-Mehtar, N.: A molecular analysis of the patterns of genetic diversity in local chickens from western Algeria in comparison with commercial lines and wild jungle fowls, J. Anim. Breed. Genet., 133, 59–70, https://doi.org/10.1111/jbg.12151, 2016.
Miller, S. A., Dykes, D. D., and Polesky, H. F.: A simple salting out procedure for extracting DNA from human nucleated cells, Nucleic Acids Res., 16, 1215, https://doi.org/10.1093/nar/16.3.1215, 1988.
Nei, M.: Molecular evolutionary genetics, Columbia University Press, New York, USA, 1987.
Ocampo, R., Cardona, H., and Martinez, R.: Genetic diversity of Colombian sheep by microsatellite markers, Chilean J. Agr. Res., 76, 1, https://doi.org/10.4067/S0718-58392016000100006, 2016.
Oner, Y., Ustuner, H., Orman, A., Yilmaz, O., and Yilmaz, A.: Genetic diversity of Kivircik sheep breed reared in different regions and its relationship with other sheep breeds in Turkey, Ital. J. Anim. Sci., 13, 3382, https://doi.org/10.4081/ijas.2014.3382, 2014.
Park, S. D. E.: Trypanotolerance in West African cattle and the population genetic effects of selection, PhD Thesis, Dublin University, Dublin, Ireland, 2001.
Pritchard, J. K., Matthew, S., and Donnelly, P.: Inference of population structure using multilocus genotype data, Genet., 155, 945–995, 2000.
Semik, E. and Ząbek, T.: Application of 7 STR markers for parentage testing and genetic distance study of Equidae, Ann. Anim. Sci., 13, 229–239, https://doi.org/10.2478/aoas-2013-0005, 2013.
Soysal, M. I., Koban, E., Ozkan, E., Altunok, V., Bulut, Z., Nizamlioglu, M., and Togan, I.: Evolutionary relationship among three native, two crossbreed sheep breeds of Turkey: Preliminary results, Rev. Med. Vet., 156, 289–293, 2005.
Szmatoła, T., Ropka-Molik, K., Tyra, M., Piórkowska, K., Żukowski, K., Oczkowicz, M., and Blicharski, T.: The genetic structure of five pig breeds maintained in Poland, Ann. Anim. Sci., 16, 1019–1027, https://doi.org/10.1515/aoas-2016-0006, 2016.
TUIK: Turkish Statistical Institute, available at: http://www.tuik.gov.tr/PreTablo.do?alt_id=1002 (last access: 14 February 2020), 2019.
Yeh, F. C., Yang, R. C., Boyle, T. B. J., Ye, Z. H., and Mao, J. X.: POPGENE, the user-friendly shareware for population genetic analysis, Molecular Biology and Biotechnology Centre, University of Alberta, Edmonton, Canada, 1997.
Yilmaz, O., Cemal, I., and Karaca, O.: Genetic diversity in nine native Turkish sheep breeds based on microsatellite analysis, Anim. Genet., 45, 604–608, https://doi.org/10.1111/age.12173, 2014.
Yilmaz, O., Sezenler, T., Sevim, S., Cemal, I., Karaca, O., Yaman, Y., and Karadag, O.: Genetic relationships among four Turkish sheep breeds using microsatellites, Turk. J. Vet. Anim. Sci., 39, 576–582, 2015.