
the Creative Commons Attribution 4.0 License.
the Creative Commons Attribution 4.0 License.
 | 08 Aug 2025
Genetic diversity in German Pomeranian Coarsewool sheep and the possibility of breeding for maedi-visna resistance
Cassandra Frölich
Martin Ganter
Olusegun Olaniyi Adeniyi
Gesine Lühken
Knowledge of genetic diversity among sheep breeds is essential for conserving genetic resources, in particular when selective-breeding programs are taken into consideration, for example, to enhance disease resistance. Maedi-visna virus (MVV) is an incurable, progressive sheep disease caused by a small-ruminant lentivirus (SRLV) infection. In certain sheep breeds, MVV susceptibility has been associated with the allele E of the ovine transmembrane protein gene (TMEM154), whereas the allele K in a homozygous state is protective. The present study estimated the genetic diversity of the native German Pomeranian Coarsewool (RPL, “Rauhwolliges Pommersches Landschaf”) sheep breed and evaluated the possibility of breeding for MVV resistance. A total of 185 RPL sheep were genotyped using the Illumina ovine 50K single-nucleotide polymorphism (SNP) BeadChip to calculate genetic diversity indicators such as effective population size (Ne13= 116) and Wright's F statistical indices (FIS= 0.005). The mean inbreeding coefficient based on runs of homozygosity (FROH) was 6.2 %, with a moderate correlation (0.42) with the pedigree-based coefficient (FPED). Overall, the calculated genetic diversity parameters indicate that the diversity in the RPL breed is not at risk. Thus, breeding for MVV resistance would be possible without a major loss of genetic diversity due to the relatively high frequency of the allele K (54 %). However, selection for the TMEM154 allele K across the entire breed is not advised until further studies confirm its protective effect against MVV in the RPL breed.
- Article
(3666 KB) - Full-text XML
- BibTeX
- EndNote


Sheep (Ovis aries) are descendants of the wild Asian mouflon and were one of the first domesticated species around 10 000 years ago (Scherf and Pilling, 2015). Since domestication, 1500 unique sheep breeds have developed worldwide due to local environmental and human management adaptations (Scherf and Pilling, 2015; Yang et al., 2016). These various influences have resulted in great genetic diversity within the sheep population, but this diversity is currently threatened by economic forces and modernized agriculture (Tisdell, 2003). More than any other continent, Europe is home to almost half of all sheep breeds (Rischkowsky and Pilling, 2007). Of these European breeds, 14 % are already extinct, 43 % are at risk of extinction, and only 15 % are considered “safe” (FAO, 2024). The loss of this diversity is also leading to increased inbreeding, resulting in a higher risk of recessive genetic defects and jeopardizing genetic improvement and adaptation to future environmental, food production, and disease challenges (Keller and Waller, 2002; Rege and Gibson, 2003). The preservation of the genetic diversity of local breeds is considered imperative due to the role of this diversity as a genetic resource for potential future benefits and as cultural heritage (Mendelsohn, 2003). In this context, studying the genetic diversity of well-adapted local breeds is important to develop suitable breeding programs that will help to maintain and improve their genetics (Scherf and Pilling, 2015).
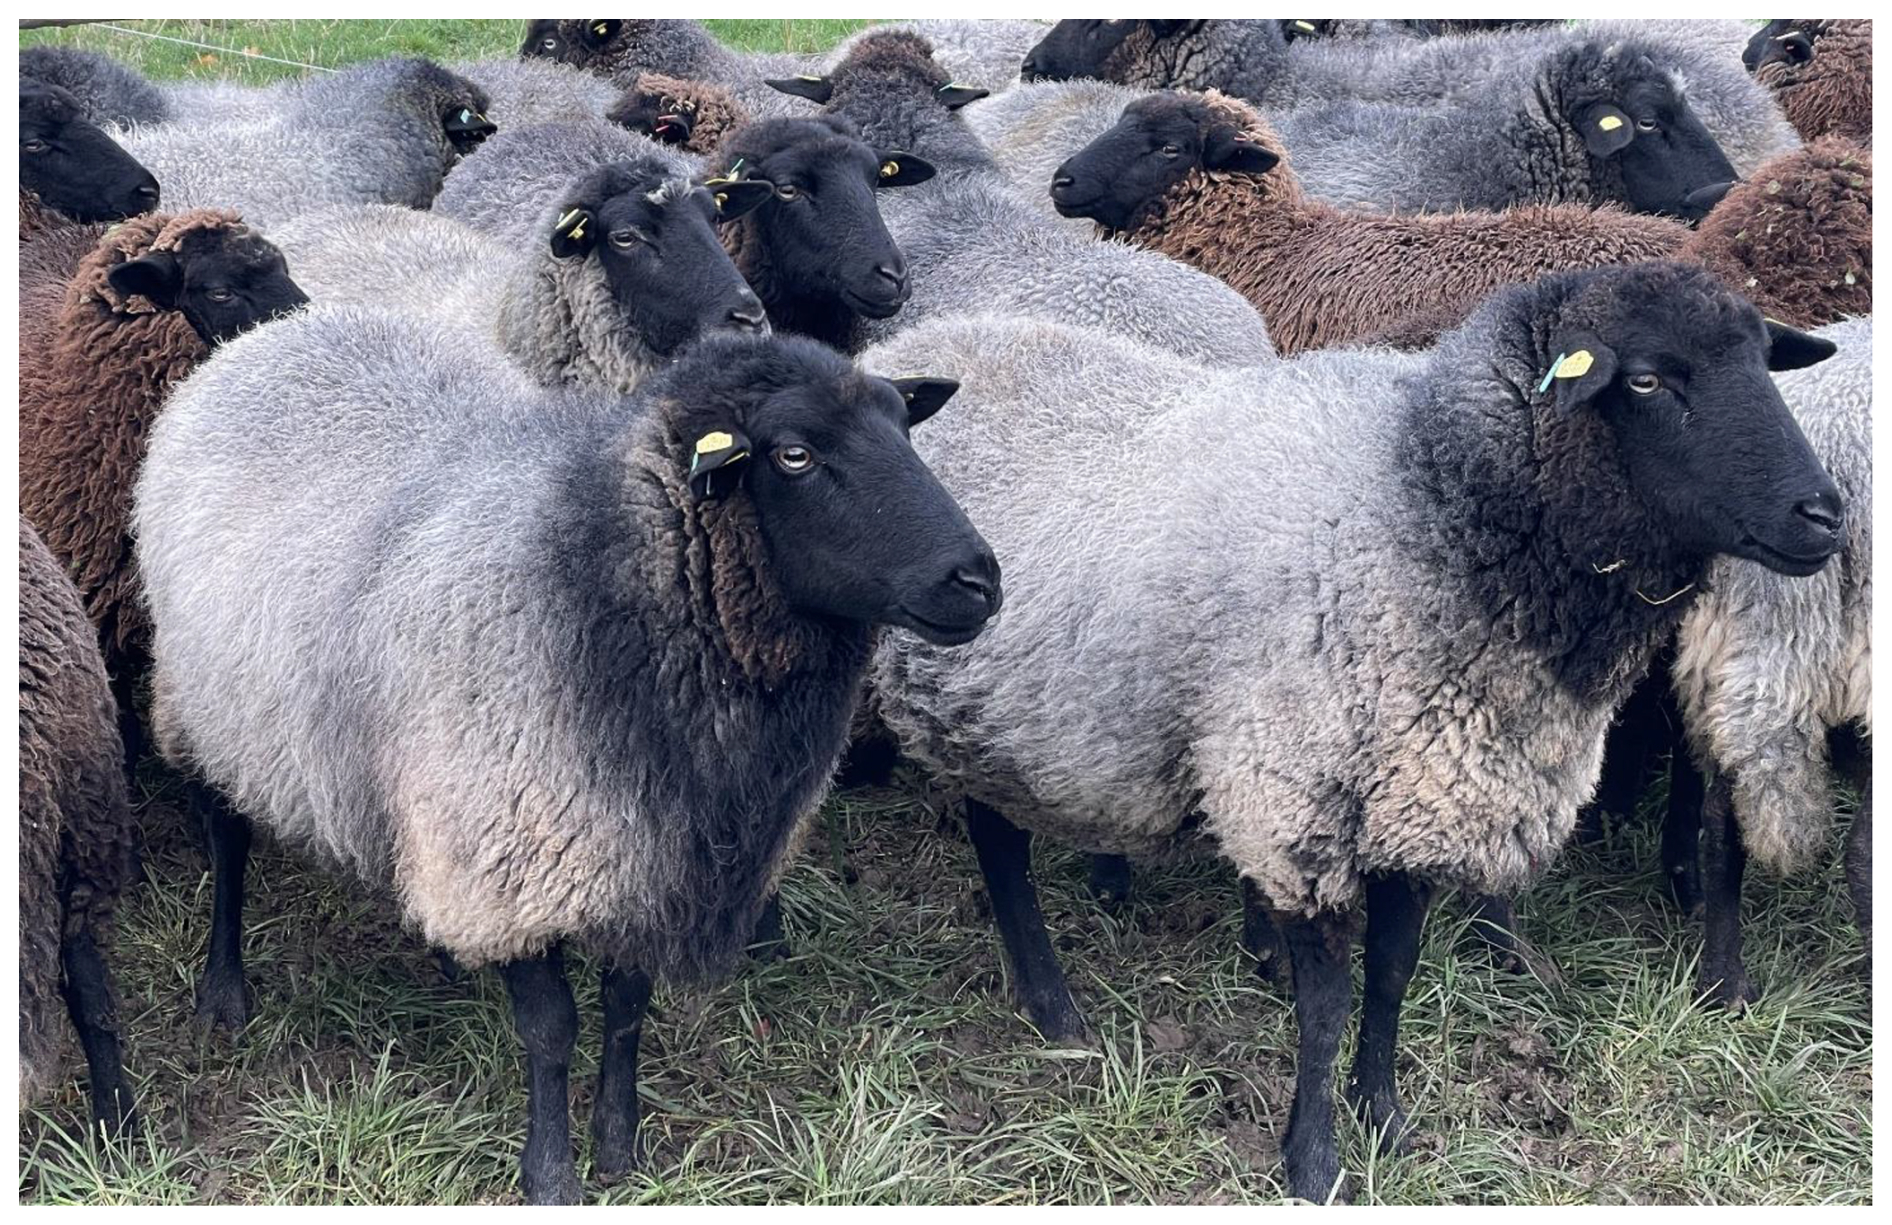
In Germany, 20 of the approximately 40 native sheep breeds are endangered, particularly the so-called “land sheep breeds” such as the Pomeranian Coarsewool sheep (RPL, “Rauhwolliges Pommersches Landschaf”) (GEH, 2024; Scherf, 2000). The RPL is a medium-sized, polled sheep with gray to blue-gray wool on their bodies, whereas their heads and legs are black and free of wool (Gaede, 1926; Grumbach, 2002) (Fig. 1). This breed originated from the island of Rügen in Pomerania and resulted from crosses between the extinct German Zaupelschaf and Hannoversche Landschaf breeds (Gaede, 1926; Grumbach and Zupp, 2008). In 1936, the RPL population comprised 70 200 animals. This number increased to 110 000 after the Second World War due to the breed's high robustness and low maintenance requirements (Grumbach, 2002). However, as the economic situation stabilized, sheep breeds with higher productivity were favored, resulting in a decline in the RPL population (Grumbach and Zupp, 1992). In 1962, the last three registered RPL breeding sheep were shown at an exhibition (Grumbach, 2002).
Conservation efforts with respect to this indigenous German breed started in 1982, with 46 ewes, 7 rams, 8 female yearlings, and lambs, as part of a program that was initiated by the United Nations (UN) resolution for the protection of endangered cultural breeds (Grumbach, 2002; Grumbach and Zupp, 1992). Initially, there were seven original Pomeranian ram lines, and these lines were later supplemented by the S-line from a breeder in southwestern Germany (IGRPL, 2024). Due to the limited original population size and the occurrence of bottlenecks, a line-rotation breeding method was implemented to avoid further inbreeding (Grumbach, 2002). This method is still used today, maintaining almost 3500 herdbook-registered RPL sheep in Germany (VDL, 2023). Although the population size is increasing, the RPL breed remains at risk according to the German Society for the Conservation of Old and Endangered Livestock Breeds (GEH). This is because the GEH considers not only the current population but also other factors with an influence on the situation of a breed, e.g., the number of active breeders, offspring rates, and the existence of state subsidy programs (GEH, 2024).
An additional challenge in the conversation of genetic diversity is selective breeding for phenotypic traits or for functional traits, e.g., disease resistance. The RPL breed is known to be less susceptible to certain diseases, such as foot rot and scrapie (Drögemüller et al., 2004; Grumbach and Zupp, 2008; Rischkowsky and Pilling, 2007). For several years, prion protein gene (PRNP) alleles associated with scrapie resistance have been considered in the selection of sires (Grumbach, 2002). In the future, breeding for maedi-visna virus (MVV) resistance could be an additional opportunity. In many breeds, the susceptibility to MVV is associated with the ovine transmembrane protein 154 gene (TMEM154) (Heaton et al., 2012). At position 35 of the TMEM154 protein, the amino acid lysine (K allele) has a protective effect in certain sheep breeds in the homozygous form, while the presence of the amino acid glutamate (E allele) is associated with susceptibility. In the RPL breed, this association between TMEM154 genotypes (hereafter always referring to the variation at position 35 of the protein) and MVV seropositivity showed a trend towards significance (p= 0.09) (Frölich et al., 2024). One discussed reason for the lack of significance was the low number of serologically MVV-positive sheep (30 out of 849), of which 26 RPL sheep carried the TMEM154 genotype EK/EE and four exhibited the genotype KK. As the putative protective genotype KK and allele K were present in 28 % and 53 % of the genotyped RPL population, respectively, selective breeding could be an additional tool to eradicate MVV in infected flocks or even in the whole breed.
Before considering selective breeding for the TMEM154 allele K, it is crucial to assess the current genetic diversity of this breed and understand how it might be influenced by selection. Various studies have calculated population genetic parameters such as effective population size (Ne), expected heterozygosity (He), observed heterozygosity (Ho), and Wright's F statistical indices (FIS) to describe the genetic diversity of different sheep breeds (Adeniyi et al., 2022; Al-Mamun et al., 2015; Sveistiene and Tapio, 2021). However, the state-of-the-art method for inbreeding analysis using genotyping data is the calculation of the inbreeding coefficient (FROH) based on runs of homozygosity (ROH) (Peripolli et al., 2017). Many studies have shown that this coefficient is more accurate than the pedigree-based inbreeding coefficients (FPED) (Burren et al., 2016; McQuillan et al., 2008; Meyermans et al., 2020a; Wiener et al., 2017).
The aim of the present study was to analyze the genetic diversity of the native German RPL breed and to investigate the possibility of selection for the TMEM154 allele K without compromising genetic diversity by generating and analyzing Illumina ovine 50K single-nucleotide polymorphism (SNP) chip genotyping data of this breed. Various diversity parameters were calculated not only for the entire RPL breed but also for different ram lines, to assess the effect of the registration and consideration of ram lines in breeding decisions, and for TMEM154 genotypes, to evaluate the potential loss of genetic diversity if sheep with certain genotypes were to be selected in the future.
2.1 Animal sampling and genotyping
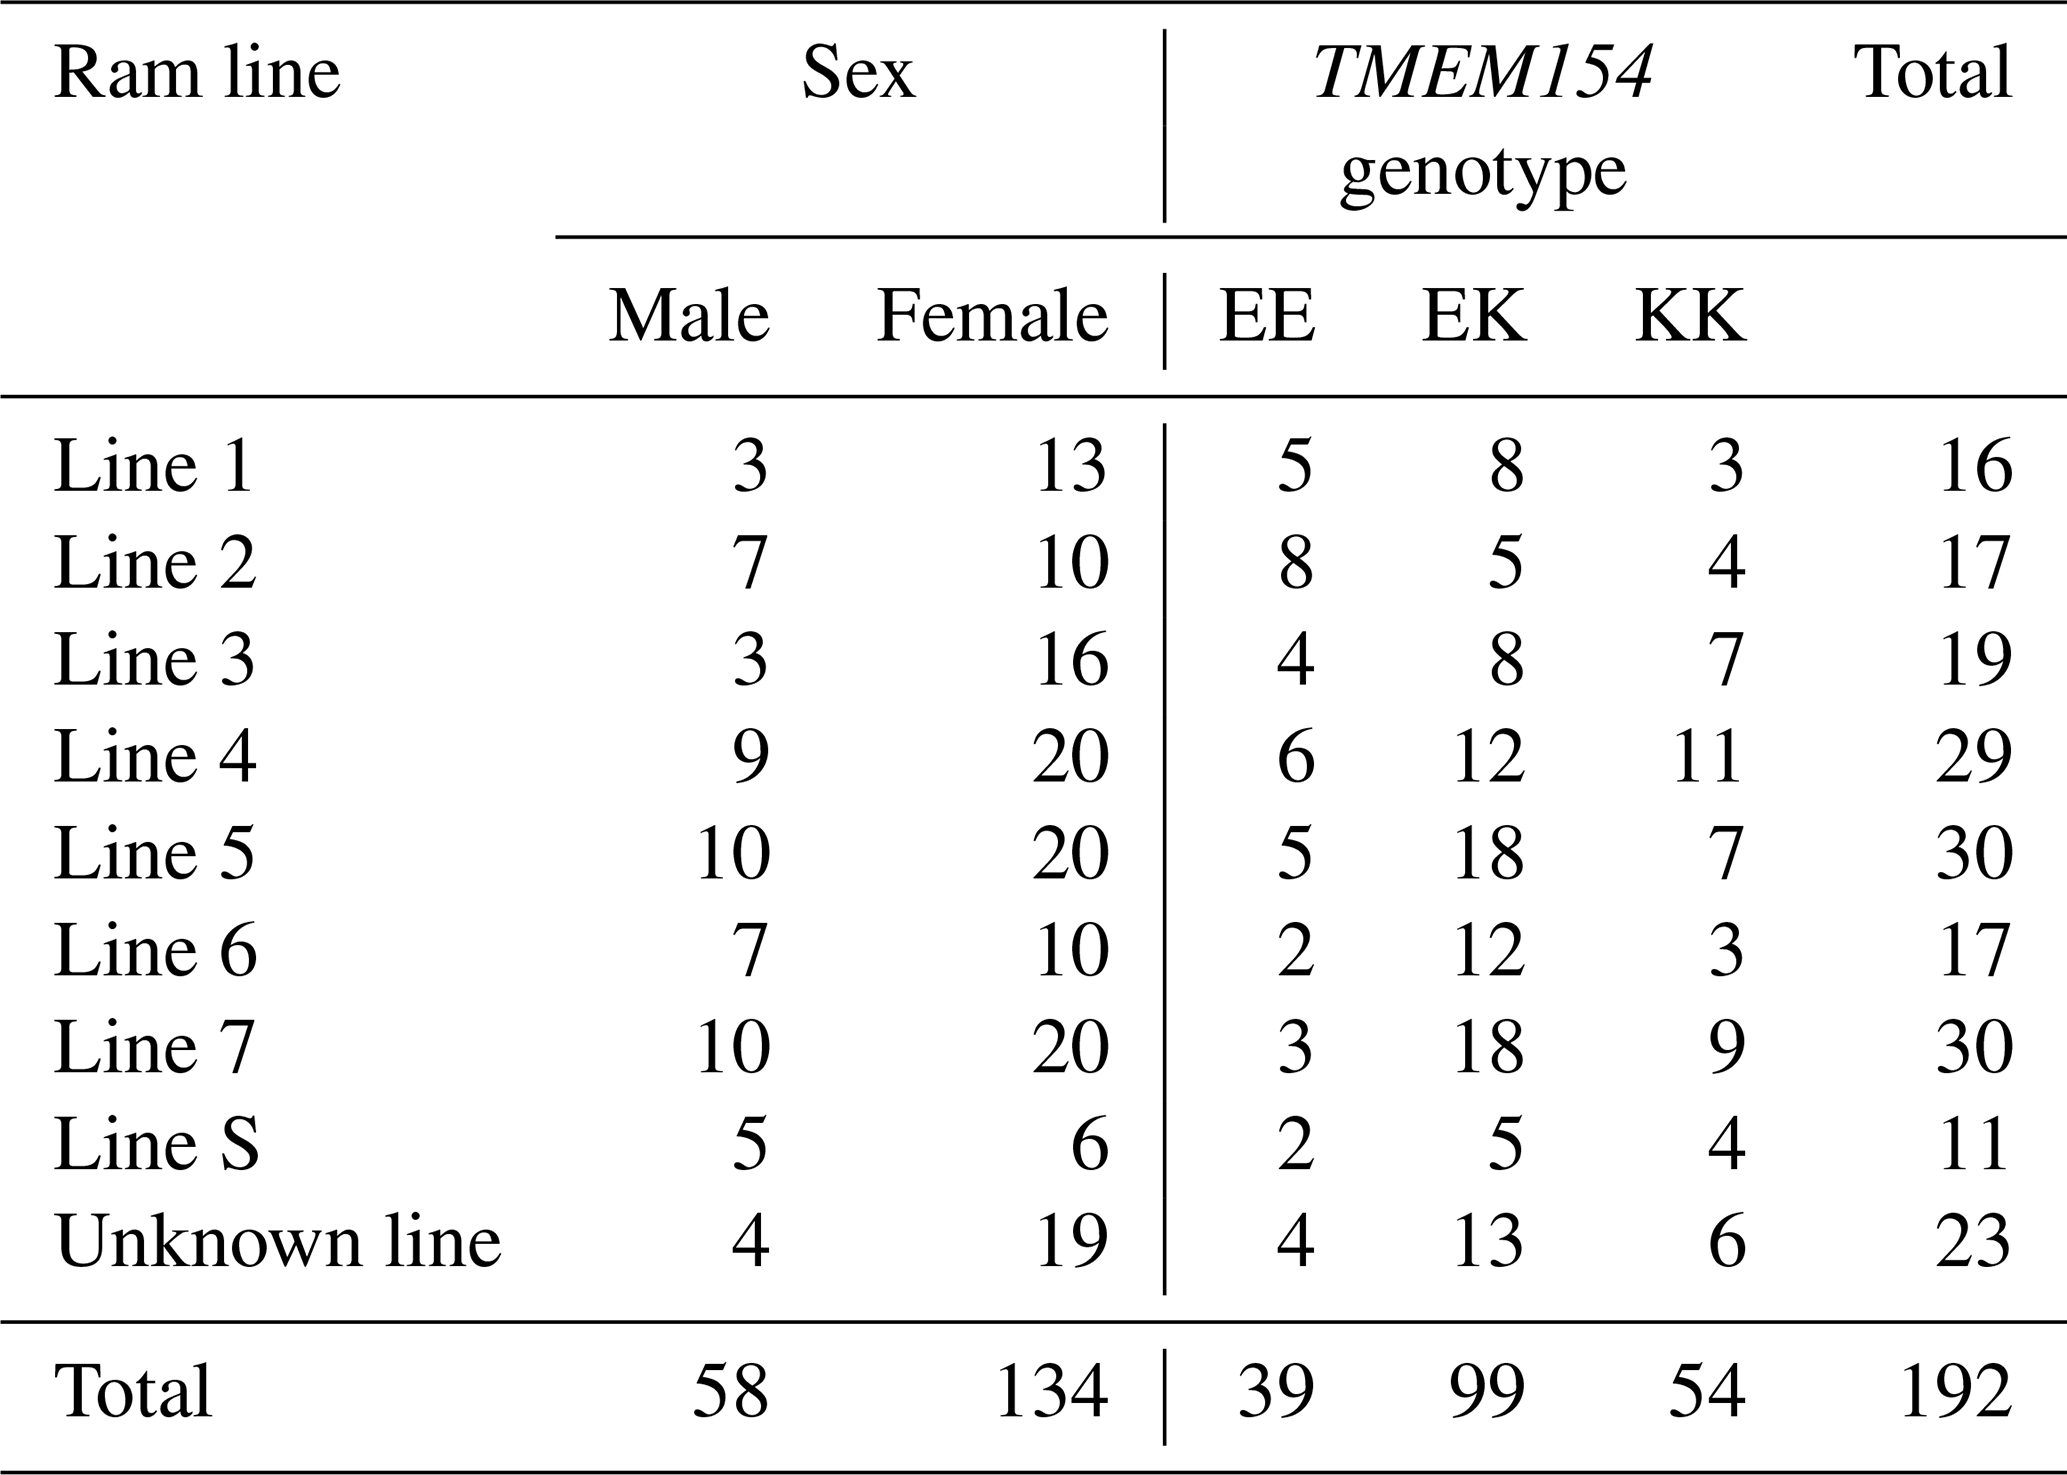
As part of this and a related project (Frölich et al., 2024), veterinarians collected ethylenediaminetetraacetic acid (EDTA) blood samples from 54 RPL flocks on voluntarily participating farms across nine German federal states (Baden-Württemberg, Brandenburg, Hesse, Lower Saxony, Mecklenburg–Western Pomerania, North Rhine-Westphalia, Saxony, Saxony-Anhalt, and Schleswig-Holstein). A representative set of not closely related RPL sheep (no first- or second-degree relatedness) was chosen for genotyping based on pedigree information. Sheep from all eight ram lines were included in the sample set; for details, see Table 1. The number of sampled sheep per flock ranged from one to nine, proportional to the flock size. A total of 192 samples from RPL sheep (187 purebred and 5 crossbred) born between 2013 and 2022 were sent to Neogen (Ayr, Scotland, UK) for genotyping using the OvineSNP50K BeadChip v.3 (Illumina, San Diego, CA, USA).
Table 1Selection of RPL sheep for the SNP chip divided by ram lines, sex, and TMEM154 genotype results.
2.2 Genome-wide SNP and TMEM154 genotyping
All 192 samples were genotyped with the OvineSNP50K BeadChip. OvineSNP50k BeadChip results for SNP OAR17_5388531 were checked for the nucleotide substitution G>A in the coding region of TMEM154, resulting in the amino acids glutamate (E) or lysine (K) at position 35 in the protein. Except for one, the samples were additionally genotyped for the TMEM154 genotypes using KASP technology (LGC, Hoddesdon, UK), as previously described by Frölich et al. (2024) and Molaee et al. (2018), to check the reliability of the SNP chip data.
2.3 Quality control analysis
A total of 192 animals and 61 918 SNPs were available for analysis. Prior to quality control (QC) analysis of the data, the “–related” function in KING version 2.2.4 was used to check the relatedness of the animals (Chen, 2024). One of each related animal of pairs with an identify-by-descent (IBD) value > 0.177 (second-degree relationship) was removed, resulting in the exclusion of three animals. After that, QC was performed using PLINK version 1.9 (Chang et al., 2015). SNPs genotyped in less than 95 % of the animals or with a minor allele frequency (MAF) lower than 5 % were removed. Additionally, only autosomal SNPs and animals with less than 5 % of missing genotypes were retained. The final dataset for genomic-based diversity analysis included 185 individuals and 52 016 high-quality SNPs.
2.4 Genetic diversity assessment
After passing QC, the “–indep-pairwise” function in PLINK version 1.9 was used to prune SNPs for linkage disequilibrium (LD) by removing one of each pair of SNPs in high LD (r2> 0.5) within a window size of 50 SNPs and with a window slider of 5 SNPs. Principal component analysis (PCA) was performed with PLINK to visualize the breed structure and to investigate diversity among the ram lines and TMEM154 genotypes. The PCA plot was generated using the “ggplot2” R package (Ginestet, 2011).
Mean observed heterozygosity (Ho) and expected heterozygosity (He) were calculated for the entire breed, each ram line, and different TMEM154 genotypes using the “hierfstat” package in R (Goudet, 2005). Ho and He were used to determine the Wright inbreeding coefficient as follows (Nei and Chesser, 1983):
The effective population size (Ne) was estimated for 5 (Ne5), 13 (Ne13), and 50 (Ne50) generations ago on the basis of LD with the “SNeP” package (Barbato et al., 2015; Weir and Hill, 1980). Additionally, Ne was calculated with published data on male (Nm) and female (Nf) population numbers (BLE, Central Documentation on Animal Genetic Resources in Germany (TGRDEU), 2024; VDL, 2023) with the following formula (Birky et al., 1983):
The expected frequencies and the number of animals per genotype class for the TMEM154 locus were calculated using Hardy–Weinberg equilibrium (HWE) equation: p2 + 2pq + q2 (Mayo, 2008), where p and q represent observed frequencies of K and E alleles, respectively. Moreover, deviation of observed genotype frequencies from HWE for the TMEM154 locus was assessed with the “HardyWeinberg” package in R using the “HWChisq()” function (Graffelman, 2015).
2.5 Genomic (FROH) and pedigree-based (FPED) inbreeding coefficient
Prior to runs of homozygosity (ROH) analysis, QC was performed on raw genotype data of unrelated animals using the abovementioned parameters with the exception of excluding SNPs based on minor allele frequency (MAF) as proposed by Meyermans (2020b). Consequently, the dataset for the ROH analysis of the entire population included 185 individuals and 60 409 high-quality SNPs. Likewise, the number of animals per group for the ROH analysis of ram lines (nine groups) and TMEM154 genotype (three groups) ranged from 11 to 29 and from 36 to 97, respectively. The “–homozyg” function in PLINK was used with the following settings for each run: a minimum ROH length of 1000 kb, a maximum gap between consecutive SNPs of 250 kb, at least one SNP per 100 kb, a scanning window threshold of 0.05, a sliding window of 50 SNPs, one missing SNP, and one heterozygous SNP. The minimum number of SNPs (l) was determined following Eq. (3) of Purfield et al. (2012):
where ns is the number of SNPs per individual, ni is the number of individuals, α is the percentage of false-positive ROH results (0.05), and het is the mean SNP heterozygosity across all SNPs. The value of l was 41 for the entire RPL breed and ranged between 33 (line S) and 40 (genotype EK) in the ram lines and TMEM154 genotypes. The total ROH number and ROH length (in Mb) were calculated for each sheep, categorized by ram line or TMEM154 genotype, and three ROH length categories (1–5, > 5–10, and > 10 Mb) for comparison. The individual genomic inbreeding coefficient of ROH (FROH) was calculated as follows (McQuillan et al., 2008):
where ∑LROH is the total length of all ROH segments per individual and LAUTO is the length of the autosomal genome covered by SNPs (2.648 Gb). Box plots were constructed to visualize the within-breed distribution of FROH per ram line and TMEM154 genotype for FROH above one Mb.
Furthermore, calculated data of pedigree-based inbreeding coefficients (FPED) using serv.it OVICAP (https://www.vit.de/vit-fuers-tier/vit-fuer-schaf-und-ziege/herdbuchfuehrung-von-schafen-und-ziegen, last access: 16 August 2024), the nationwide database for breeding sheep and goats in Germany (Wilkens, 2021), provided and maintained by the company vit – “Vereinigte Informationssysteme Tierhaltung w.V.” (Verden, Germany), was retrieved from breeders. The calculation was performed by virtual mating of the parents of the analyzed individuals, which was only possible if both parents were still alive, and ewes came from the same flock. Consequently, we obtained only 27 FPED values to compare with the FROH values using the Pearson rank correlation coefficient (rp) performed in SAS Studio Version 9.4 (SAS Institute Inc., Cary, NC, USA).
3.1 TMEM154 genotyping
Among the 191 double-genotyped samples, 181 (94.8 %) showed the same TMEM154 genotypes as determined with the KASP technology, while the remaining 10 (5.2 %) samples had inconclusive results with KASP genotyping technology but clear results in the SNP chip analysis. Details on the distribution of TMEM154 genotypes per ram lines and sex are given in Table 1.
After QC, the dataset for the genetic diversity analysis included 52 sheep with the genotype (frequency) KK (28 %), 97 with genotype EK (52 %), and 36 with genotype EE (20 %). The putative protective allele K was therefore predominant with 54 %.
Analysis of the expected frequencies for all genotypes revealed values of 29.2 %, 49.7 %, and 21.2 % for KK, EK, and EE, respectively. Likewise, the expected numbers of sheep for each genotype class were as follows: KK = 54, EK = 92, and EE = 39. In addition, a test for deviation from HWE was not significant (p= 0.51) for this locus.
3.2 Population structure
The genetic structure of the different ram lines and TMEM154 genotypes is illustrated in the PCA plots in Fig. 2. The first three principal components explain 4.8 % of the variation within the RPL breed. No distinct clusters were detected in any of the comparisons among the different principal components (PCs). Contrasting PC1 vs. PC3 most clearly showed the admixture of the ram lines (Fig. 2a) and the balanced distribution of the TMEM154 genotypes (Fig. 2b).
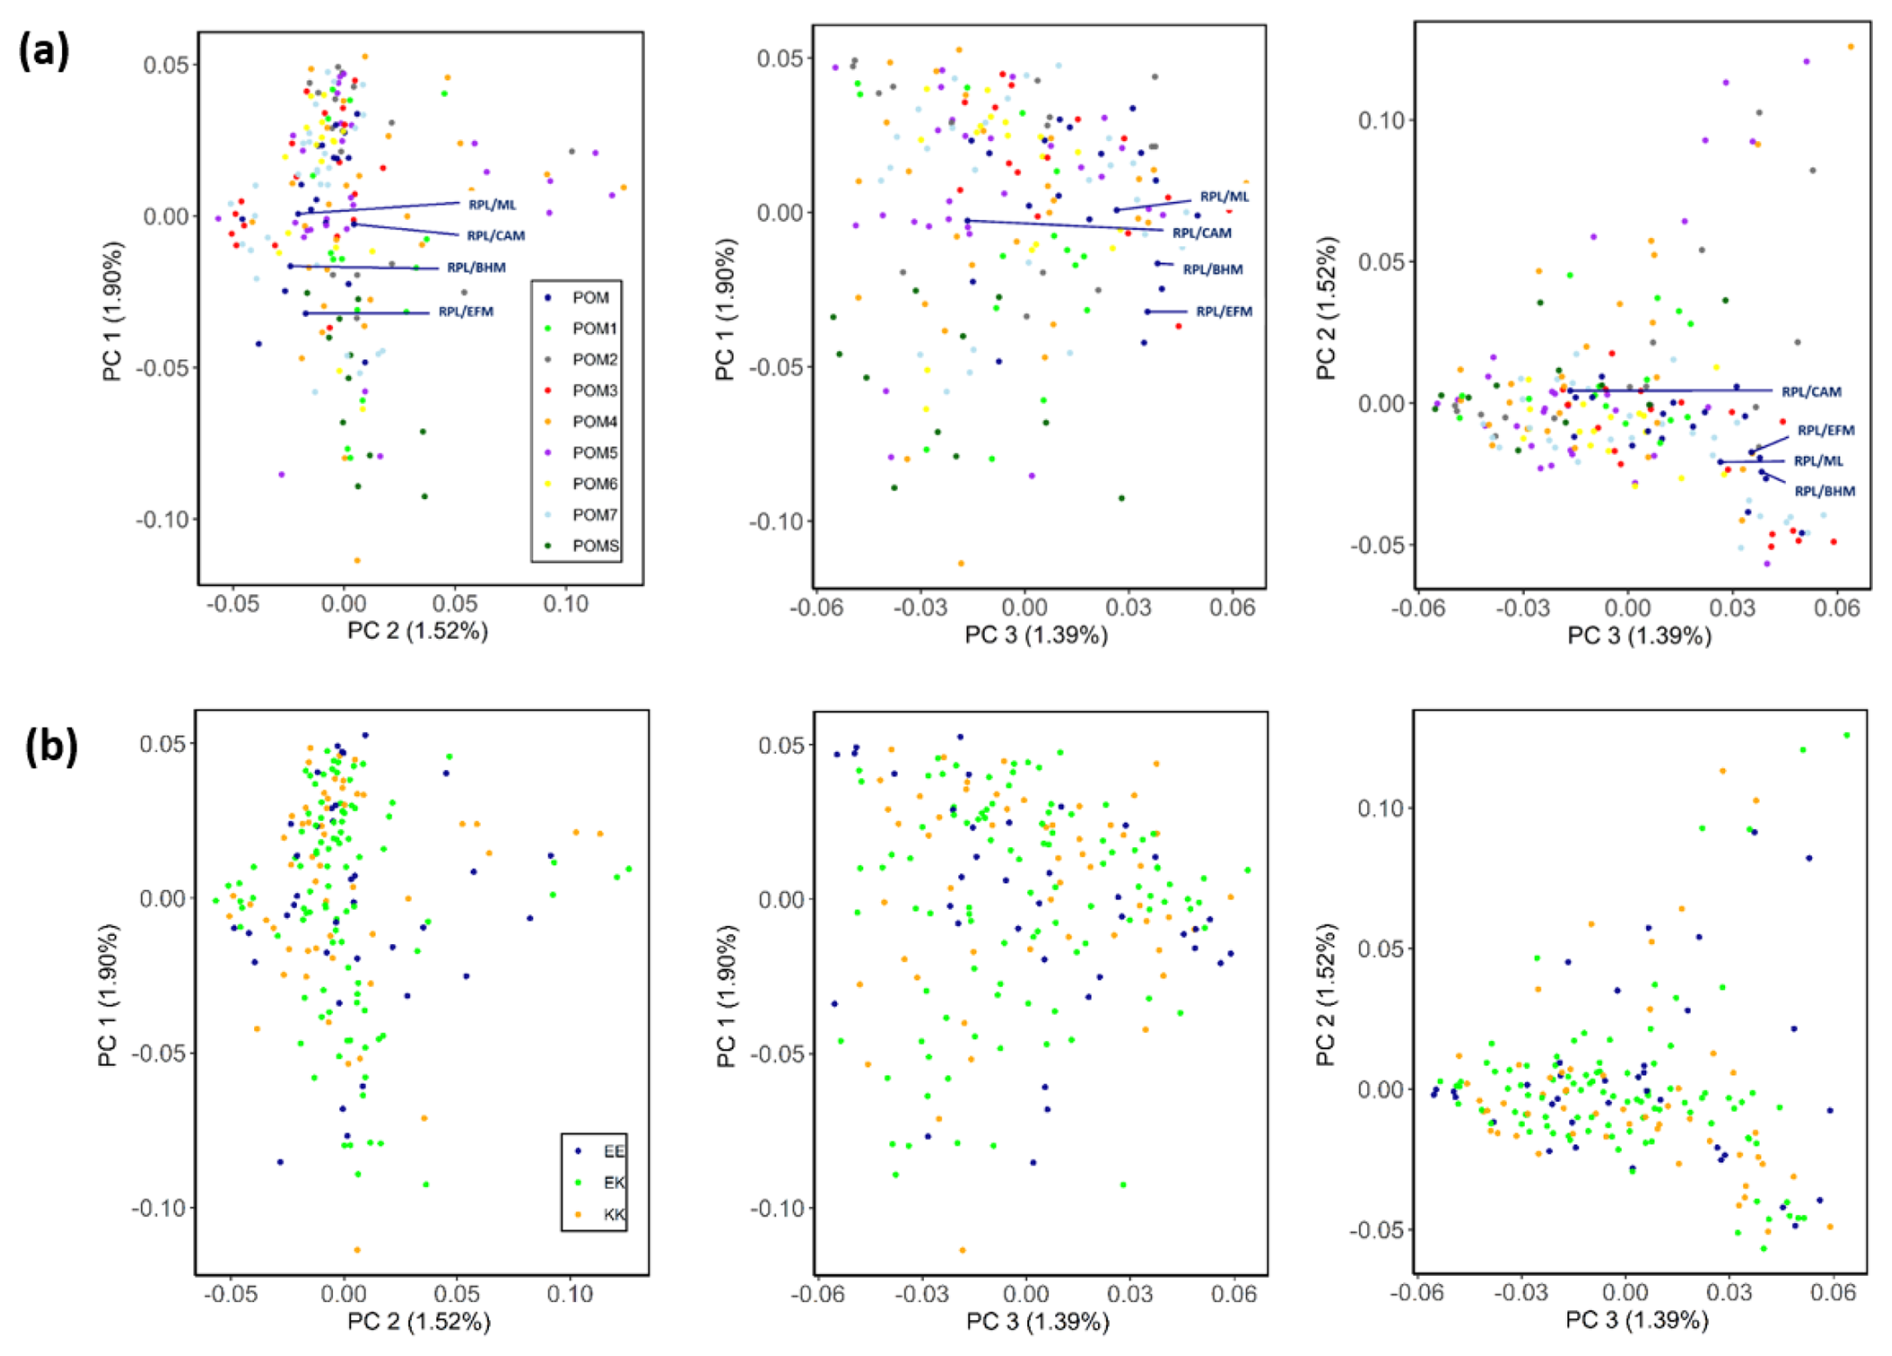
Figure 2PCA plots for the first (PC1), second (PC2), and third (PC3) component of the RPL breed, categorized by ram lines (a) and TMEM154 genotypes (b). Abbreviations used in the figure are as follows: POM – RPL with unknown ram line; POM1–7/S – ram line 1–7/S; RPL/ML, RPL/CAM, RPL/BHM, and RPL/EFM – crossbreeds between RPL and Merino Land (ML), Cameroon (CAM), Blackheaded Mutton (BHM), and East Friesian Milk (EFM) sheep, respectively; EE, EK, and KK – TMEM154 genotype EE, EK, and KK at position 35, respectively.
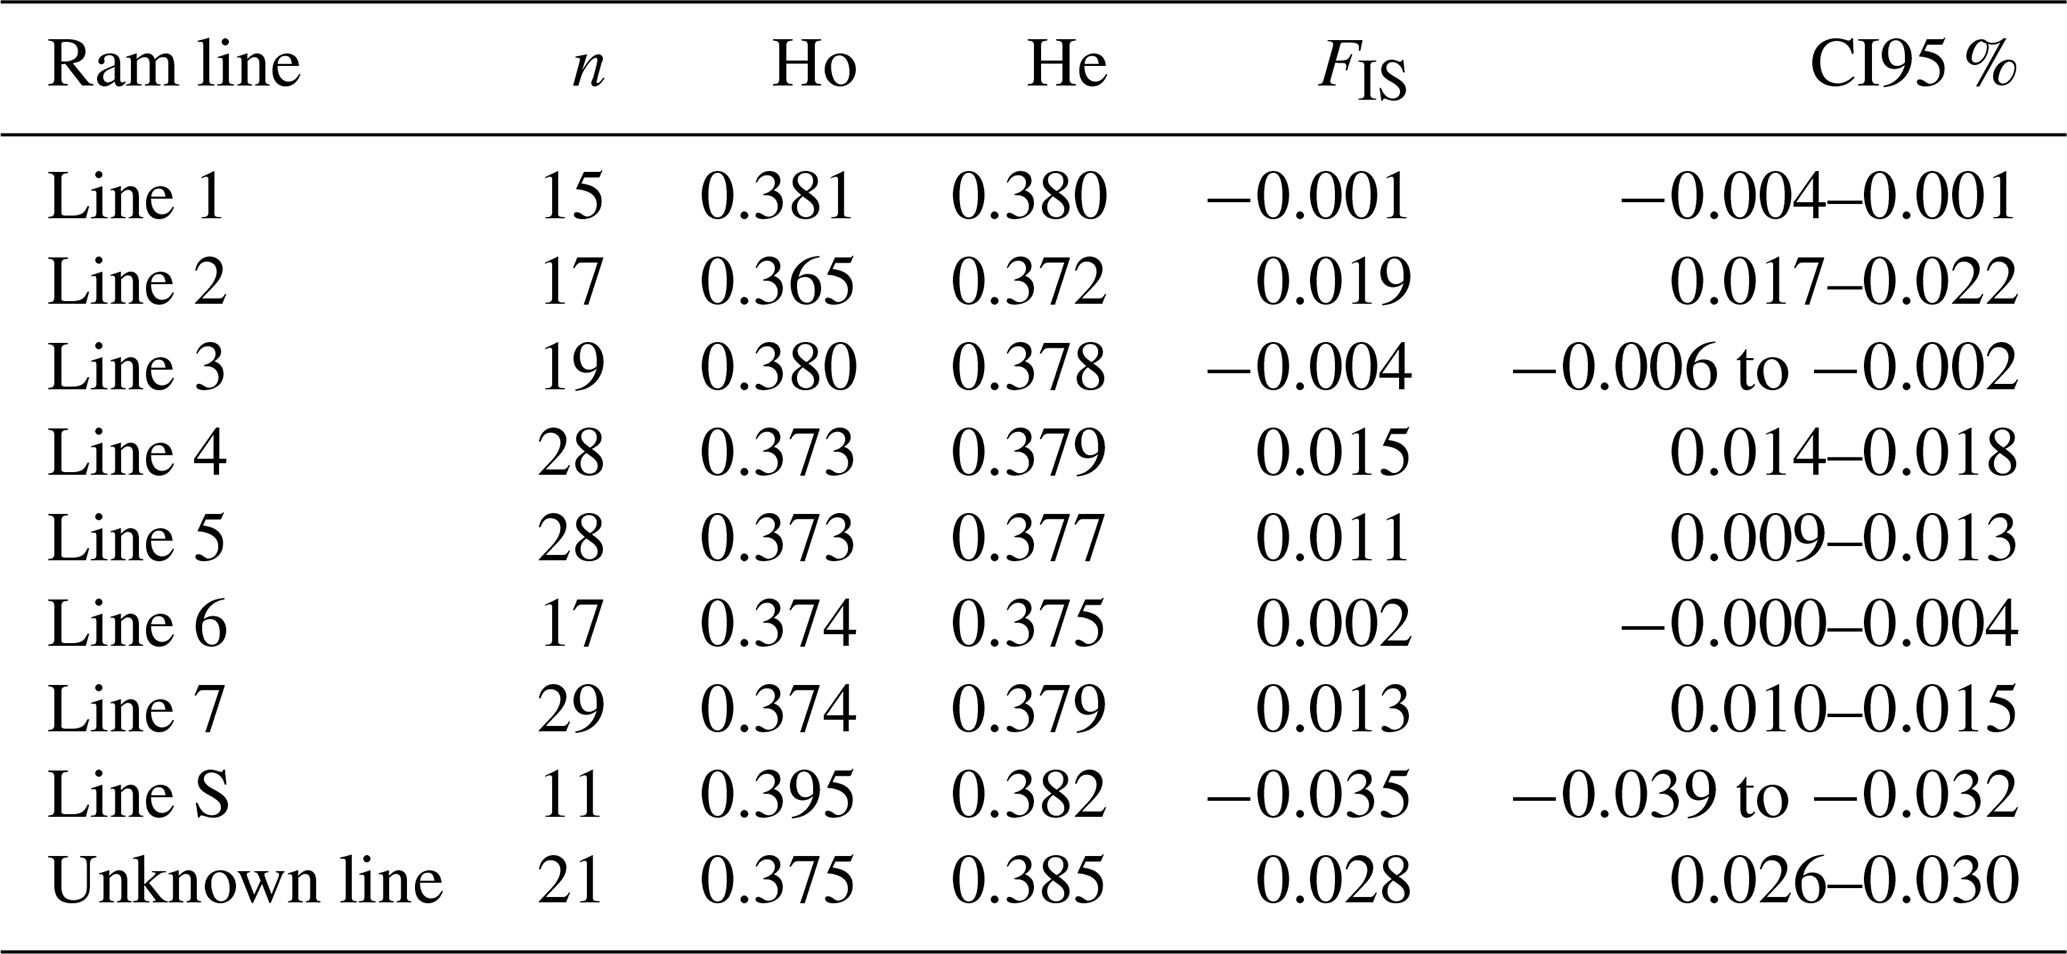
Results of genetic diversity indices for the RPL breed, categorized by ram lines and TMEM154 genotypes, are given in Tables 2 and 3. The diversity parameters were calculated for groups of sheep with the different TMEM154 genotypes to determine whether subpopulations of the RPL breed with more favorable or less favorable diversity values would be favored when selecting for MVV resistance. The mean Ho, He, and FIS values of the entire RPL breed were 0.377, 0.379, and 0.005, respectively (Table 2). Genetic diversity was very similar between the TMEM154 genotypes, with Ho ranging from 0.374 (EK) to 0.378 (EE) (Table 2). In the ram lines, Ho ranged from 0.365 (line 2) to 0.395 (line S), while He ranged from 0.372 (line 2) to 0.385 (unknown line) (Table 3). The FIS values were all close to zero, with three ram lines showing slightly negative results (lines 1, 3, and S).
Table 2Genetic diversity (Ho, He, and FIS) and effective population size (Ne5, Ne13, and Ne50) calculated for the total breed and different TMEM154 genotypes.
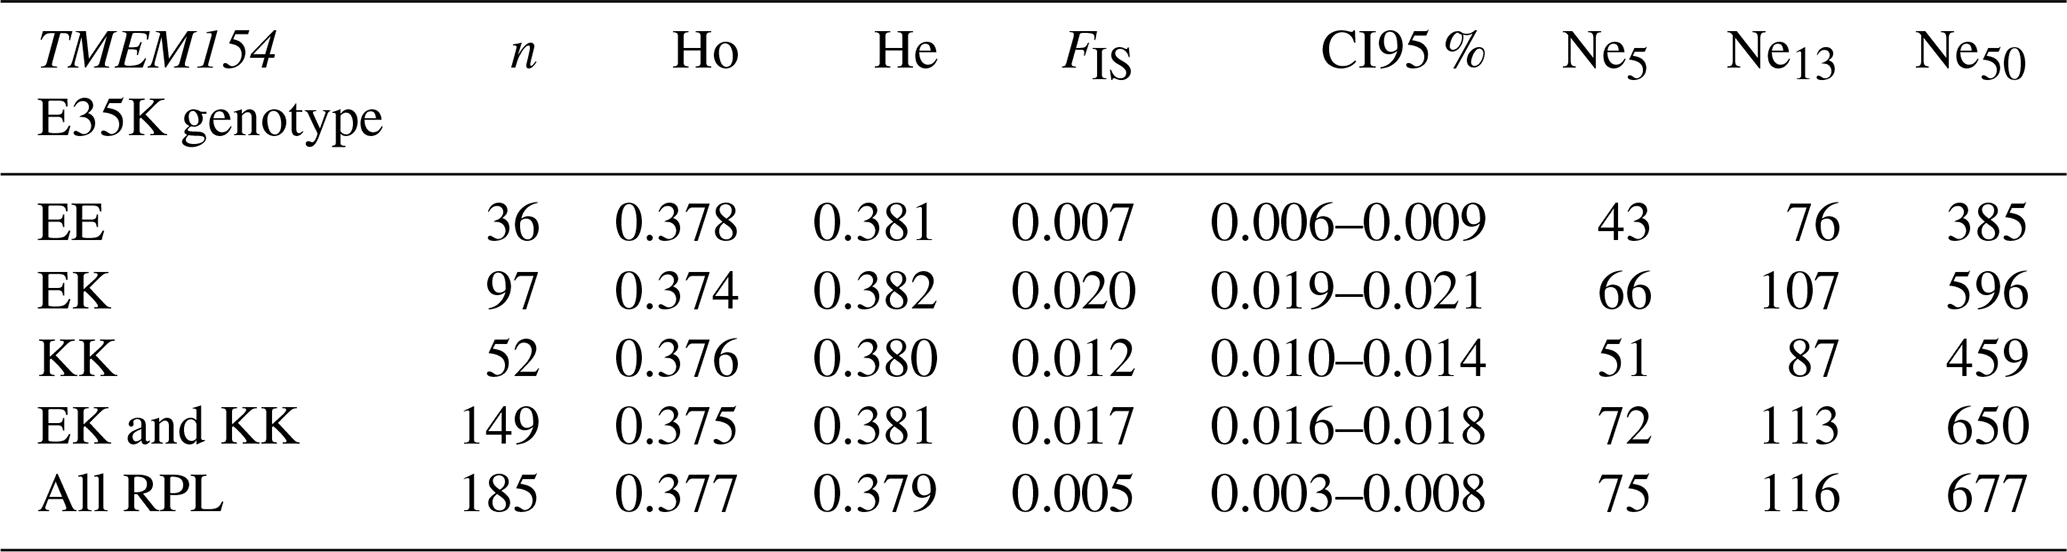
Table 3Genetic diversity (Ho, He, and FIS) calculated for the different ram lines.
Effective population size (Ne) was estimated using the QC dataset for the entire breed and for groups of the different TMEM154 genotypes for 5, 13, and 50 generations ago (Table 2). The Ne for all samples and the combined genotypes KK and EK were the highest, with Ne5 values of 75 and 72, respectively. The Pearson correlation coefficient (rp) between these two Ne5 values was almost 1 (rp= 0.99, p < 0.0001). The homozygous genotypes EE and KK had lower Ne values, which can be explained by their limited sample size.
Ne based on the numbers of male and female RPL animals showed substantial differences compared to the genomic Ne (rp= 0.03, p= 0.93). This is illustrated in Fig. 3, which shows these differences and the development of Ne over the past 800 generations. All genomic Ne values show a declining trend, while Ne values based on population numbers have mostly increased in recent generations, with Ne5 and Ne13 reaching 852 and 896, respectively. For the year 2023, Ne was estimated to be 1013.
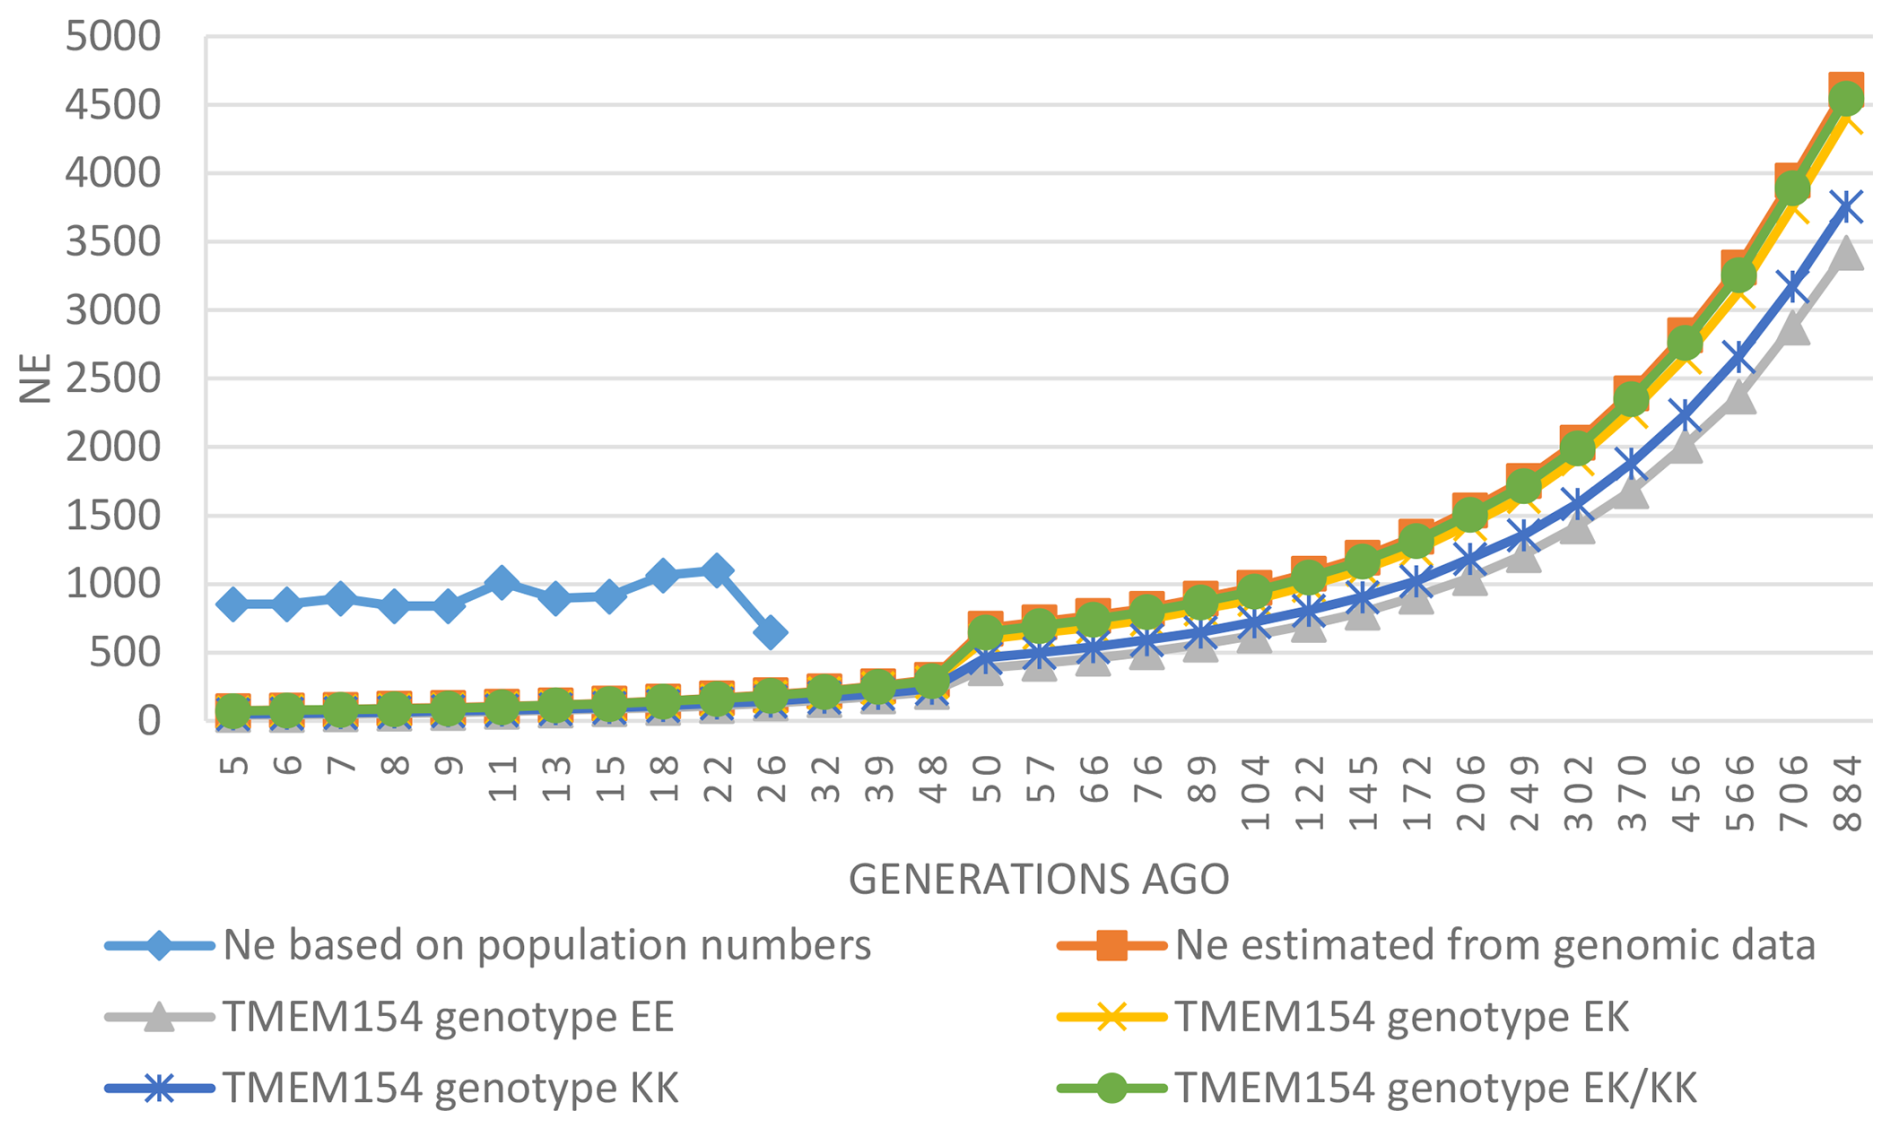
Figure 3Ne based on population numbers across 26 generations and estimated genomic Ne across 884 generations for the total breed and the different TMEM154 genotypes.
3.3 Runs of homozygosity
A total of 6690 ROH segments with varying lengths ranging between 1.06 and 38.24 Mb were identified for TMEM154 genotypes. With one exception, all animals had at least 4 and a maximum of 116 ROH segments (Appendix A). On average, this resulted in 16 ROH segments per individual within the entire RPL breed.
When comparing the different RPL ram lines, animals with unknown line assignment had the highest number of ROH segments, while line 4 had the longest ROH (Appendix B). The majority of ROH segments were in the shortest length class (1–5 Mb), with frequencies between 74.15 % (unknown line) and 78.18 % (line S), followed by the intermediate class (> 5–10 Mb), ranging from 17.46 % (line S) to 20.17 % (line 1). Only 4.37 % (line S) to 7.45 % (unknown line) of the ROH segments were longer than 10 Mb (Fig. 4). The distributions of the frequencies of ROH segments in different length classes (1–5, > 5–10, and > 10 Mb) and the ram lines are shown in Fig. 4.
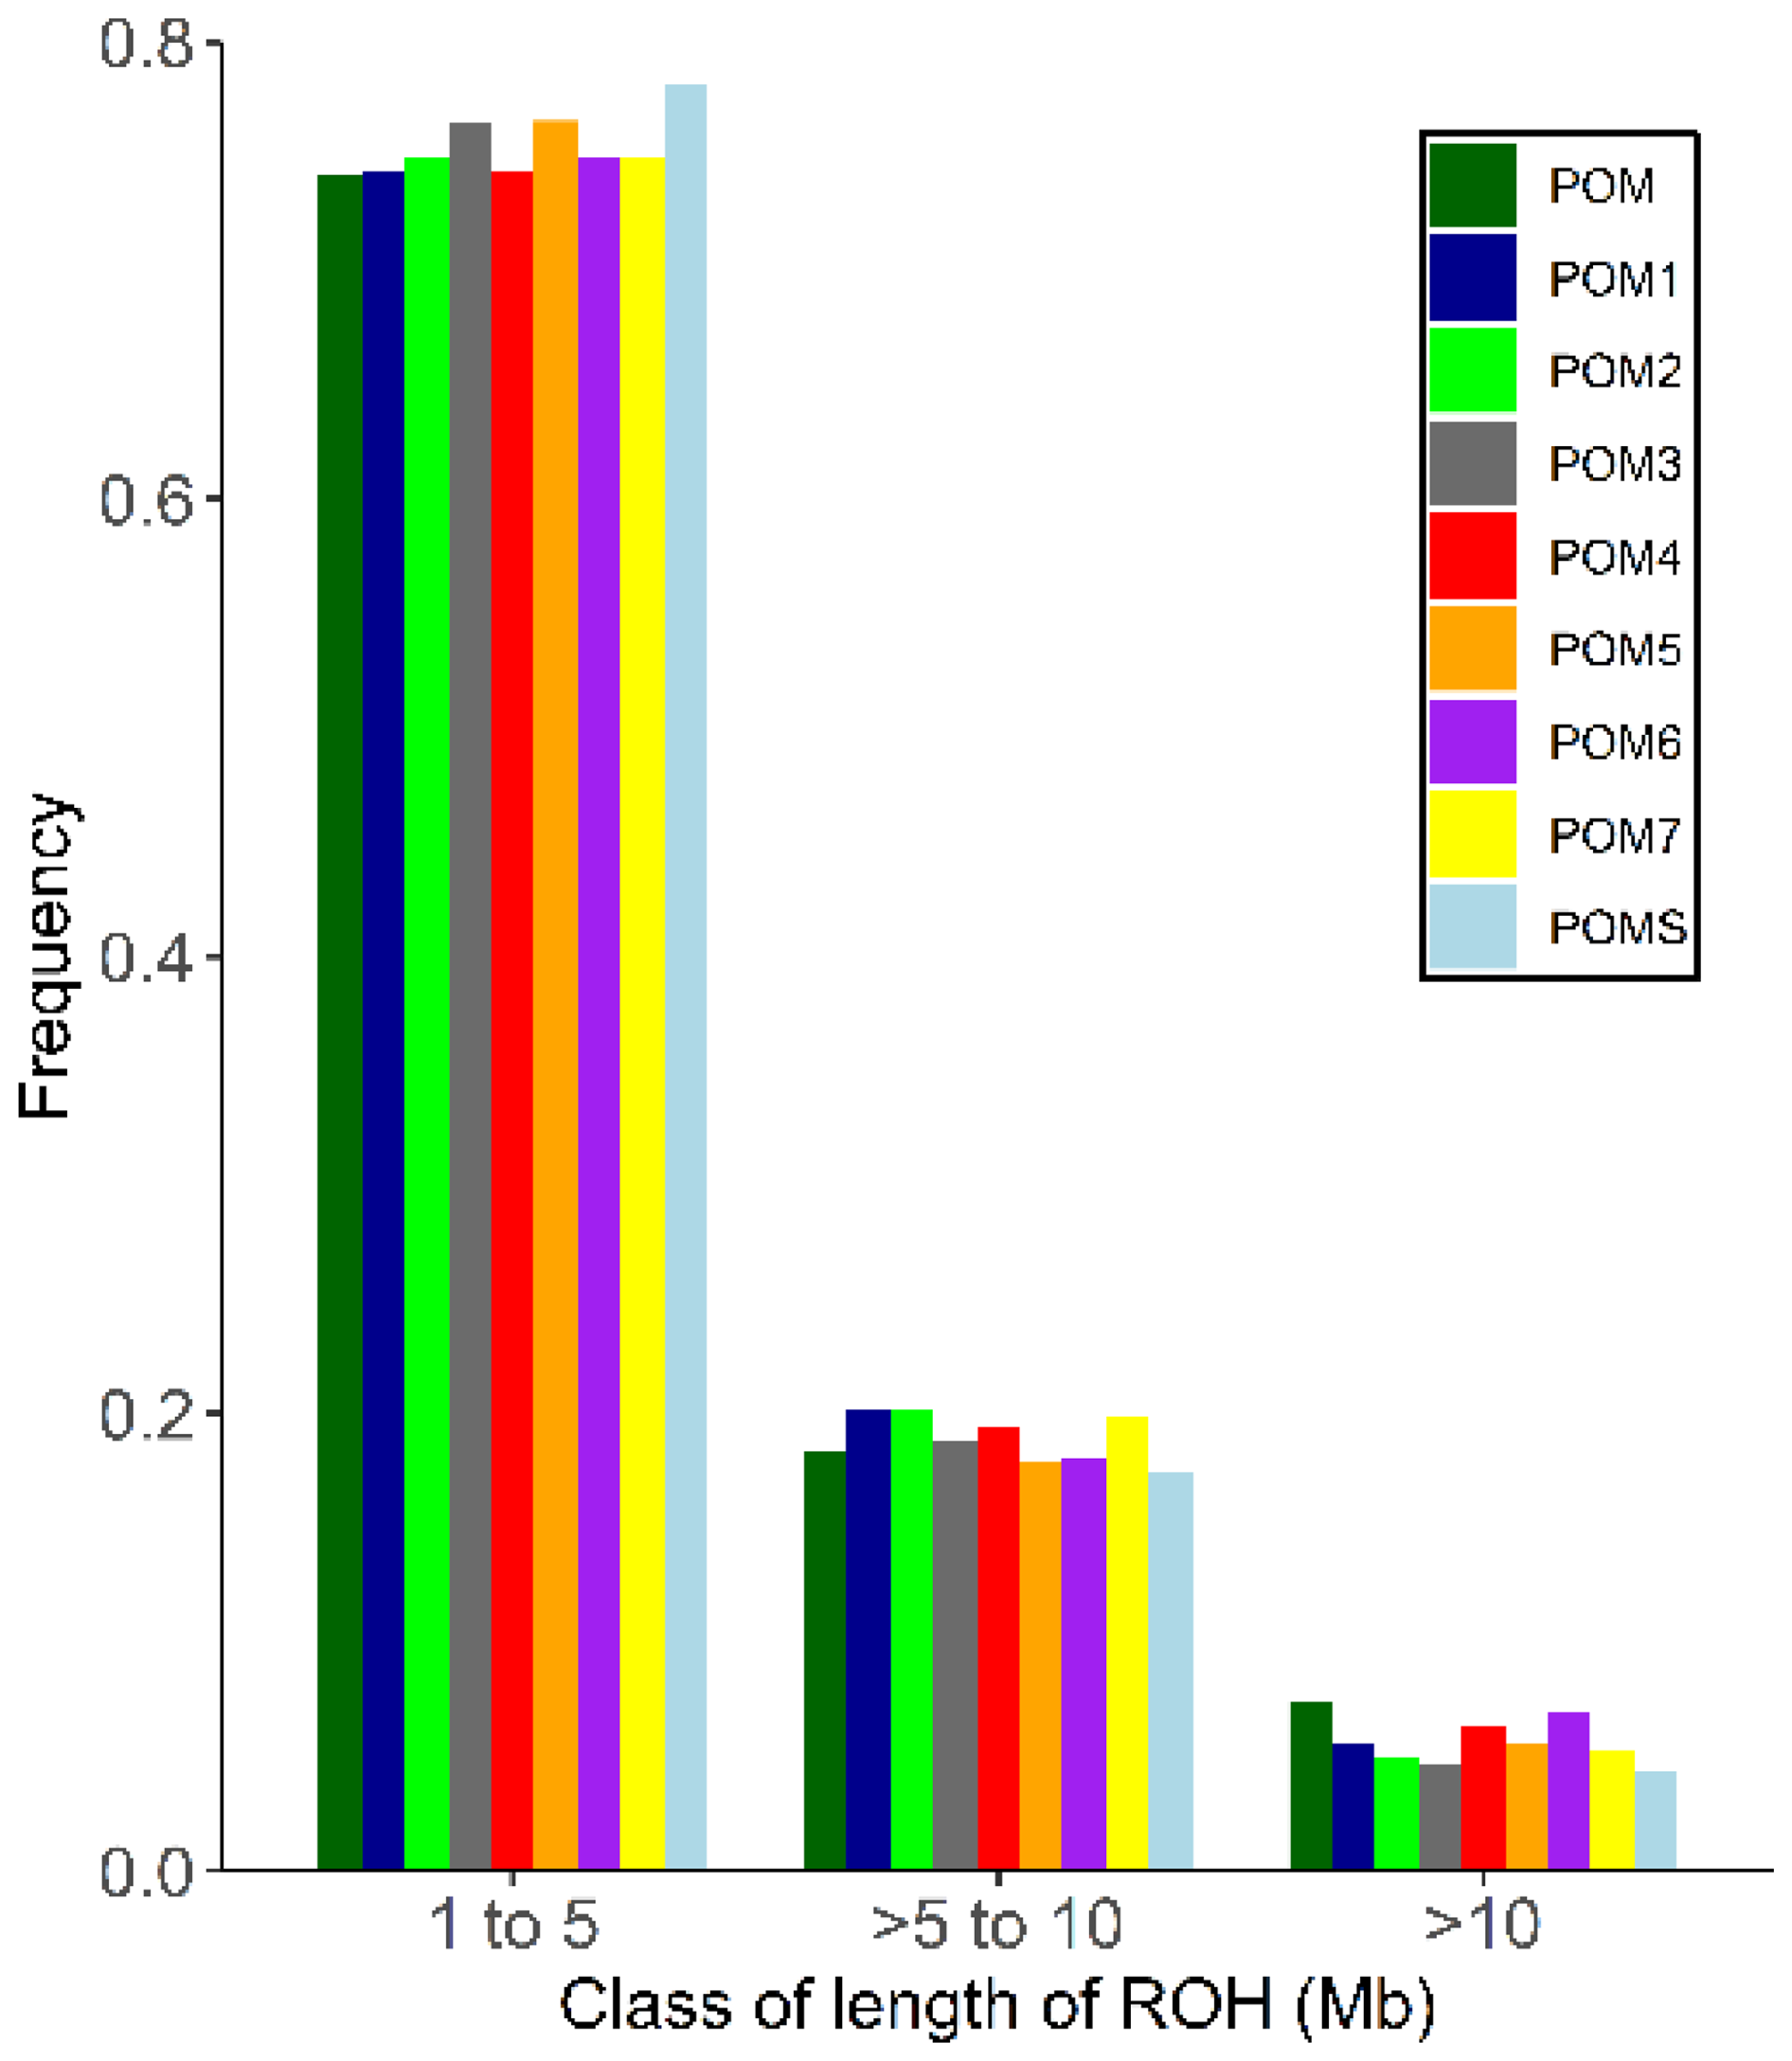
Figure 4Frequency distribution of the number of ROH in different length classes and for the RPL breed, categorized by ram lines. Abbreviations used in the figure are as follows: POM – RPL with unknown ram line; POM1–7/S – ram line 1–7/S.
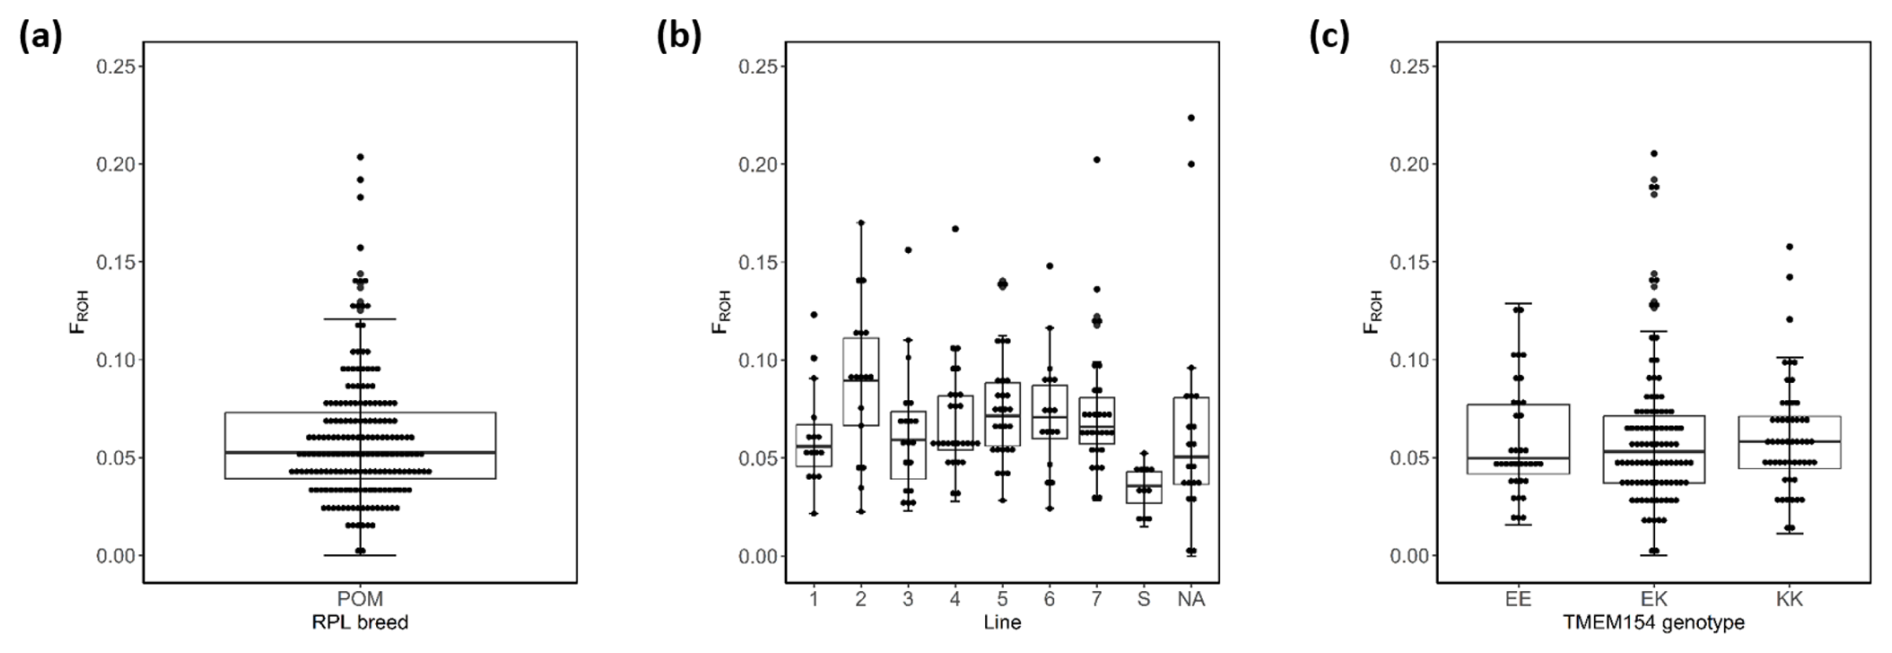
Figure 5Box plots of within-breed FROH for the entire RPL breed (a), the ram lines (b), and TMEM154 genotypes (c). Abbreviations used in the figure are as follows: POM – all 185 RPL; 1–7 – ram line 1–7; NA – line data not available; EE, EK, and KK – TMEM154 genotype EE, EK, and KK at position 35, respectively.
Based on ROH analysis, genomic inbreeding (FROH) was estimated for the entire breed, for TMEM154 genotypes (Appendix A), and separately for the different ram lines (Appendix B). In the RPL breed, FROH values ranged from 0 to 0.277, with a mean of 0.062. The within-breed distribution of FROH is visualized in Fig. 5, where the bottom of the box represents the third quartile (Q3), followed by the median and the first quartile (Q1).
The highest mean FROH was found in genotype EK (0.065), while genotype EE had the lowest (0.058) (Appendix A). Otherwise, the highest median was presented in genotype KK (Fig. 5c). The Kruskal–Wallis test indicated no significant differences between the mean FROH of the TMEM154 genotypes (p= 0.836).
A significant difference was observed between the FROH of the eight ram lines (p= 0.0002) (Appendix C). Only the FROH comparisons between line S and six other lines, with the exception of line 3, were significant. The highest median and mean value were observed in line 2, whereas the lowest values were observed in line S (Appendix B, Fig. 5b).
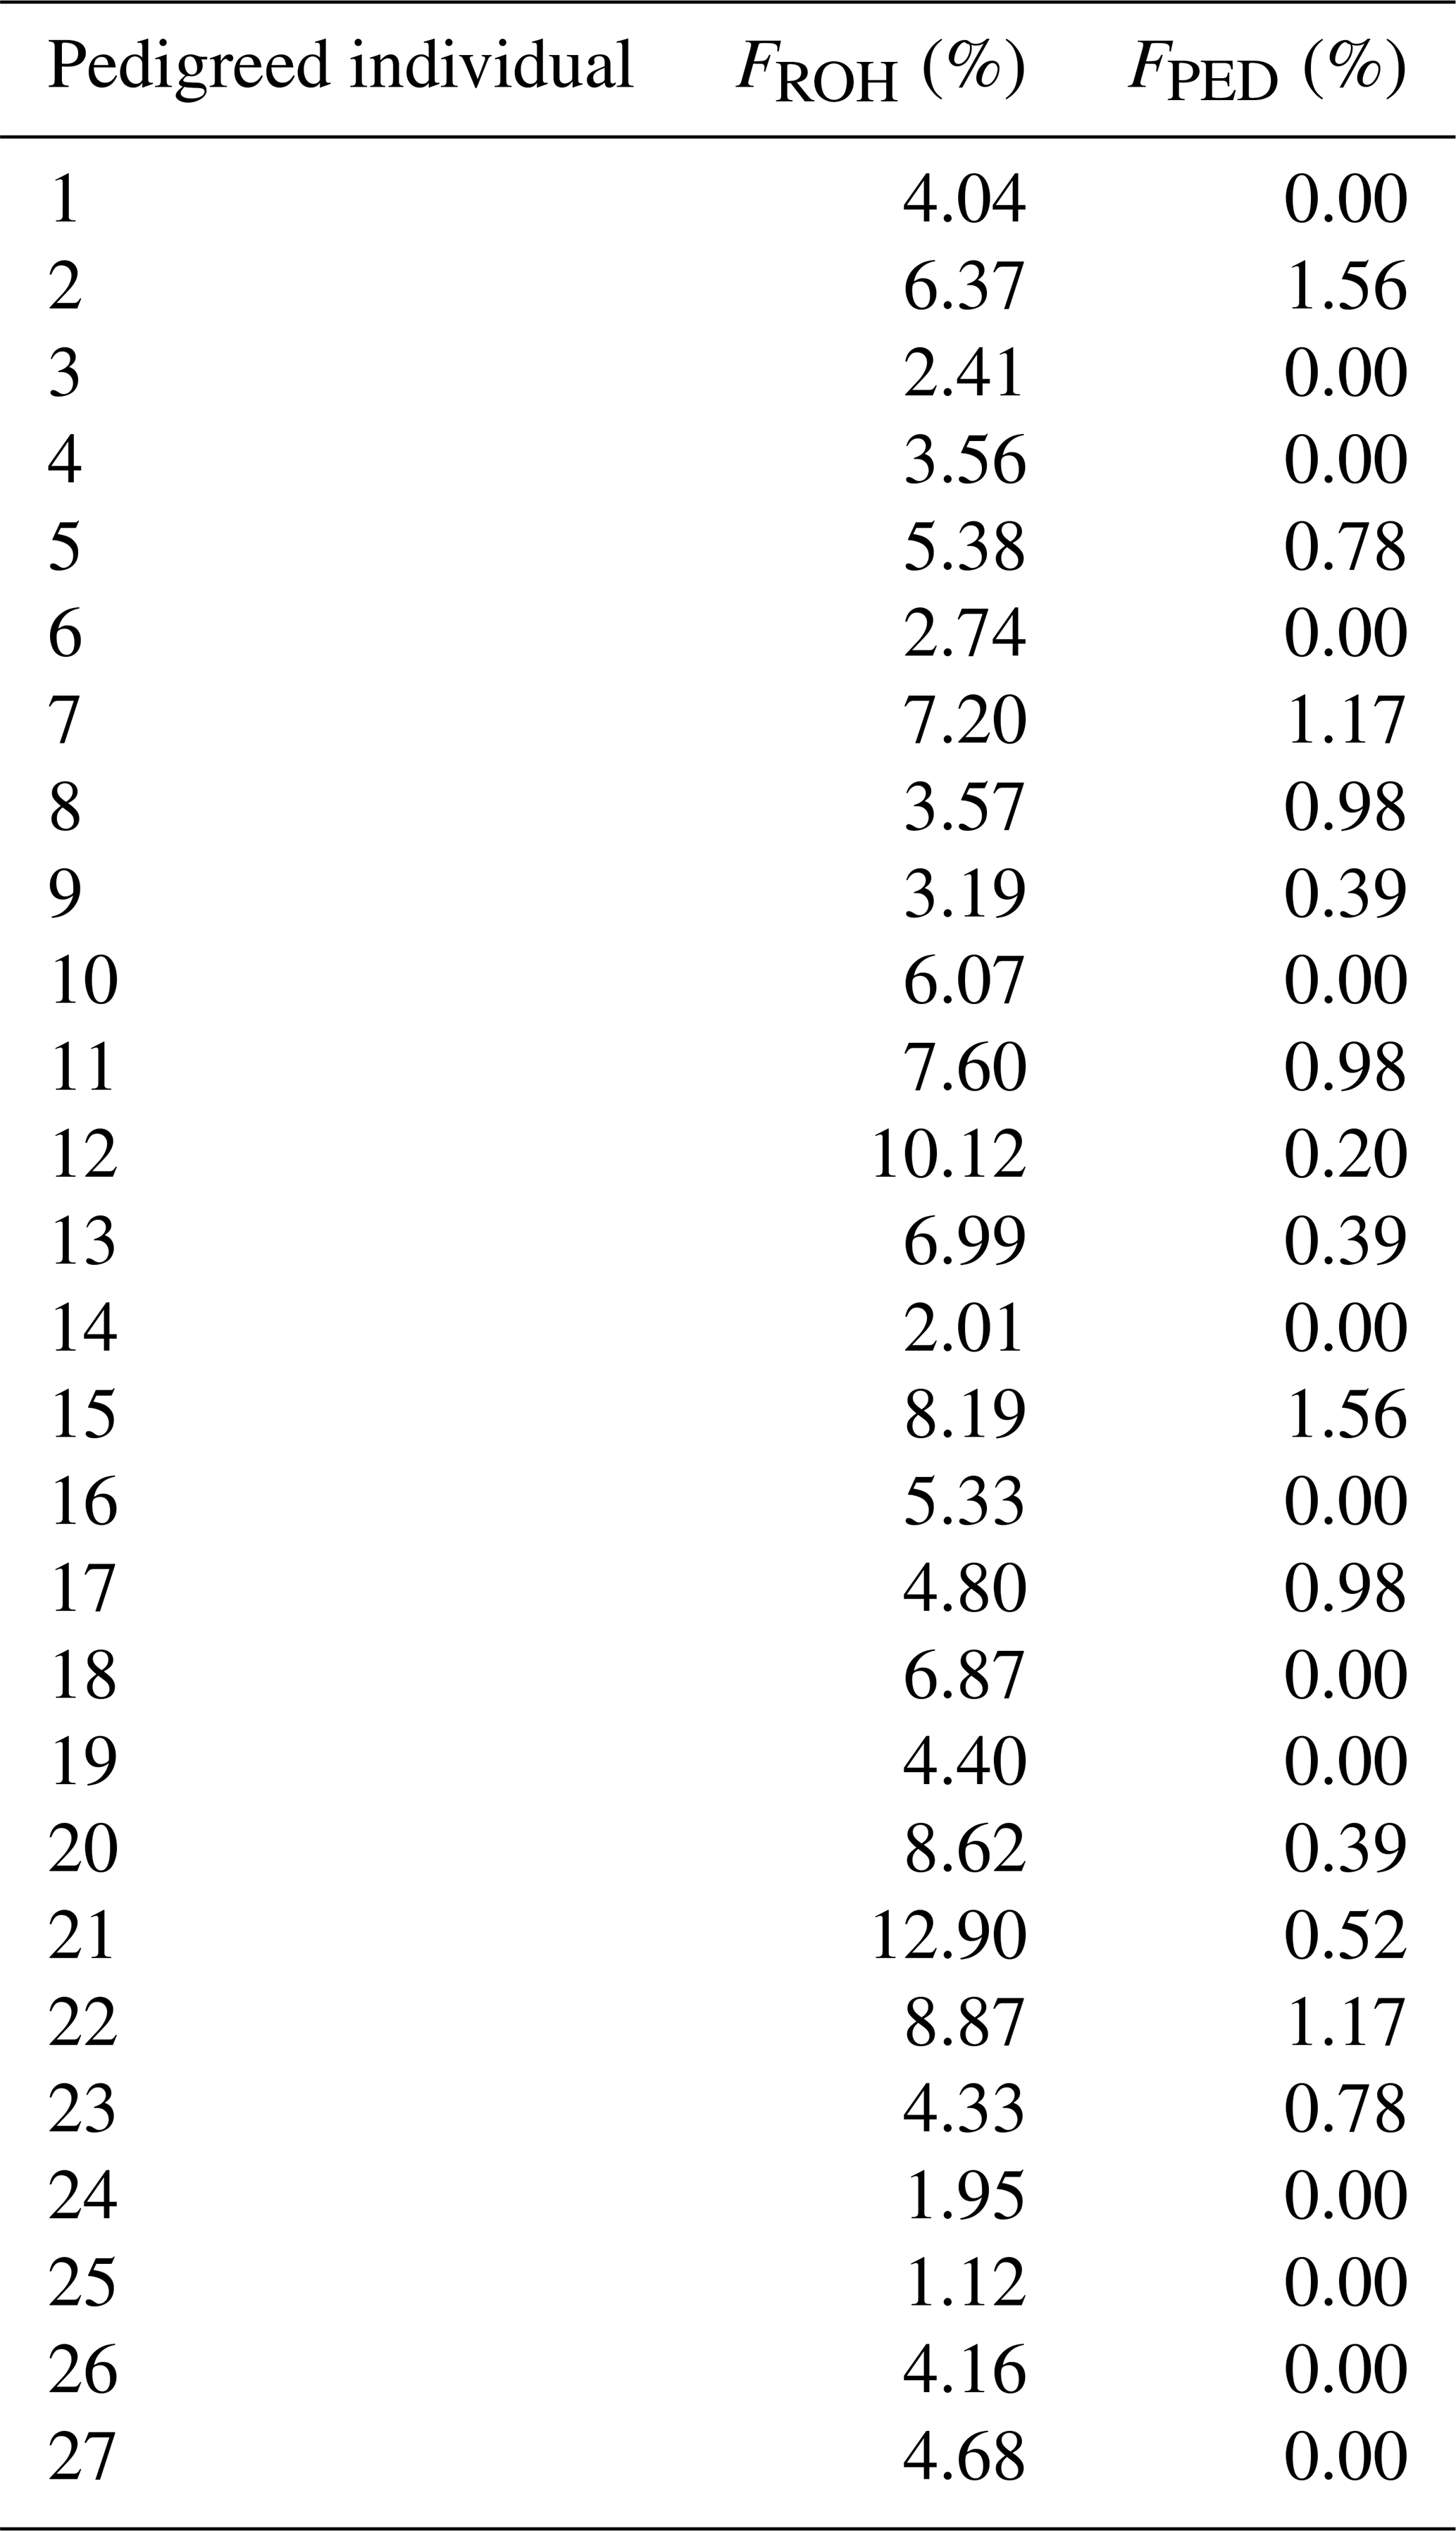
In 27 individuals for which a pedigree-based inbreeding coefficient (FPED) could be calculated, the FROH and FPED values were compared (Appendix D). The FROH values of these animals ranged between 1.12 % and 12.90 % (average of 5.46 %), whereas the FPED values were consistently lower, ranging from 0 % to 1.56 % (average of 0.44 %). A value of 0 % indicates no inbreeding, either genomic (FROH) or pedigree-based (FPED). The Pearson correlation coefficient (rp) between FROH and FPED was positive and moderately significant, with a result of 0.42 (p= 0.02).
4.1 Genetic diversity in the RPL breed
This study presents the first comprehensive analysis of genetic diversity in the German RPL sheep breed. Faced with the danger of extinction, efforts to conserve the breed began almost 40 years ago with seven rams from the eastern federal state Mecklenburg–Western Pomerania and one ram from southwestern Germany (IGRPL, 2024). Today, these eight founding ram lines are distributed across the whole country (VDL, 2023). The PCA plot (Fig. 2a) indicates an equal genetic distribution with no distinct clustering among the ram lines. A genetic separation of individuals from different geographical regions in PCA plots, as reported in previous studies of different breeds (Eydivandi et al., 2021; Kijas et al., 2009; Kijas et al., 2012), could not be observed in the present study. Line S, originating from southern Germany, showed no distinct separation from the seven northern lines, despite its different geographical origin. This outcome speaks for a successful implementation of the line-rotation method by the RPL breeders. Normally, the genetic distance among animals from the same breed is smaller than the distance between animals of divergent breeds (Lenstra et al., 2012). However, the four crossbred RPL sheep (resulting from crosses with Cameroon, Blackheaded Mutton, Merino Land, and East Friesian Milk sheep) exhibited no clearly visible genetic distance from the purebred individuals in the PCA plot. For identification of crossbred animals with this method, it may be necessary to include SNP data from sheep of the other breeds. In fact, the genetic proportion of the crossed-in breed also depends on how many generations ago the cross was made. Unfortunately, we do not have this information for the crossbred animals included in this study.
Numbers of breeding males and females have traditionally been used to estimate Ne in livestock (Birky et al., 1983). However, these estimates have limitations, such as assumptions of perfect random mating, including self-fertilization, or an equal number of offspring per parent. Ne based on genomic data serves as a more accurate indicator of the genetic variation within a population and is usually much smaller than Ne based on population numbers (Lenstra et al., 2012). When using the SNeP software for Ne analysis, the authors caution that Ne values based on genome data are unreliable when calculated for less than 10 generations (Corbin et al., 2012). Therefore, genome-based Ne values lower than 10 generations ago found in this study are not comparable to results from population numbers.
The present study supports the latter finding, e.g., with Ne13 values of 116 (genomic) and 896 (population numbers) for all analyzed samples. Both values are over the threshold recommended guideline value of at least 50 from the Food and Agriculture Organization of the United Nations (Bradley et al., 1998), indicating that the RPL breed is not currently at risk of extinction or inbreeding depression. The genomic Ne of the RPL breed is higher than those reported for many other sheep breeds (Adeniyi et al., 2022; Meyermans et al., 2020a; Purfield et al., 2017). Comparable or even higher values have been reported in some Swiss sheep breeds (Signer-Hasler et al., 2019). Overall, the genomic Ne of the RPL breed shows a decreasing trend over the last 800 generations (Fig. 3). This decline aligns with population subdivision and selection (Kijas et al., 2012), and such a decline is to be expected for breeding in a closed population.
The still acceptable effective population size of the RPL breed is consistent with the results for other parameters of genetic diversity. A higher level of heterozygosity indicates greater genetic variability, while a lower level suggests both lower genetic variability and a lower Ne (Lenstra et al., 2012). The mean observed heterozygosity (Ho) of the RPL breed is higher than that of 10 northern European sheep breeds (Meyermans et al., 2020a) and nearly matches the Ho value of 0.38 in Australian Merino sheep, which have been described as the most diverse sheep population among a selection of Australian breeds (Al-Mamun et al., 2015). Other European sheep breeds exhibited both lower and higher values (of up to 0.41) (Adeniyi et al., 2022; Signer-Hasler et al., 2019; Sveistiene and Tapio, 2021). Within RPL sheep, the S-line had the highest heterozygosity (0.40), comparable to that of the German Texel breed (Sveistiene and Tapio, 2021). A German diversity study from 1999 using microsatellites estimated a heterozygosity of 0.77 for the RPL breed (Falge et al., 1999). The phenomenon that microsatellite data lead to higher estimates of heterozygosity than SNP chip genotypes has already been described (Handley et al., 2007). Microsatellite analyses show higher heterozygosity because most of these markers represent highly polymorphic sites with more than two alleles, in contrast to SNPs that usually represent sites with two alleles. However, SNP chip genotypes are more accurate than microsatellites due to the higher number of markers and their more even distribution across the genome. Therefore, they are able to detect even weak relationships, and they result in smaller confidence intervals (Laoun et al., 2020). The inbreeding coefficient FIS showed both positive and negative results across the different ram lines, although all were close to 0. Other German breeds, such as Blackheaded Mutton, East Friesian Brown, or Texel sheep, showed negative results ranging from −0.02 to −0.03 based on SNP chip data (Sveistiene and Tapio, 2021). The mean FIS value for the RPL breed was slightly positive, which indicates a slight tendency towards inbreeding.
The majority of the ROH segments across all ram lines belonged to the shortest length class (Fig. 4), which indicates older inbreeding events, such as bottlenecks during breed formation due to the small initial population (Curik et al., 2014; Peripolli et al., 2017). Only a small proportion of long ROH segments were detected, suggesting low recent inbreeding (Curik et al., 2014). This recent inbreeding could be attributed to selective breeding and non-random mating, as usually only a small number of rams are used. The genomic inbreeding coefficient FROH aligns with the FIS values, with the highest FROH average found in line 2 (0.090) and the lowest in line S (0.035) (Appendix A). The overall breed value was 0.062, which is far below the average of 0.134 for European breeds (Eydivandi et al., 2021) and other endangered sheep breeds (Adeniyi et al., 2022; Meyermans et al., 2020a).
When comparing the genomic inbreeding coefficient (FROH) with the pedigree-based inbreeding coefficient (FPED), the FROH values were consistently higher than the FPED values, with a correlation of only 0.42. Moderate to weak correlations were also detected in the Vendéen breed (value of 0.15) (Purfield et al., 2017) and some Swiss sheep and goat breeds (Burren et al., 2016; Signer-Hasler et al., 2019). In contrast, other studies on sheep, pigs, and cattle have reported higher correlations (Gorssen et al., 2020; Meyermans et al., 2020a; Signer-Hasler et al., 2017), while dogs showed the highest at 0.78 (Wiener et al., 2017). The discrepancy could be explained by a higher degree of incompleteness and lower depth of pedigrees of small ruminants (Purfield et al., 2017). In comparison, pets generally have a better-documented pedigree due to easier control of mating and birth. Regarding birth, sheep and goats often lamb in groups and at night. An overlooked adoption of foreign lambs by ewes can lead to errors in the pedigree. Control of mating is also an advantage of artificial insemination, which (at least in Europe) is more common in cattle and pigs than in sheep and goats. Moreover, FPED is based on theoretical inbreeding and does not consider the stochastic effect of Mendelian sampling (Curik et al., 2014). Another possible explanation for lower correlations is the assumption that the founder population is unrelated, which is unlikely. Due to these limitations, FPED often underestimates inbreeding. Consequently, FROH is more accurate because it is independent of ancestry information and reflects both past and recent relatedness (Curik et al., 2014; Peripolli et al., 2017).
4.2 Breeding for maedi-visna resistance
Based on the diversity parameters calculated in the present study, the genetic diversity of the RPL breed is not at risk. Due to the high frequency of the TMEM154 allele K in this study (54 %) and a previous study (53 %) (Frölich et al., 2024), breeding for MVV resistance could be possible. The PCA results showed no genetic separation between sheep with the three different TMEM154 genotypes. This implies that no genetically distinct subgroup will be excluded from breeding when selecting for the K allele. However, a strong preference in breeding for the putative protective allele K might jeopardize the genetic variability in this breed and increase inbreeding rates by reducing the effective population size (Peripolli et al., 2017; Williams, 2005). The estimated Ne for the subpopulation of sheep with the TMEM154 genotype KK was slightly lower than that of the entire breed, whereas the Ne for sheep with genotypes KK and EK was similar (Fig. 3). Implementing mating strategies that include both genotypes (KK and EK) would not substantially reduce Ne and, consequently, help maintain allelic variation (Peripolli et al., 2017). Moreover, the observed heterozygosity (Ho) remained the same, whereas the expected heterozygosity (He) was higher for TMEM154 genotypes KK and EK (Table 2), resulting in a slightly higher but still near-zero FIS value. On the other hand, the mean FROH value of 0.063 for both genotypes was comparable to that of the whole breed. Although the TMEM154 genotype EE exhibited the lowest FIS and FROH results, a selection against this genotype is not problematic due to its reactively low frequency in the RPL population (20 %). To reduce genotyping costs, sire-only genotyping and selection should be considered. While this approach would slow the selection for the K allele, it would avoid high costs and limit the reduction in the population size (White and Knowles, 2013).
However, the effectiveness of selection for the TMEM154 allele K with respect to reducing MVV susceptibility in the RPL breed needs further validation through studies involving a larger number of MVV-positive sheep, as the effect showed only a trend towards significance (Frölich et al., 2024). Nonetheless, it has the potential to complement MVV eradication measures in infected flocks, such as regular serological monitoring of the flock and culling of seropositive sheep and/or motherless rearing of lambs (Reina et al., 2009). In the light of the high frequency of the K allele in the RPL breed, a prioritization of breeding rams with the genotypes KK or EK in MVV-infected flock is a relatively simple way to increase the chances of reducing the infection pressure within the flock.
This study describes, for the first time, the genomic diversity of the German RPL sheep breed. The estimated genetic diversity parameters suggest that its diversity is not at risk, indicating successful breeding practices in recent years. Nevertheless, it is important to maintain genetic diversity and further reduce the level of inbreeding in the future. For this purpose, the genomic inbreeding coefficient should be used, as the pedigree-based method consistently underestimated the inbreeding level. However, to enable this, it would be necessary to establish genome analysis as a routine procedure in German sheep breeding.
Furthermore, the present study showed that breeding for MVV resistance would be possible without a major loss of genetic diversity. However, selecting the entire breed for the TMEM154 allele K is not recommended at this time, as the effect on MVV susceptibility was not statistically significant in a previous study. An exception are MVV-affected flocks, in which rams with the genotypes KK or EK could be prioritized. Further research with a larger number of MVV-positive RPL sheep is required in order to validate a protective effect of the genotype KK against MVV in the RPL breed.
Table A1Descriptive statistics for the ROH analysis and FROH of the total breed and the TMEM154 genotypes.
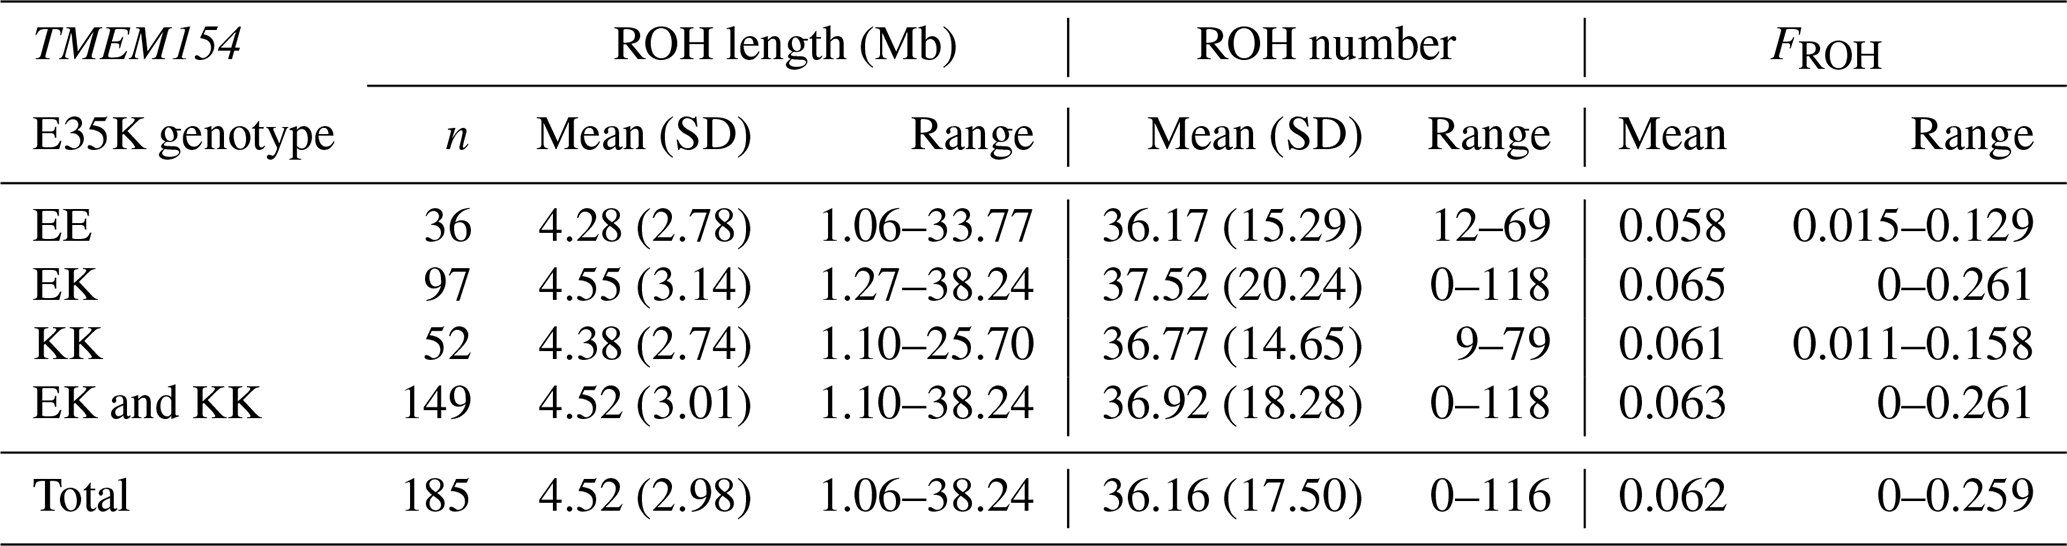
Table B1Descriptive statistics for the ROH analysis and FROH of the eight different ram lines.
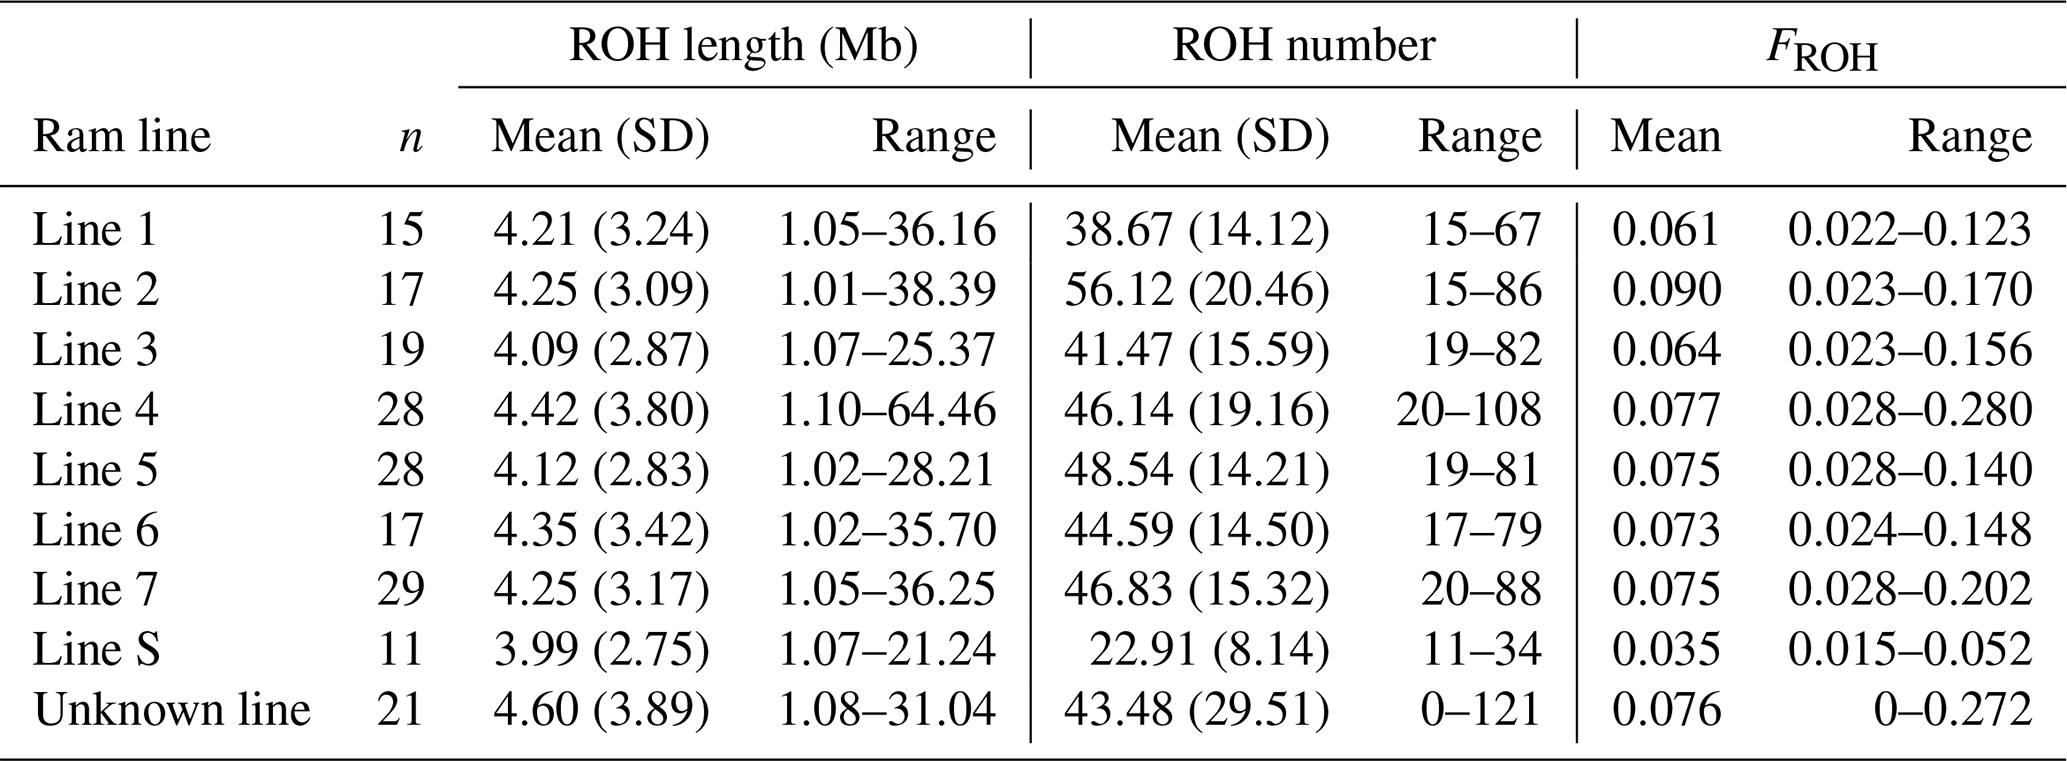
Table C1Results of the Kruskal–Wallis test comparing the eight ram lines.
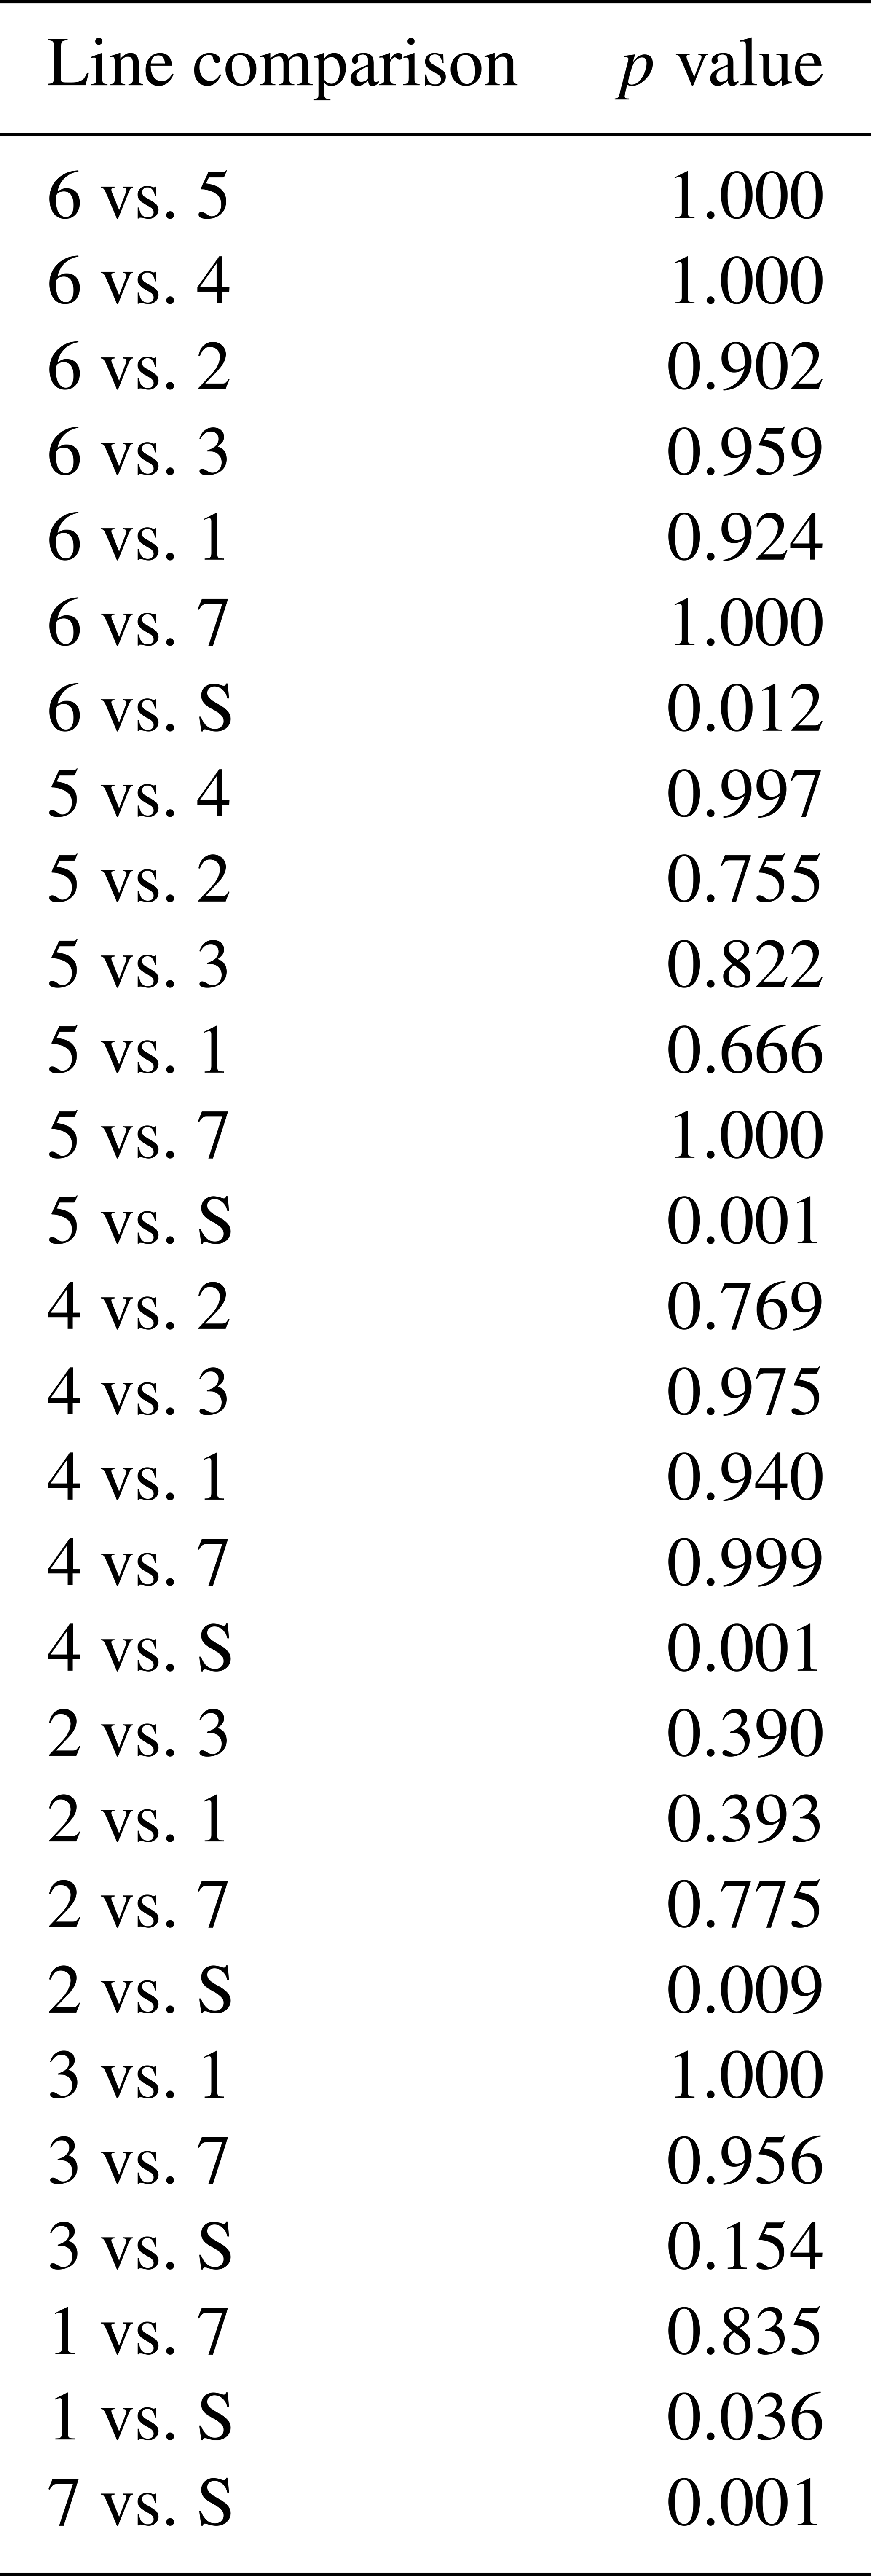
Table D1Comparison of the genomic (FROH) and pedigree-based (FPED) inbreeding coefficients for 27 pedigreed RPL individuals.
The statistical codes used in this study are available from the corresponding author upon reasonable request.
As the data originate from German sheep farms, there are privacy issues associated with their public release. Therefore, the data are only available from the authors upon reasonable request, as permission must first be obtained from the sheep farmers.
MG and GL conceptualized the project and organized the funding. MG was the supervisor of the clinical part of the project, whereas GL was the supervisor of the genetic part. CF collected the blood samples, stored and organized the data of the study, and wrote the original draft of the manuscript. CF and OA carried out the statistical analyses and created figures. MG, OA, and GL revised and improved the manuscript.
The contact author has declared that none of the authors has any competing interests.
All animal procedures were reviewed and approved by the respective state veterinary offices of the nine different German states. The approval numbers are as follows: Baden-Württemberg, 35-9185.82/A-11/23 (8 August 2023); Brandenburg, LAVG-V6-2347-19-2023- 23-E (7 August 2023); Hesse, V 54 19 c 20 15 h 01 Nr. V 3/2023 (21 August 2023); Lower Saxony, 33.19-42502-04-23-00387 (4 August 2023); Mecklenburg–Western Pomerania, 7221.3-2-012/23 (5 September 2023); North Rhine-Westphalia, 81-02.04.40.2023.VG036 (11 August 2023); Saxony, 25-5131/564/17 (9 October 2023); Saxony-Anhalt, 203.m-42502-6-011_TiHo_G (25 September 2023); Schleswig-Holstein, IX 552 – 117467/2023 (56-9/23V) (25 September 2023). The handling and sampling of the sheep followed the European Union guidelines for animal care and handling and the Guidelines of Good Veterinary Practices.
Publisher’s note: Copernicus Publications remains neutral with regard to jurisdictional claims made in the text, published maps, institutional affiliations, or any other geographical representation in this paper. While Copernicus Publications makes every effort to include appropriate place names, the final responsibility lies with the authors.
The authors would like to thank the participating sheep breeders and zoos for providing the samples and data for analysis, especially Christoph Höller (chairman of the Interessengemeinschaft Rauhwollige Pommersche Landschafe e.V.), who has supported and promoted the project since its inception. Many thanks also go to Carina Crispens and Stephanie Steitz for carrying out the TMEM154 genotyping in the laboratory of the Institute of Animal Breeding and Genetics at the Justus Liebig University of Giessen.
This work was supported by the Federal Ministry of Food and Agriculture (BMEL) based on a decision of the parliament of the Federal Republic of Germany via the Federal Office for Agriculture and Food (BLE) under the federal program for Ecological Farming (2821OE013/2822OE140).
This paper was edited by Steffen Maak and reviewed by Gudrun A. Brockmann and one anonymous referee.
Adeniyi, O. O., Simon, R., Bytyqi, H., Kugler, W., Mehmeti, H., Berisha, K., Simcic, M., Magdy, M., and Lühken, G.: Capturing Genetic Diversity and Selection Signatures of the Endangered Kosovar Balusha Sheep Breed, Genes-Basel, 13, 866, https://doi.org/10.3390/genes13050866, 2022.
Al-Mamun, H. A., Clark, S. A., Kwan, P., and Gondro, C.: Genome-wide linkage disequilibrium and genetic diversity in five populations of Australian domestic sheep, Genet. Sel. Evol., 47, 90, https://doi.org/10.1186/s12711-015-0169-6, 2015.
Barbato, M., Orozco-TerWengel, P., Tapio, M., and Bruford, M. W.: SNeP: a tool to estimate trends in recent effective population size trajectories using genome-wide SNP data, Front. Genet., 6, 109, https://doi.org/10.3389/fgene.2015.00109, 2015.
Birky, C. W., Maruyama, T., and Fuerst, P.: An Approach to Population and Evolutionary Genetic Theory for Genes in Mitochondria and Chloroplasts, and Some Results, Genetics, 103, 513–527, 1983.
BLE, Central Documentation on Animal Genetic Resources in Germany (TGRDEU): Livestock animals: Sheep: Rauhwolliges Pommersches Landschaf, https://tgrdeu.genres.de/en/livestock-animals/search-for-animal-species, last access: 30 October 2024.
Bradley, D., Fries, R., Bumstead, N., Nicholas, F., Cothran, E., Ollivier, L., and Crawford, A.: Secondary guidelines for development of national farm animal genetic resources management plans: Management of small populations at risk, FAO, https://openknowledge.fao.org/items/498e808d-088a-4ad4-9215-6dc8f3a5ff39 (last access: 8 August 2024)1998.
Burren, A., Neuditschko, M., Signer-Hasler, H., Frischknecht, M., Reber, I., Menzi, F., Drögemüller, C., and Flury, C.: Genetic diversity analyses reveal first insights into breed-specific selection signatures within Swiss goat breeds, Anim. Genet., 47, 727–739, https://doi.org/10.1111/age.12476, 2016.
Chang, C. C., Chow, C. C., Tellier, L. C., Vattikuti, S., Purcell, S. M., and Lee, J. J.: Second-generation PLINK: rising to the challenge of larger and richer datasets, Gigascience, 4, 7, https://doi.org/10.1186/s13742-015-0047-8, 2015.
Chen, W.: KING: Kinship-based Inference for Gwas, https://www.kingrelatedness.com/manual.shtml, last access: 8 September 2024.
Corbin, L. J., Liu, A. Y., Bishop, S. C., and Woolliams, J. A.: Estimation of historical effective population size using linkage disequilibria with marker data, J. Anim. Breed. Genet., 129, 257–270, https://doi.org/10.1111/j.1439-0388.2012.01003.x, 2012.
Curik, I., Ferencakovic, M., and Sölkner, J.: Inbreeding and runs of homozygosity: A possible solution to an old problem, Livest. Sci., 166, 26–34, https://doi.org/10.1016/j.livsci.2014.05.034, 2014.
Drögemüller, C., De Vries, F., Hamann, H., Leeb, T., and Distl, O.: Breeding German sheep for resistance to scrapie, Vet. Rec., 154, 257–260, https://doi.org/10.1136/vr.154.9.257, 2004.
Eydivandi, S., Roudbar, M. A., Ardestani, S. S., Momen, M., and Sahana, G.: A selection signatures study among Middle Eastern and European sheep breeds, J. Anim. Breed. Genet., 138, 574–588, https://doi.org/10.1111/jbg.12536, 2021.
FAO: European Farm Animal Biodiversity Information System (EFABIS), https://www.fao.org/dad-is/regional-national-nodes/efabis/en/, last access: 5 August 2024.
Falge, R., Terletski, V., Mendel, C., Grumbach, S., Gerdes, K., Carnwath, J., and Niemann, H.: Schätzung des mittleren Heterozygotiegrades aus DNA-Fingerprints bei einheimischen Landschafrassen des norddeutschen und süddeutschen Raumes, Züchtungskunde, 71, 147–157, 1999.
Frölich, C., Lühken, G., and Ganter, M.: Maedi-visna in Pomeranian Coarsewool sheep in Germany: Seroprevalence, environmental and genetic risk factors, Research Square [preprint], https://doi.org/10.21203/rs.3.rs-4678425/v1, 2024.
Gaede, U.: Das Pommersche grauwollige Landschaf, University of Jena, https://ig-pommernschafe.de/service/downloads.html (last access: 30 July 2024), 1926.
GEH: Die Rote Liste: https://www.g-e-h.de/rote-liste-menu/rote-liste, last access: 5 August 2024.
Ginestet, C.: ggplot2: Elegant Graphics for Data Analysis, J. R. Stat. Soc. A, 174, 245–245, https://doi.org/10.1111/j.1467-985X.2010.00676_9.x, 2011.
Gorssen, W., Meyermans, R., Buys, N., and Janssens, S.: SNP genotypes reveal breed substructure, selection signatures and highly inbred regions in Pietrain pigs, Anim. Genet., 51, 32–42, https://doi.org/10.1111/age.12888, 2020.
Goudet, J.: HIERFSTAT, a package for R to compute and test hierarchical F-statistics, Mol. Ecol. Notes, 5, 184–186, https://doi.org/10.1111/j.1471-8286.2004.00828.x, 2005.
Graffelman, J.: Exploring Diallelic Genetic Markers: The HardyWeinberg Package, J. Stat. Softw., 64, 3, https://doi.org/10.18637/jss.v064.i03, 2015.
Grumbach, S.: Rauhwollige Pommersche Landschafe 1982 bis 2002 20 Jahre erfolgreiche Erhaltungszucht, https://ig-pommernschafe.de/service/downloads.html (last access: 30 July 2024), 2002.
Grumbach, S. and Zupp, W.: Rauhwolliges Pommersches Landschaf wieder im Aufwind, Deutsche Schafzucht, 22, 512–514, 1992.
Grumbach, S. and Zupp, W.: Online-Broschüre Schwerpunkt Schafe, Ziegen Gebrauchshunde, https://www.g-e-h.de/images/stories/rassebeschreib/schaf/Das Rauhwollige Pommersche.pdf (last access: 10 August 2024), 2008.
Handley, L. J. L., Byrne, K., Santucci, F., Townsend, S., Taylor, M., Bruford, M. W., and Hewitt, G. M.: Genetic structure of European sheep breeds, Heredity, 99, 620–631, https://doi.org/10.1038/sj.hdy.6801039, 2007.
Heaton, M. P., Clawson, M. L., Chitko-Mckown, C. G., Leymaster, K. A., Smith, T. P., Harhay, G. P., White, S. N., Herrmann-Hoesing, L. M., Mousel, M. R., Lewis, G. S., Kalbfleisch, T. S., Keen, J. E., and Laegreid, W. W.: Reduced lentivirus susceptibility in sheep with TMEM154 mutations, PLoS Genet., 8, e1002467, https://doi.org/10.1371/journal.pgen.1002467, 2012.
IGRPL: 20 Jahre erfolgreiche Erhaltungszucht 1982–2002, https://www.ig-pommernschafe.de/historisches/historie-1982-2002.html, last access: 5 October 2024.
Keller, L. F. and Waller, D. M.: Inbreeding effects in wild populations, Trends Ecol. Evol., 17, 230–241, https://doi.org/10.1016/S0169-5347(02)02489-8, 2002.
Kijas, J. W., Townley, D., Dalrymple, B. P., Heaton, M. P., Maddox, J. F., McGrath, A., Wilson, P., Ingersoll, R. G., McCulloch, R., McWilliam, S., Tang, D., McEwan, J., Cockett, N., Oddy, V. H., Nicholas, F. W., Raadsma, H., and Conso, I. S. G.: A Genome Wide Survey of SNP Variation Reveals the Genetic Structure of Sheep Breeds, Plos One, 4, e4668, https://doi.org/10.1371/journal.pone.0004668, 2009.
Kijas, J. W., Lenstra, J. A., Hayes, B., Boitard, S., Neto, L. R. P., San Cristobal, M., Servin, B., McCulloch, R., Whan, V., Gietzen, K., Paiva, S., Barendse, W., Ciani, E., Raadsma, H., McEwan, J., Dalrymple, B., and Consortium, I. S. G.: Genome-Wide Analysis of the World's Sheep Breeds Reveals High Levels of Historic Mixture and Strong Recent Selection, Plos Biol., 10, 2, https://doi.org/10.1371/journal.pbio.1001258, 2012.
Laoun, A., Harkat, S., Lafri, M., Gaouar, S. B. S., Belabdi, I., Ciani, E., De Groot, M., Blanquet, V., Leroy, G., Rognon, X., and Da Silva, A.: Inference of Breed Structure in Farm Animals: Empirical Comparison between SNP and Microsatellite Performance, Genes-Basel, 11, 57, https://doi.org/10.3390/genes11010057, 2020.
Lenstra, J. A., Groeneveld, L. F., Eding, H., Kantanen, J., Williams, J. L., Taberlet, P., Nicolazzi, E. L., Sölkner, J., Simianer, H., Ciani, E., Garcia, J. F., Bruford, M. W., Ajmone-Marsan, P., and Weigend, S.: Molecular tools and analytical approaches for the characterization of farm animal genetic diversity, Anim. Genet., 43, 483–502, https://doi.org/10.1111/j.1365-2052.2011.02309.x, 2012.
Mayo, O.: A century of Hardy-Weinberg equilibrium, Twin Res. Hum. Genet., 11, 3, https://doi.org/10.1375/twin.11.3.249, 2008.
McQuillan, R., Leutenegger, A. L., Abdel-Rahman, R., Franklin, C. S., Pericic, M., Barac-Lauc, L., Smolej-Narancic, N., Janicijevic, B., Polasek, O., Tenesa, A., MacLeod, A. K., Farrington, S. M., Rudan, P., Hayward, C., Vitart, V., Rudan, I., Wild, S. H., Dunlop, M. G., Wright, A. F., Campbell, H., and Wilson, J. F.: Runs of homozygosity in European populations, Am. J. Hum. Genet., 83, 359–372, https://doi.org/10.1016/j.ajhg.2008.08.007, 2008.
Mendelsohn, R.: The challenge of conserving indigenous domesticated animals, Ecol. Econ., 45, 501–510, https://doi.org/10.1016/S0921-8009(03)00100-9, 2003.
Meyermans, R., Gorssen, W., Wijnrocx, K., Lenstra, J. A., Vellema, P., Buys, N., and Janssens, S.: Unraveling the genetic diversity of Belgian Milk Sheep using medium-density SNP genotypes, Anim. Genet., 51, 258–265, https://doi.org/10.1111/age.12891, 2020a.
Meyermans, R., Gorssen, W., Buys, N., Janssens, S.: How to study runs of homozygosity using PLINK? A guide for analyzing medium density SNP data in livestock and pet species, BMC Genomics, 21, 1–14, https://doi.org/10.1186/s12864-020-6463-x, 2020b.
Molaee, V., Eltanany, M., and Luhken, G.: First survey on association of TMEM154 and CCR5 variants with serological maedi-visna status of sheep in German flocks, Vet. Res., 49, 36, https://doi.org/10.1186/s13567-018-0533-y, 2018.
Nei, M. and Chesser, R. K.: Estimation of Fixation Indexes and Gene Diversities, Ann. Hum. Genet., 47, 253–259, https://doi.org/10.1111/j.1469-1809.1983.tb00993.x, 1983.
Peripolli, E., Munari, D. P., Silva, M. V. G. B., Lima, A. L. F., Irgang, R., and Baldi, F.: Runs of homozygosity: current knowledge and applications in livestock, Anim. Genet., 48, 255–271, https://doi.org/10.1111/age.12526, 2017.
Purfield, D. C., Berry, D. P., McParland, S., and Bradley, D. G.: Runs of homozygosity and population history in cattle, Bmc Genet., 13, 70, https://doi.org/10.1186/1471-2156-13-70, 2012.
Purfield, D. C., McParland, S., Wall, E., and Berry, D. P.: The distribution of runs of homozygosity and selection signatures in six commercial meat sheep breeds, Plos One, 12, e0176780, https://doi.org/10.1371/journal.pone.0176780, 2017.
Rege, J. E. O. and Gibson, J. P.: Animal genetic resources and economic development: issues in relation to economic valuation, Ecol. Econ., 45, 319–330, https://doi.org/10.1016/S0921-8009(03)00087-9, 2003.
Reina, R., Berriatua, E., Luján, L., Juste, R., Sánchez, A., de Andrés, D., and Amorena, B.: Prevention strategies against small ruminant lentiviruses: An update, Vet. J., 182, 31–37, https://doi.org/10.1016/j.tvjl.2008.05.008, 2009.
Rischkowsky, B. and Pilling, D.: The state of the world's animal genetic resources for food and agriculture, FAO, https://www.fao.org/4/a1250e/a1250e00.htm (last access: 8 August 2024), 2007.
Scherf, B.: Worldwatch list, FAO, https://www.fao.org/4/x8750e/x8750e00.htm (last access: 8 August 2024), 2000.
Scherf, B. D. and Pilling, D.: The second report on the state of the world's animal genetic resources for food and agriculture, FAO, https://www.fao.org/4/i4787e/i4787e00.htm (last access: 8 August 2024), 2015.
Signer-Hasler, H., Burren, A., Neuditschko, M., Frischknecht, M., Garrick, D., Stricker, C., Gredler, B., Bapst, B., and Flury, C.: Population structure and genomic inbreeding in nine Swiss dairy cattle populations, Genet. Sel. Evol., 49, 83, https://doi.org/10.1186/s12711-017-0358-6, 2017.
Signer-Hasler, H., Burren, A., Ammann, P., Drgemller, C., and Flury, C.: Runs of homozygosity and signatures of selection: a comparison among eight local Swiss sheep breeds, Anim. Genet., 50, 512–525, https://doi.org/10.1111/age.12828, 2019.
Sveistiene, R. and Tapio, M.: SNPs in Sheep: Characterization of Lithuanian Sheep Populations, Animals-Basel, 11, 2651, https://doi.org/10.3390/ani11092651, 2021.
Tisdell, C.: Socioeconomic causes of loss of animal genetic diversity: analysis and assessment, Ecol. Econ., 45, 365–376, https://doi.org/10.1016/S0921-8009(03)00091-0, 2003.
VDL: VDL-Statistik 2023 Entwicklung und Leistungen der Herdbuchzucht 2023, https://lsv-st.de/landesschafzuchtverband/userfiles/downloads/Termine_2024/vdl_bericht_herdbuchzucht_schaf_2023.pdf (last access: 15 October 2024), 2023.
Weir, B. S. and Hill, W. G.: Effect of Mating Structure on Variation in Linkage Disequilibrium, Genetics, 95, 477–488, 1980.
White, S. N. and Knowles, D. P.: Expanding Possibilities for Intervention against Small Ruminant Lentiviruses through Genetic Marker-Assisted Selective Breeding, Viruses-Basel, 5, 1466–1499, https://doi.org/10.3390/v5061466, 2013.
Wiener, P., Sánchez-Molano, E., Clements, D. N., Woolliams, J. A., Haskell, M. J., and Blott, S. C.: Genomic data illuminates demography, genetic structure and selection of a popular dog breed, BMC Genomics, 18, 609, https://doi.org/10.1186/s12864-017-3933-x, 2017.
Wilkens, J.: Central information processing in German sheep and goat breeding, Genetic Resources, 2, 11, https://doi.org/10.46265/genresj.QULD1720, 2021.
Williams, J. L.: The use of marker-assisted selection in animal breeding and biotechnology, Revue Scientifique Et Technique-Office International Des Epizooties, 24, 379–391, https://doi.org/10.20506/rst.24.1.1571, 2005.
Yang, J., Li, W.-R., Lv, F.-H., He, S.-G., Tian, S.-L., Peng, W.-F., Sun, Y.-W., Zhao, Y.-X., Tu, X.-L., and Zhang, M.: Whole-genome sequencing of native sheep provides insights into rapid adaptations to extreme environments, Mol. Biol. Evol., 33, 2576–2592, https://doi.org/10.1093/molbev/msw129, 2016.